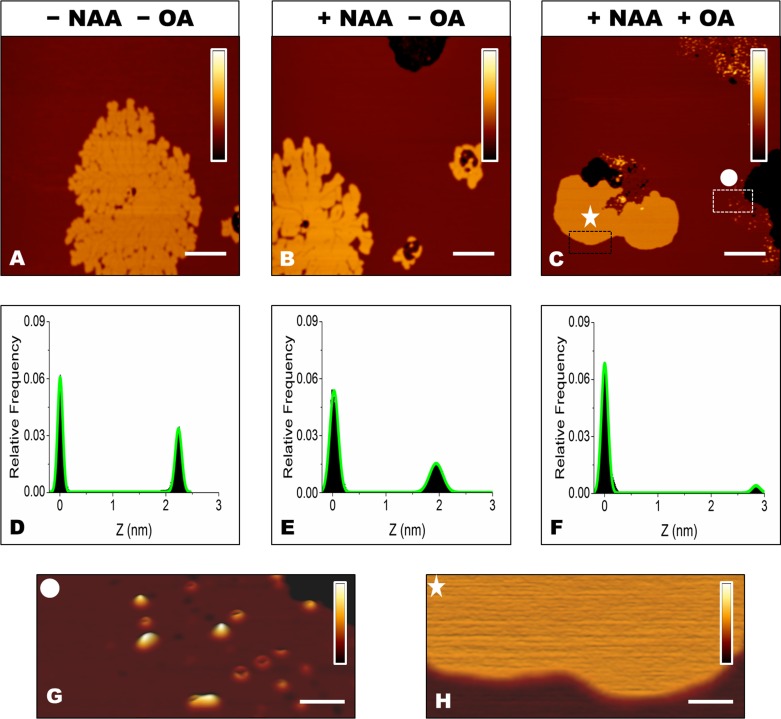
Figure 5.
A., B., C. SLBs containing 5.0% GM1 before A.and after B., C. treatment with NAA, and before A., B. and after C. administration of 12 μM OA. The colour bars correspond to a Z range of 8.0 nm. Scale bars: 1.0 μm. D.,E.,F. Height distributions taken from the images shown in panels A, B and C, respectively, fitted to the sum of two Gaussian functions (green lines). G., H. Magnification of the rectangular areas marked in panel C. After removal of the negatively charged sialic acid, protein aggregates are present in the Lα domain G., but not in Lβ domains H.. The colour bars correspond to a Z range of 5.0 nm. Scale bars: 100 nm.

