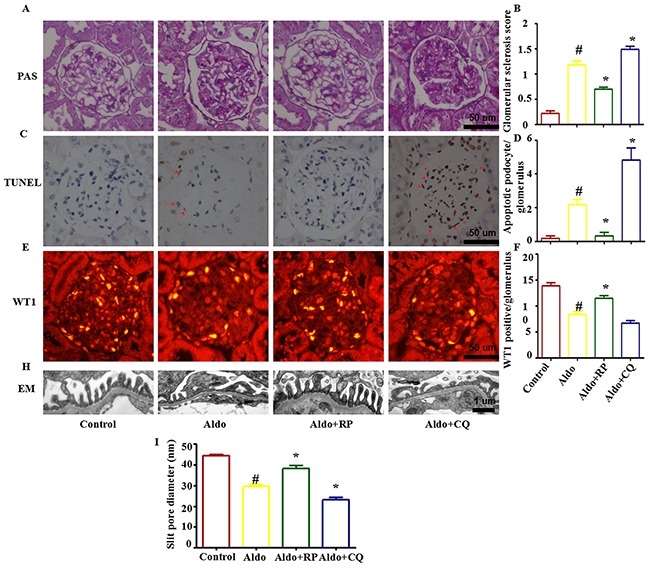
Figure 10. Effects of RP and CQ on podocyte injury in Aldo-induced rats.

A. The light microscopic appearance of representative glomeruli stained with PAS. Scale bar=50 μm. B. Results of the semi-quantitative analysis. C. The TUNEL assay in renal cortex sections of control and Aldo-infused rats. The red arrow indicates TUNEL-positive podocytes. Scale bar=50 μm.D. The bar graph indicates the mean number of TUNEL-positive podocytes per glomerular cross-section. E. Representative images of WT-1 immunostaining, a surrogate marker for podocyte number, in kidney tissues from each group mentioned above. Scale bar=50 μm.F. Quantification of WT-1-positive cells per glomerulus. G. Foot processes of podocytes by transmission electron microscopy (TEM) Scale bar=1 μm. H. Quantitative analysis of the slit pore diameter. Results (means±SEM) of 6 series of experiments. *P<0.05 vs. normal control, #P<0.05 vs. Aldo alone.
