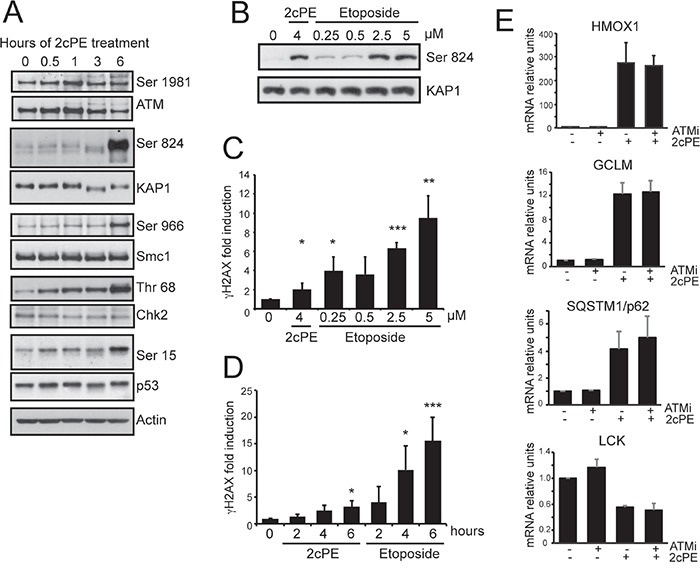
Figure 7. 2cPE activates ATM signaling.

A. Activation of the ATM signaling pathway in response to 2cPE treatment. Cellular lysates were generated at the indicated time points and subjected to immunoblot analysis. The detected proteins and their phosphorylated forms are indicated. Actin was used as loading control. B. Immunoblot analysis comparing ATM activation in response to etoposide and 2cPE. KAP1 phosphorylation was used as read-out for ATM activation. MEC-1 cells were treated for 6 h with the indicated concentrations of the two drugs. C. Quantitative cytofluorimetric analysis of γH2AX positivity as marker of DNA damage induction. MEC-1 cells were treated for 6 hours with the indicated concentrations of the two drugs. D. Time-course of γH2AX positivity by quantitative cytofluorimetric analysis. MEC-1 cells were treated for the indicated hours with 4μM of 2cPE or 2.5μM of etoposide. E. Time-course analysis of HOMX, GCLM, SQSTM and LCK mRNA expression levels in MEC-1 cells treated with 4μM of 2cPE in the presence of the ATM inhibitor KU-55933. Cells were pre-treated for 1 hour with KU-55933 (10μM), next, 2cPE was added for further 6 h. Columns, mean (n = 3); bars, SD. *=p<0.05; **=p<0.01; ***p=<0.005.
