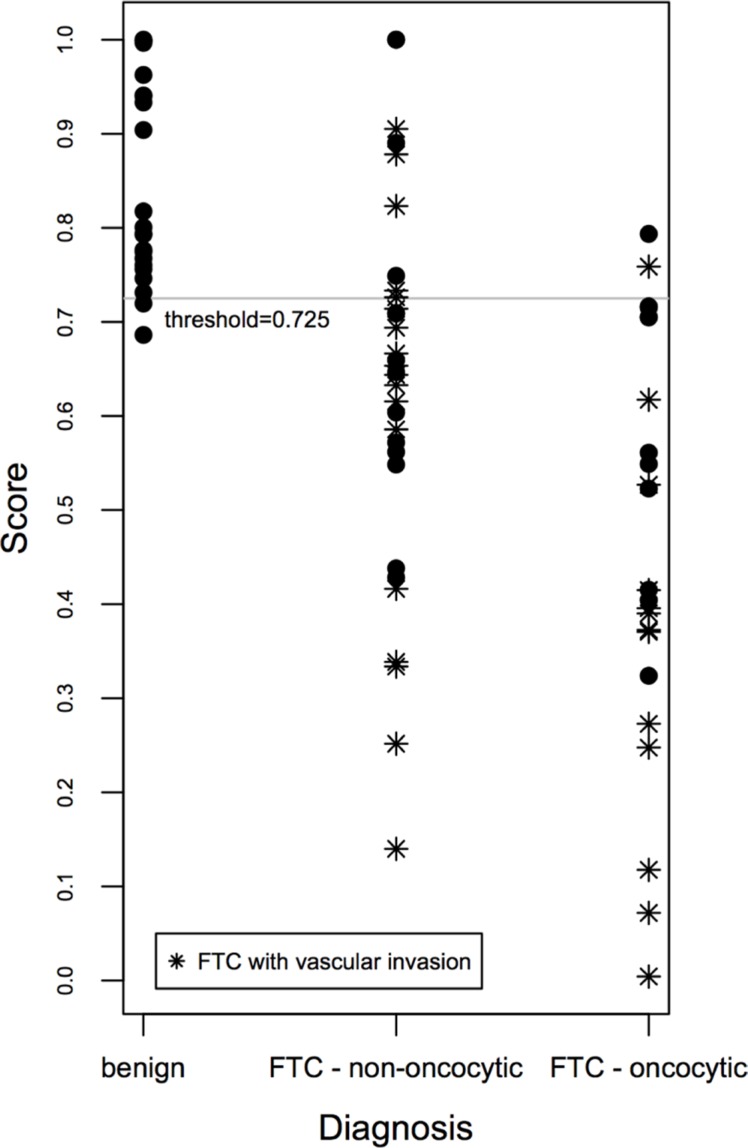
Figure 1. Scatter plot of the gene expression-based predictive score correlated with FTC aggressiveness.
The gene expression-based score for benign and FTC samples was calculated based on joint expression levels of CHEK1, c-KIT, SLC26A4, TG and TPO transcripts. Thus obtained score values were plotted for three clusters: benign, non-oncocytic FTC and oncocytic FTC, and allowed for a clear distinction between these groups.

