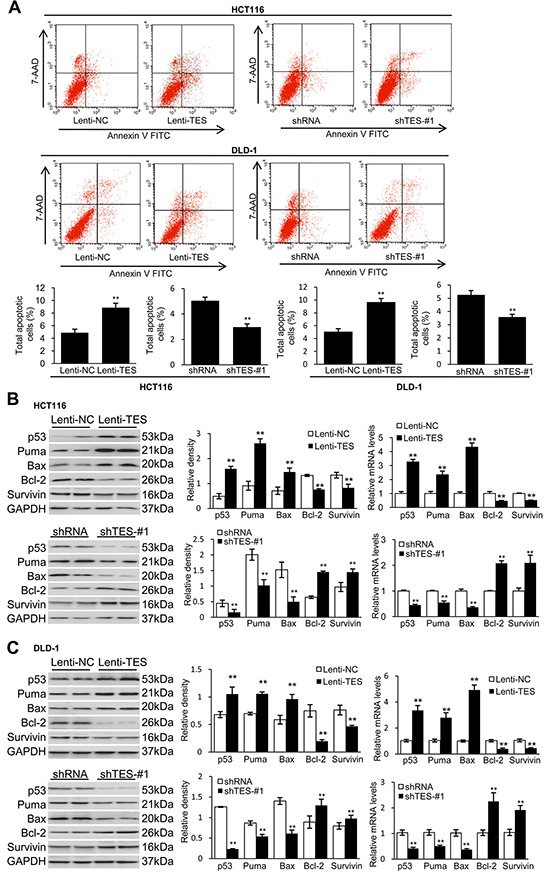
Figure 4. TES promotes apoptosis in CRC cells.

The genetically modified HCT116 and DLD-1 cells were grown over time respectively. A. Cell apoptosis was measured by flow cytometric analyses. Representative biparametric histogram showing cell population in apoptotic (top right and bottom right quadrants), viable (bottom left quadrant) and necrotic (top left quadrant) states. B. Protein levels and mRNA expression of p53, Puma, Bax, Bcl-2 and survivin of HCT116 cells. C. Protein levels and mRNA expression of p53, Puma, Bax, Bcl-2 and survivin of DLD-1 cells. GAPDH was used as loading control. ** p < 0.01. Data are plotted as the mean ± SD from five independent experiments. Bars indicate the standard deviation of the mean.
