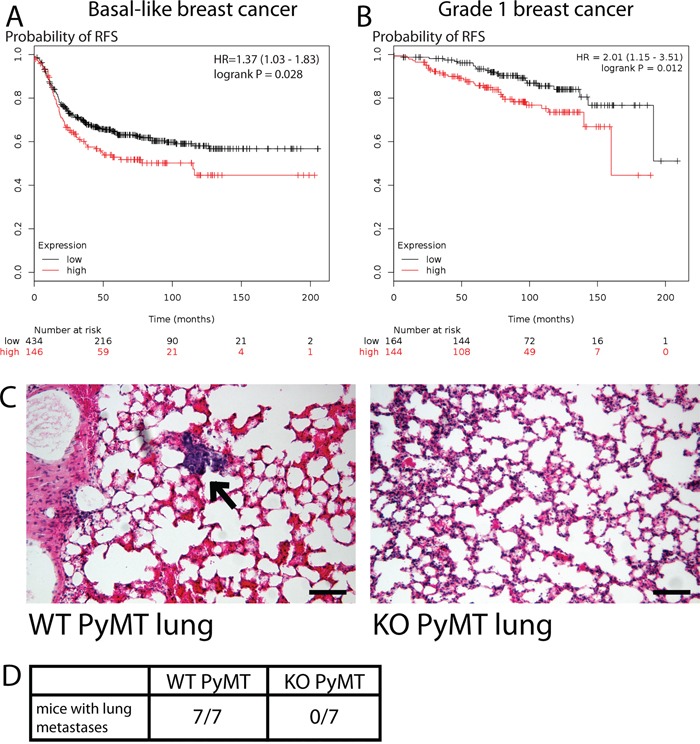
Figure 5. MYO1E expression correlates with poor breast cancer patient outcome and regulates tumor cell metastasis.

A, B. Kaplan-Meier survival curves showing probability of relapse-free survival in patients with basal-like (A) or grade 1 (B) breast cancer with the low or high levels of MYO1E expression. The optimal expression threshold was autoselected by K-M plotter software. Hazard ratio (with confidence intervals) and logrank probability values are included on each graph. C. representative images of lungs dissected from MYO1E WT PyMT and KO PyMT mice at 16 weeks of age. A metastasis is labeled by an arrow. Scale bar, 100 um. D. number of mice showing lung metastasis in MYO1E WT PyMT and KO PyMT animals at 16 weeks of age (WT n=7, KO n=7).
