Abstract
Atlases constructed using diffusion-weighted imaging (DWI) are important tools for studying human brain development. Atlas construction is in general a two-step process involving image registration and image fusion. The focus of most studies so far has been on improving registration thus image fusion is commonly performed using simple averaging, often resulting in fuzzy atlases. In this paper, we propose a patch-based method for DWI atlas construction. Unlike other atlases that are based on the diffusion tensor model, our atlas is model-free. Instead of generating an atlas for each gradient direction independently and hence neglecting inter-image correlation, we propose to construct the atlas by jointly considering diffusion-weighted images of neighboring gradient directions. We employ a group regularization framework where local patches of angularly neighboring images are constrained for consistent spatio-angular atlas reconstruction. Experimental results verify that our atlas, constructed for neonatal data, reveals more structural details compared with the average atlas especially in the cortical regions. Our atlas also yields greater accuracy when used for image normalization.
1 Introduction
MRI brain atlases are important tools that are widely used for neuroscience studies and disease diagnosis [3]. Atlas-based MRI analysis is one of the major methods used to identify typical and abnormal brain development [2]. Among different modalities for human brain mapping, diffusion-weighted imaging (DWI) is a unique modality for investigating white matter structures [1]. DWI is especially important for studies of babies since it can provide rich anatomical information despite the pre-myelinated neonatal brain [4]. But, application of atlases constructed from pediatric or adult population to neonatal brain is not straightforward, given that there are significant differences in the white matter structures between babies and older ages. Therefore, creation of atlases exclusively from neonatal population will be appealing for neonatal brain studies.
Various models have been used to characterize the diffusion of water molecules measured by the diffusion MRI signal [5]. The most common representation is the diffusion tensor model (DTM). However, DTM is unable to model multiple fiber crossings. There are other flexible approaches, such as multi-tensor model, diffusion spectrum imaging and q-ball imaging which are capable of delineating complex fiber structures. Most atlases acquired from diffusion MRI signal are DTM-based. In this work we focus on constructing a model-free atlas, based on the raw 4D diffusion-weighted images. This way we ensure that any model can later be applied on the atlas.
Usually construction of atlases involves two steps: An image registration step to align a population of images to a common space, followed by an atlas fusion step that combines all the aligned images. The focus of most atlas construction methods has been on the image registration step [7]. For the atlas fusion step, simple averaging is normally used. Averaging the images will cause the fine anatomical details to be smoothed out, resulting in blurry structures. Moreover, the outcome of simple averaging is sensitive to outliers. To overcome these drawbacks, Shi et al. [8] proposed a patch-based sparse representation method for image fusion. By leveraging over-complete codebooks of local neighborhoods, sparse subsets of samples will be automatically selected for fusion to form the atlas, and outliers are removed in the process. Also using group LASSO [6], they have constrained the spatial neighboring patches in T2-weighted atlas to have similar representations.
In constructing a DWI atlas, we need to ensure consistency between neighboring gradient directions. In this paper, we propose to employ a group-regularized estimation framework to enforce spatio-angular consistency in constructing the atlas in a patch-based manner. Each patch in the atlas is grouped together with the corresponding patches in the spatial and angular neighborhoods to have similar representations. Meanwhile, representation of each patch-location remains the same among selected population of images. We apply our proposed atlas selection method to neonatal data which often have poor contrast and low density of fibers. Experimental results indicate that our atlas outperforms the average atlas both qualitatively and quantitatively.
2 Proposed Method
2.1 Overview
All images are registered to the geometric median image of the population. The registration is done based on Fractional Anisotropy (FA) image by using affine registration followed by nonlinear registration with Diffeomorphic Demons [10]. The images are then upsampled to 1mm isotropic resolution. For each gradient direction, each patch of the atlas is constructed via a combination of a sparse set of neighboring patches from the population of images.
2.2 Atlas Construction via Spatio-Angular Consistency
We construct the atlas in a patch-by-patch manner. For each gradient direction, we construct a codebook for each patch of size s × s × s on the atlas. Each patch is represented using a vector of size M = s3. An initial codebook (C) can include all the same-location patches in all the N subject images. However, in order to account for registration errors, we further include 26 patches of immediate neighboring voxels, giving us 27 patches per subject and a total of N̄ = 27 × N patches in the cookbook, i.e., C = [p1, p2, …, pN̄].
Each patch is constructed using the codebook based on K reference patches from the same location, i.e., {yk|k = 1, …, K}. Assuming high correlation between these patches, we measure their similarity by the Pearson correlation coefficient. Thus for patches pi and pj, the similarity is computed as:
| (1) |
The group center of patches is computed as the mean patch, i.e., . patches which are close to the group center are generally more representative of the whole population, while patches far from the group center may be outliers and degrade the constructed atlas. Therefore, we only select the K nearest (most similar) patches to the group center as the reference patches.
Each patch is constructed by sparsely representing the K reference patches using the codebook C. This is achieved by estimating the coefficient vector x in the following problem [9]:
| (2) |
where C ∈ ℝM × N̄, x ∈ ℝN̄ × 1, yk ∈ ℝM × 1. The first term measures the squared L2 distance between reference patch yk and the reconstructed atlas patch Cx. The second term is the L1-norm of the coefficient vector x, which ensures sparsity. λ ≥ 0 is the tuning parameter.
To promote spatial consistency, we further constrain nearby patches to be constructed using similar corresponding patches in the codebooks. The coefficient vectors of the patches corresponding to 6-connected voxels are regularized in G = 7 groups in the problem described next. Each atlas patch corresponds to one of the groups. Let Cg, xg, and yk,g represent the codebook, coefficient vector, and reference patch for the g-th group, respectively. We use X = [x1, …, xG] as the matrix grouping the coefficients in columns. X can also be described in terms of row vectors X = [u1; … ; uN̄], where ui indicates the i-th row. Then, Eq. (2) can be rewritten as the following group LASSO problem [6]:
| (3) |
where . To consider images of different gradient directions, d = 1, …, D, we further modify Eq. (3) as follows:
| (4) |
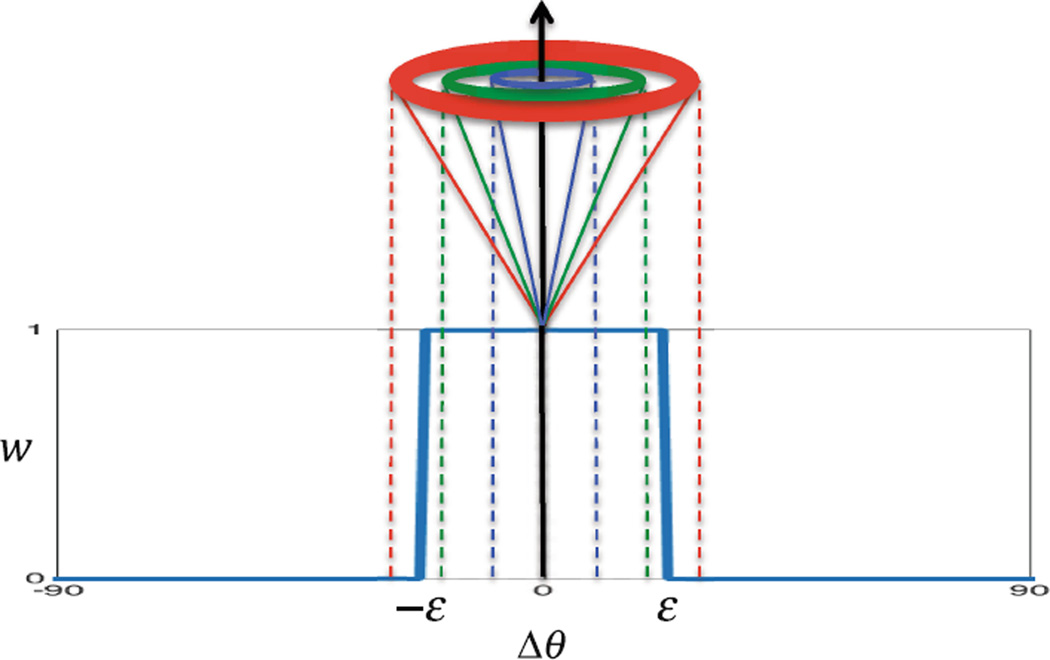
where , and denote the codebook, coefficient vector, and reference patch for the g-th spatial location and d-th gradient direction, respectively. Here, we have binary-weighted each representation task as well as regularization belonging to gradient direction d, with the participation weight wd for direction d defined as (Fig. 1)
| (5) |
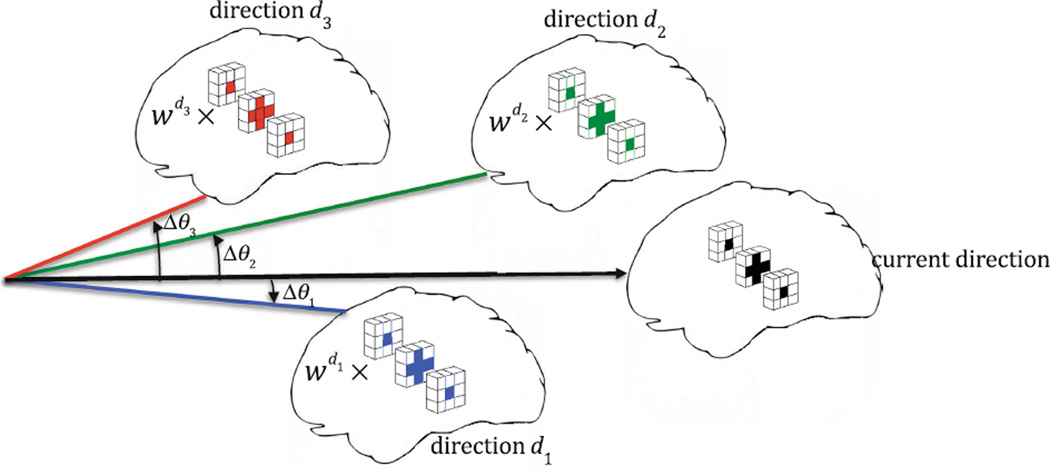
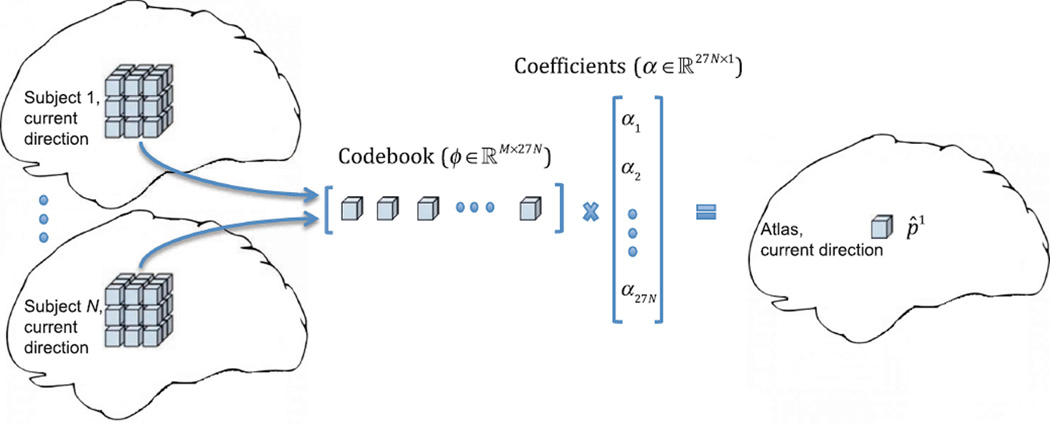
where ε is the angular distance threshold. According to Eq. (5), wd is dependent on the angular distance between current orientation (υ1) and orientation d (υd). This will allow an atlas patch to be constructed jointly using patches in both spatial and angular neighborhoods (Fig. 2). Eventually the atlas patch p̂1 at current direction is reconstructed sparsely from an overcomplete codebook obtained from local neighborhood in all subject images at current direction, using coefficients obtained from Eq. (4). Thus p̂1 = ϕα (Fig. 3).
Fig. 1.
The participation weight for each gradient direction is determined based on its angular distance from the current direction.
Fig. 2.
Example patches in the spatial and angular neighborhood that are constrained to have similar representations.
Fig. 3.
Construction of a patch on the atlas by sparse representation.
3 Experimental Results
3.1 Dataset
We use neonatal brain images to evaluate the performance of the proposed atlas construction method. 15 healthy neonatal subjects (9 males/6 females) are scanned. The subjects were scanned at postnatal age of 10–35 days using a 3T Siemens Allegra scanner. The scans were acquired with size 128 × 96 × 60 and resolution 2 × 2 × 2mm3 and were upsampled to 1 × 1 × 1mm3. Diffusion-weighting was applied along 42 directions with b = 1000 s/mm2. In addition, 7 non-diffusion-weighted images were obtained.
3.2 Parameter Settings
The parameters are selected empirically. The patch size was chosen as s = 6 with 3 voxels overlapping in each dimension. The number of reference patches is set to K = 6, the tuning parameter to λ = 0.05, and the angular distance threshold to ε = 22°. Under this setting, the median number of neighbor directions for each gradient direction in our dataset is 2.
3.3 Quality of Constructed Atlas
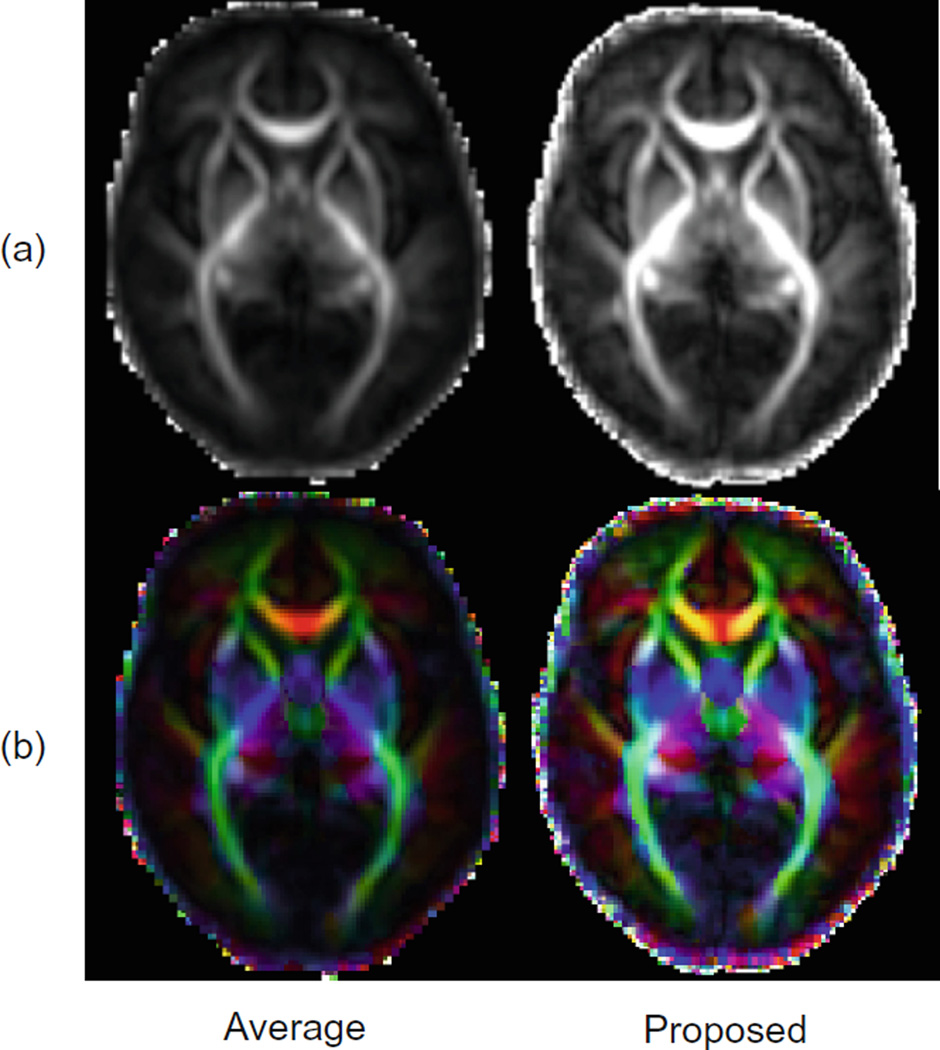
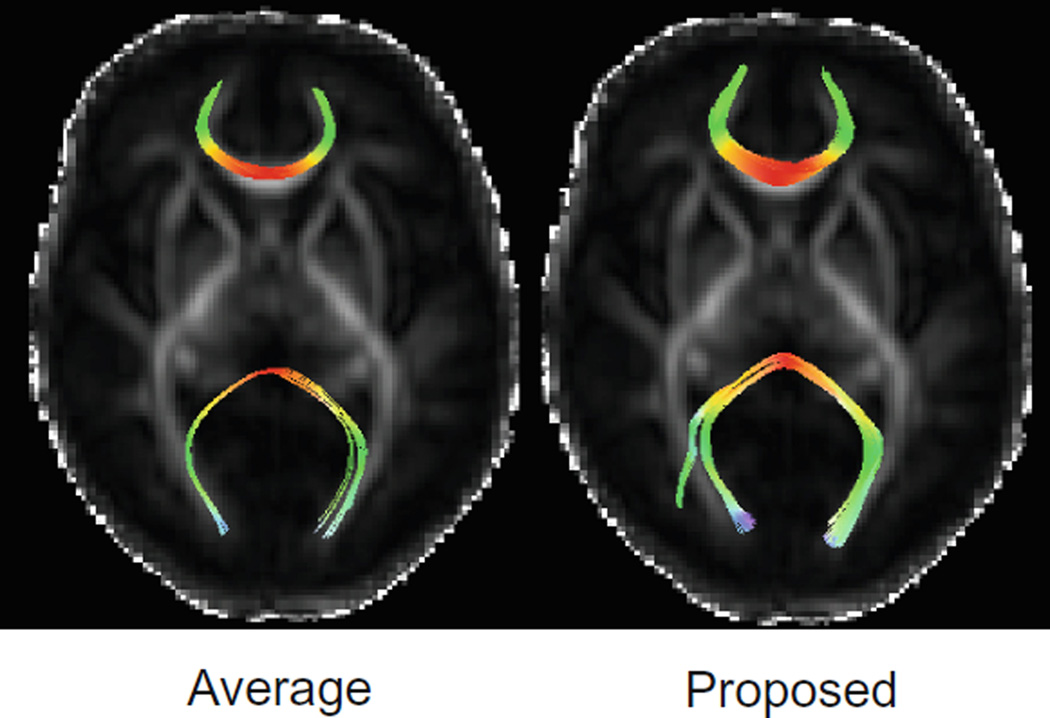
Figure 4(a) shows the FA maps of the produced atlases using averaging and our method. The atlas produced using our method reveals greater structural details specially in the cortical regions. This is also confirmed from the color-coded orientation maps of FA shown in Fig. 4(b). We have also performed streamline fiber tractography on the estimated diffusion tensor parameters. We have applied minimum seed-point FA of 0.25, minimum allowed FA of 0.1, maximum turning angle of 45 degrees, and maximum fiber length of 1000 mm. We have extracted the forceps minor and forceps major based on the method explained in [11]. Figure 5 shows the results for forceps minor and forceps major in average and proposed atlases. As illustrated, our method is capable to reveal more fiber tracts throughout the white matter.
Fig. 4.
(a) FA maps and (b) color-coded orientation maps of FA for the atlases produced by averaging method and our proposed method. (b) is best viewed in color. (Color figure online)
Fig. 5.
Fiber tracking results for the forceps minor and forceps major, generated from average atlas (left) and our proposed atlas (right).
3.4 Evaluation of Atlas Representativeness
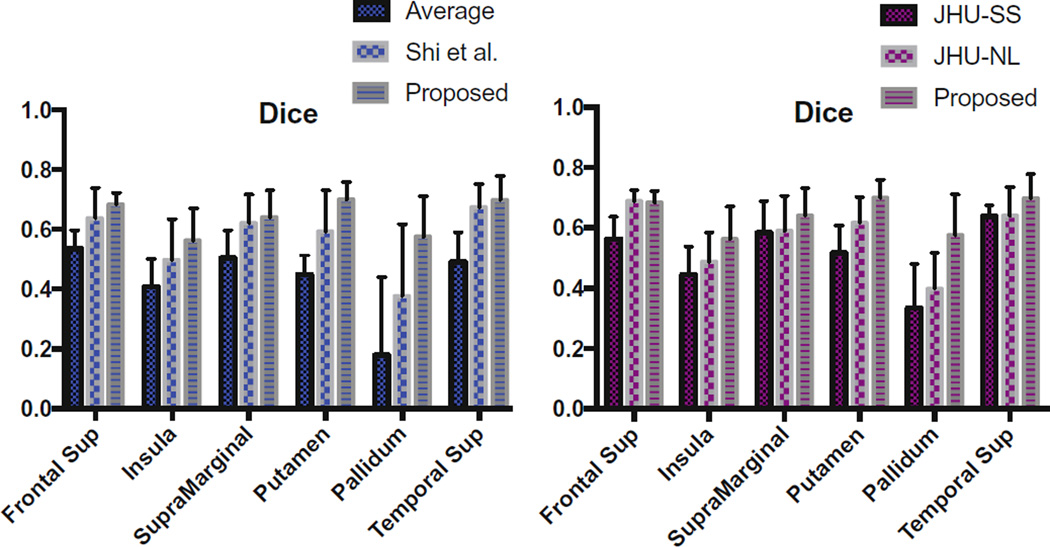
We also quantitatively evaluated our atlas in terms of how well it can be used to spatially normalize new data. For this, we used diffusion-weighted images of 5 new healthy neonatal subjects acquired at 37–41 gestational weeks using the same protocol described in Sect. 3.1. ROI labels from the Automated Anatomical Labeling (AAL) were warped to the T2-image spaces of the individual subjects, and were then in turn warped to the spaces of the diffusion-weighted images to the respective b = 0 images. Spatial normalization was performed by registering each subject’s FA map to the FA map of the atlas using affine registration followed by nonlinear registration with Diffeomorphic Demons [10]. The segmentation images were warped accordingly. For each atlas, a mean segmentation image was generated from all aligned label images based on voxel-wise majority voting. Aligned label images are compared to the atlas label image using Dice metric, which measures the overlap of two labels by 2 |A ∩ B| / (|A|+|B|), where A and B indicate the regions. The results shown in Fig. 6 indicate that our atlas outperforms the average atlas, Shi et al.’s atlas using spatial consistency, JHU Single-subject (JHU-SS) and JHU Nonlinear (JHU-NL) neonatal atlases [7].
Fig. 6.
The Dice ratios in the alignment of 5 new neonatal subjects by (Left) the average atlas vs. Shi et al. vs. proposed, (Right) JHU Single-Subject neonatal atlas vs. JHU Nonlinear neonatal atlas vs. proposed.
4 Conclusion
In this paper, we have proposed a novel method for DWI atlas construction that ensures consistency in both spatial and angular dimensions. Our approach construct each patch of the atlas by joint representation using spatio-angular neighboring patches. Experimental results confirm that, using our method, the constructed atlas preserves richer structural details compared with the average atlas. In addition, it yields better performance in neonatal image normalization.
References
- 1.Chilla GS, Tan CH, Xu C, Poh CL. Diffusion weighted magnetic resonance imaging and its recent trend: a survey. Quant. Imaging Med. Surg. 2015;5(3):407. doi: 10.3978/j.issn.2223-4292.2015.03.01. [DOI] [PMC free article] [PubMed] [Google Scholar]
- 2.Deshpande R, Chang L, Oishi K. Construction and application of human neonatal DTI atlases. Front. Neuroanat. 2015;9:138. doi: 10.3389/fnana.2015.00138. [DOI] [PMC free article] [PubMed] [Google Scholar]
- 3.Evans AC, Janke AL, Collins DL, Baillet S. Brain templates and atlases. Neuroimage. 2012;62(2):911–922. doi: 10.1016/j.neuroimage.2012.01.024. [DOI] [PubMed] [Google Scholar]
- 4.Huang H, Zhang J, Wakana S, Zhang W, Ren T, Richards LJ, Yarowsky P, Donohue P, Graham E, van Zijl PC, et al. White and gray matter development in human fetal, newborn and pediatric brains. Neuroimage. 2006;33(1):27–38. doi: 10.1016/j.neuroimage.2006.06.009. [DOI] [PubMed] [Google Scholar]
- 5.Johansen-Berg H, Behrens TE. Diffusion MRI: From Quantitative Measurement to In vivo Neuroanatomy. Cambridge: Academic Press; 2013. [Google Scholar]
- 6.Liu J, Ji S, Ye J. Proceedings of 25th Conference on Uncertainty in Artificial Intelligence. AUAI Press; 2009. Multi-task feature learning via efficient l 2, 1-norm minimization; pp. 339–348. [Google Scholar]
- 7.Oishi K, Mori S, Donohue PK, Ernst T, Anderson L, Buchthal S, Faria A, Jiang H, Li X, Miller MI, et al. Multi-contrast human neonatal brain atlas: application to normal neonate development analysis. Neuroimage. 2011;56(1):8–20. doi: 10.1016/j.neuroimage.2011.01.051. [DOI] [PMC free article] [PubMed] [Google Scholar]
- 8.Shi F, Wang L, Wu G, Li G, Gilmore JH, Lin W, Shen D. Neonatal atlas construction using sparse representation. Hum. Brain Mapp. 2014;35(9):4663–4677. doi: 10.1002/hbm.22502. [DOI] [PMC free article] [PubMed] [Google Scholar]
- 9.Tibshirani R. Regression shrinkage and selection via the lasso. J. Roy. Stat. Soc. Ser. B (Methodol.) 1996;58:267–288. [Google Scholar]
- 10.Vercauteren T, Pennec X, Perchant A, Ayache N. Diffeomorphic demons: efficient non-parametric image registration. NeuroImage. 2009;45(1):S61–S72. doi: 10.1016/j.neuroimage.2008.10.040. [DOI] [PubMed] [Google Scholar]
- 11.Wakana S, Caprihan A, Panzenboeck MM, Fallon JH, Perry M, Gollub RL, Hua K, Zhang J, Jiang H, Dubey P, et al. Reproducibility of quantitative tractography methods applied to cerebral white matter. Neuroimage. 2007;36(3):630–644. doi: 10.1016/j.neuroimage.2007.02.049. [DOI] [PMC free article] [PubMed] [Google Scholar]


