Abstract
Amadori product is an important and stable intermediate, which is produced during glycation process. It is a marker of hyperglycemia in diabetes mellitus, and its accumulation in the body contributes to microvascular complication of diabetes including diabetic nephropathy and retinopathy. In this study, the effect of acetoacetate on the formation of Amadori products and biophysical properties of human serum albumin (HSA), after incubation with glucose, was investigated using various methods. These included circular dichroism (CD), Fourier transform infrared (FTIR) spectroscopy, and UV–visible and fluorescence spectroscopy. Our results indicated that the production of Amadori products in HSA incubated with glucose (GHSA) was increased in the presence of acetoacetate. We also detected alterations in the secondary and tertiary structure of GHSA, which was increased in the presence of acetoacetate. These changes were attributed to the formation of covalent bonds between the carbonyl group of acetoacetate and the nucleophilic groups (lysine residues) of HSA. Thus, acetoacetate can enhance the production of Amadori products through formation of covalent bonds with biomaterials.
Keywords: Amadori product, Acetoacetate, Ketone body, Glycated HSA, Diabetes mellitus, Prolonged incubation
1. Introduction
Amadori product is a ketoamine that is produced during glycation process as a stable and important intermediate in the formation of advanced glycation end products (AGEs). Glycation is a spontaneous reaction between the free amino groups of biomacromolecules (such as proteins and lipids) and aldehyde or ketone groups of reduced sugars (such as glucose, fructose and ribose) upon covalent bond formation [1,2]. These reactions occur in three stages [3]. The first step (the early stage) is a nucleophilic attack of a carbonyl group by an electron pair of an amino group, which produces a Schiff base within hours [4]. The second step (the intermediate stage) is the rearrangement of the Schiff base to produce Amadori products within weeks [4]. The third step is the irreversible stage, which produces the AGEs through oxidation, dehydration and cyclization [5]. AGEs are yellow-brown, often fluorescent (some are non-fluorescent), intra- or inter-molecular cross-linked, and insoluble compounds [6], which contribute to pathogenesis of many diseases [7].
Amadori product is an important intermediate during AGE formation in vivo, and also in experimental conditions [8]. The level of Amadori products is increased in the blood and various tissues in diabetes [9], and it is a potential marker for hyperglycemia in diabetes mellitus [10]. The Amadori products of different proteins are found to be associated with diabetes and its complications [10]. Amadori products are involved in experimental hyperglycemia-induced microvascular complications [11]. They are associated with early and advanced nephropathy and retinopathy in Type 1 diabetic humans [12–14]. The increase in Amadori product concentration in diabetic animals was also linked with development and progression of diabetic retinopathy [15].
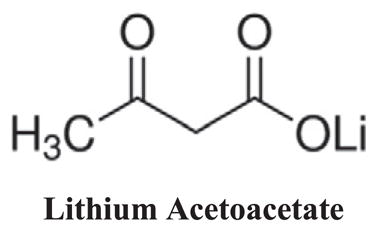
Ketone bodies are produced from the oxidation of fatty acids to provide the needed energy in the absence of available glucose in the liver [16,17]. The amount of circulating ketone bodies is from less than 5 μM after eating to more than 25 mM in acute diabetic patients [17]. Also, the concentration of ketone bodies increases during fasting [16]. There are three types of ketone bodies in the body, namely acetoacetate (AA), 3-β-hydroxybutyrate, and acetone [18]. Acetoacetate has a linear structure with two carbonyl groups. It cans glycate the aminophospholipids in the brain and this reaction is inhibited by urea [19].
Human serum albumin (HSA) is a multifunctional protein, which acts as an antioxidant, and carrier of endocrine compounds and drugs [20]. HSA is a single polypeptide with 585 residues containing 58 lysine [21]. Lysine residues can bind covalently with carbonyl groups of other compounds, such as carbohydrates including glucose and ribose. The more reactive lysine residues of HSA are Lys 525, Lys 439, Lys 281 and Lys 199 [22], and are important target of glycation.
The formation of Amadori products and AGEs play an important role in pathogenesis of many diseases including diabetes. In addition, the concentration of AA increases during diabetes. Thus, the major objective of this study was to determine the impact of AA on Maillard reaction and its consequence on the formation of Amadori products. Here we investigated the effect of AA on formation of Amadori products and structural changes of HSA incubated with glucose.
2. Materials and Methods
2.1. Materials
Human serum albumin (96%, essentially fatty acid free), Lithium acetoacetate, nitro-blue tetrazolium (NBT), L-cysteine and 5,5′-dithiobis, 2-nitrobenzoic acid (DTNB) were purchased from the Sigma-Aldrich Company. All solutions were prepared in 50 mM sodium phosphate buffer (pH 7.4). The final concentration of HSA in each experiment was 40 mg/mL (similar to the physiological concentration in the blood), which was prepared before use. β-D-glucose and 2,4,6-trinitrobenzene sulfonic acid (TNBSA; 0.01%) were purchased from the Fluka Company. All other chemicals were of analytical grade and were used without further purification.
2.2. Preparation of AGE-HSA
The final concentration of HSA was 40 mg/mL in 50 mM potassium phosphate (pH 7.4), 1 mM EDTA and 1 mM sodium azide. Glycation reaction of HSA was initiated by adding 16.5 mM β-D-glucose in either the presence or absence of 3 mM AA. The AA concentration was selected based on the AA concentration detected in diabetic individuals [23,24]. The incubation of HSA with all reagents was performed under sterile conditions at 37 °C, pH 7.4 and dark environment (physiological condition) for 7, 14 and 21 days. These incubation times were selected to provide sufficient time for the completion of the intermediate stage of HSA glycation and production of Amadori products [25]. Furthermore, the dark environment was chosen to mimic the physiological HSA environment in the human plasma. At the end of incubation time, all samples were dialyzed against 50 mM sodium phosphate buffer (pH 7.4) at 4 °C for 48 h, and then stored at −30 °C. Bicinchoinic acid (BCA) protein assay was used for the determination of protein concentration using a standard curve. The standard curve was generated using bovine serum albumin (BSA). Incubation of every sample was repeated three times and the results were presented in averages of three independent experiments.
2.3. Free Lysine Measurements
The determination of free amino groups of all HSA samples were carried out using 2,4,6-trinitrobenzene sulfonic acid (TNBSA; 0.01% (W/V)) as a sensitive reagent for quantification of primary free amino groups in available lysine residues [26]. Therefore, protein samples to be assayed were directly dissolved in buffer (0.1 M sodium bicarbonate, pH 8.5) at a concentration of 0.2 mg/mL. Then, 0.25 mL of the 0.01% (w/v) solution of TNBSA was added to 0.5 mL of each sample solution, mixed well, and incubated at 37 °C for 2 h. Following incubation, 0.25 mL of 10% SDS and 0.125 mL of 1 N HCl were added to each sample. The absorbance (335 nm) of each solution was then read against a blank prepared as the sample without albumin. The results were reported as the degree of glycation (τ). τ = [(ODcontrol − ODmodified) × 58]/ODcontrol [27].
2.4. Thiol Group Measurements
The determination of free thiol levels (sulfhydryl groups) in all HSA samples was carried out by Ellman’s assay using 5,5′-dithiobis, 2-nitrobenzoic acid (DTNB) [28]. Briefly, 100 μL of diluted protein samples in buffer (0.2 M phosphate buffer, pH 7.4) was mixed well with 50 μL of freshly prepared DTNB (3 mM) in 0.2 M phosphate, pH 7.4 and incubated for 15 min at 37 °C. The content of thiol groups for each sample was determined by reading the absorbance at 412 nm and using the standard curve, which was prepared using various concentrations of L-cysteine (Sigma). Results are expressed as the number of free –SH groups per mol of HSA.
2.5. Amadori Product Measurements
The Amadori products of all HSA samples were determined using a colorimetric fructosamine assay based on the nitro-blue tetrazolium (NBT) reaction with ketoamines [29]. Briefly, 100 μL of each HSA sample (0.2 mg/mL) was mixed with 100 μL of NBT reagent (250 μM in 0.1 M carbonate, pH 10.35) and incubated at 37 °C for 2 h. The absorbance was read at 525 nm against a blank using BioTek Power Wave XS2 plate reader (USA).
2.6. Uv–vis Spectrophotometry
Uv–vis spectra were recorded using a Rayleigh spectrophotometer (UV-2100) with a quartz cuvette of 10 mm path length and a slit of 1 mm width. Protein concentration was 0.5 mg/mL in sodium phosphate buffer (50 mM, pH 7.4). The absorbance of samples was scanned over a wavelength range of 200–600 nm.
2.7. FTIR Spectrophotometry
The FTIR measurements of control and modified HSA were carried out on Bruker FTIR spectrophotometer (Tensor 27, Germany) in the spectral range of 400–4000 cm−1. The samples to be analyzed on the FT-IR spectrophotometer were first lyophilized and prepared as KBr pellets.
2.8. Secondary Structure Measurements
The secondary structure measurements were obtained using a J-810 CD spectropolarimeter with 1 mm path length at 25 °C. The concentration of all samples was 0.5 mg/mL in 50 mM sodium phosphate, pH 7.4. All CD spectra were converted to [θ]λ, the mean residue ellipticity (degcm2mol−1) at wavelength λ (nm) was determined using Eq. (1):
| (1) |
where θλ is ellipticity (in millidegrees) at λ, M0 is the mean residue weight, c is protein concentration (in mg/mL), and l is path length (in cm). The percentage of secondary structure was obtained using the CDNN CD Spectra Deconvolution Software (Version 2.1).
2.9. Trp-fluorescence Measurements
The Trp-fluorescence intensity of all HSA samples was measured using Cary eclipse fluorescence spectrophotometer. The protein concentration was 0.5 mg/mL in 50 mM sodium phosphate, pH 7.4. The excitation/emission of the protein samples were performed at 285/340 nm.
2.10. Statistical Analysis
All experiments were performed at least three times. Statistical analysis of the data was performed using Microsoft Excel 2010. The Excel data tools were used to determine the means and standard deviations of the data. The p value less than 0.05 were considered statistically significant.
3. Results
3.1. Free Lysine Measurements
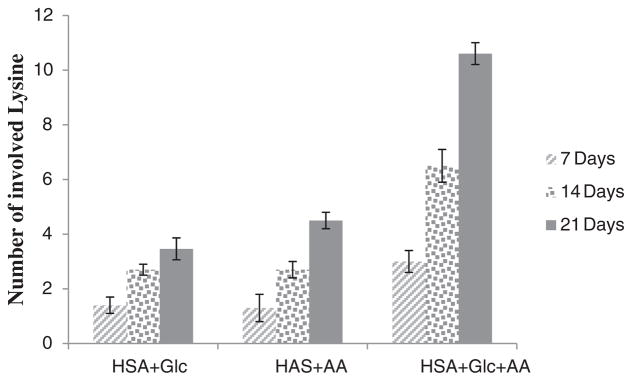
Fig. 1 shows the number of Lys residues involved in modified HSA (HSA + Glc, HSA + AA and HSA + AA + Glc) after 7, 14 and 21 days of incubation. All measurements were performed after the indicated times. All data were normalized using HSA-control (the 7, 14 and 21 days incubated HSA at 37 °C, pH 7.4 without any modifying agents). Fig. 1 shows that the numbers of involved lysine residues in HSA modified by AA + Glc were greater than the numbers of involved lysine residues in Glc and AA alone. The number of involved lysine residues in HSA + AA + Glc samples was almost three times of that of HSA + Glc samples.
Fig. 1.
Number of involved Lys residues in HSA + Glc, HSA + AA and HSA + AA + Glc after 7, 14 and 21 days of incubation at 37 °C in 50 mM phosphate buffer with pH 7.4. All data were normalized using its HSA-control.
3.2. Thiol Group Measurements
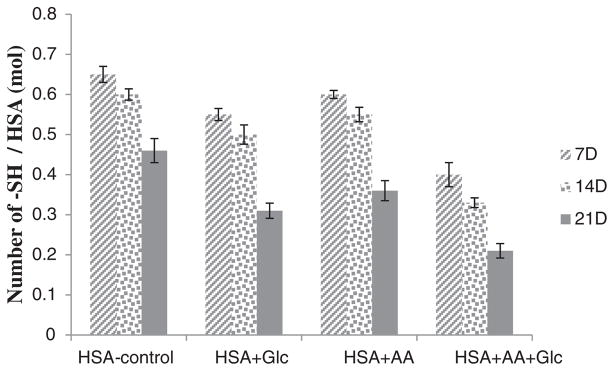
The determination of free thiol groups was performed according to Ellman’s assay and results are presented in Fig. 2. These results demonstrated a significant decrease in the number of free thiol groups in modified HSA. In comparison with HSA-control, this decrease was more prominent in HSA incubated with AA + Glc.
Fig. 2.
Thiol group contents of HSA-control, HSA + Glc, HSA + AA and HSA + AA + Glc after 7, 14 and 21 days of incubation at 37 °C in 50 mM phosphate buffer pH 7.4.
3.3. Amadori Product Measurements
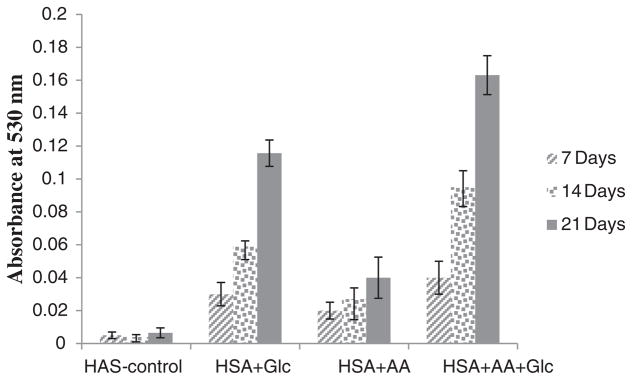
Amadori product formation was detected using the fructosamine assay. In this assay, Amadori products (ketoamines) can reduce NBT reagent and produce the colored formazan dye with an absorbance maximum at 530 nm. Fig. 3 shows the absorbance of HSA-control, HSA + Glc, HSA + AA and HSA + AA + Glc at 530 nm. These results indicated a significant increase in Amadori products of HSA modified during incubation time. In comparison with HSA-control, this increase was more dramatic for HSA modified with AA + Glc.
Fig. 3.
Amount of Amadori products of HSA-control, HSA + Glc, HSA + AA and HSA + AA + Glc after 7, 14 and 21 days of incubation at 37 °C in 50 mM phosphate buffer pH 7.4.
3.4. UV–visible Spectroscopy
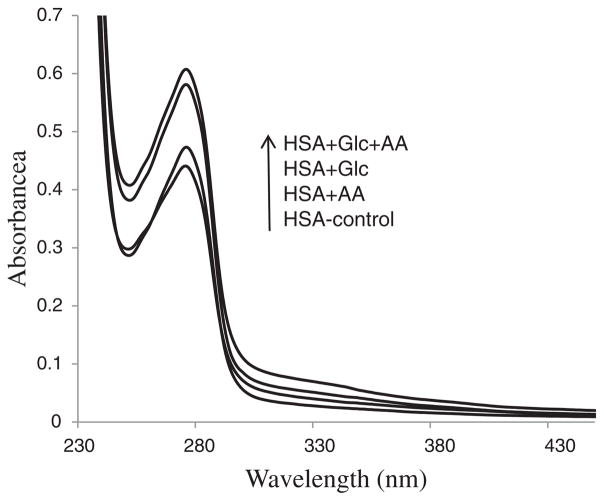
Fig. 4 shows absorption spectra of the HSA-control, HSA + Glc, HSA + AA and HSA + AA + Glc after 21 days of incubation. These results indicated that the absorption of the Trp increased with modified HSA. Moreover, the absorption of incubated HSA with AA + Glc showed the highest increase.
Fig. 4.
UV–visible spectra of HSA-control, HSA + Glc, HSA + AA and HSA + AA + Glc in 50 mM sodium phosphate buffer (pH 7.4), 1 mM EDTA and 0.1 mM sodium azide, incubated at 37 °C for 21 days. The arrow shows the order of absorbance increment.
3.5. FTIR Spectroscopy
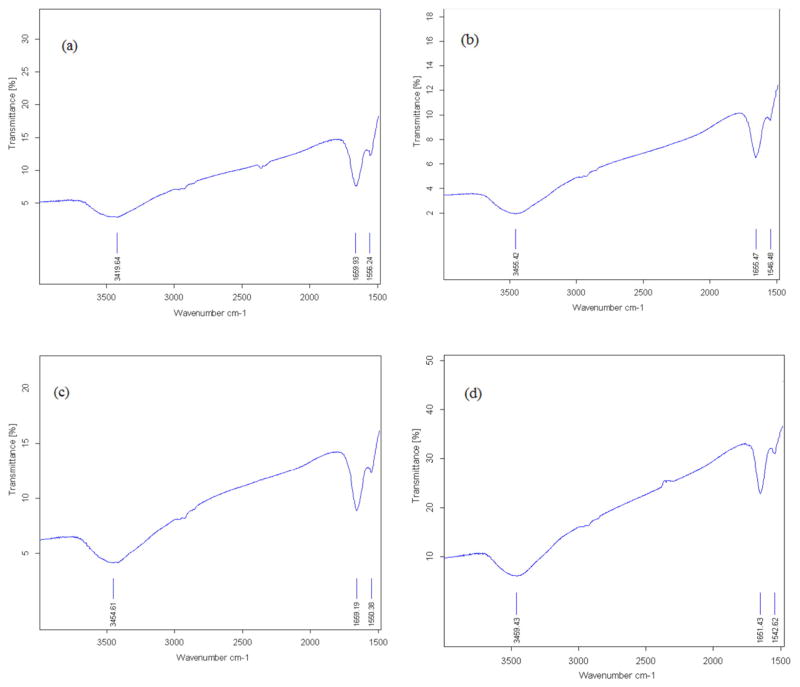
The FTIR spectra for HSA-control, HSA + Glc, HSA + AA and HSA + AA + Glc are shown in Fig. 5a–d, respectively, after 21 days. These spectra analyzed on the basis of frequency of the amide I and II bands. Amide I band in HSA-control, HSA + Glc, HSA + AA and HSA + AA + Glc showed a peak at 1659.9, 1655.5, 1659.2 and 1651.4 cm−1, respectively. The amide II band in HSA-control, HSA + Glc, HSA + AA and HSA + AA + Glc showed a peak at 1556.2, 1546.5, 1550.4 and 1542.6 cm−1, respectively.
Fig. 5.
FT-IR spectra of HSA-control (a), HSA + Glc (b), HSA + AA (c) and HSA + AA + Glc (d) in 50 mM sodium phosphate buffer (pH 7.4), 1 mM EDTA and 0.1 mM sodium azide, incubated at 37 °C for 21 days.
3.6. Secondary Structure Measurements
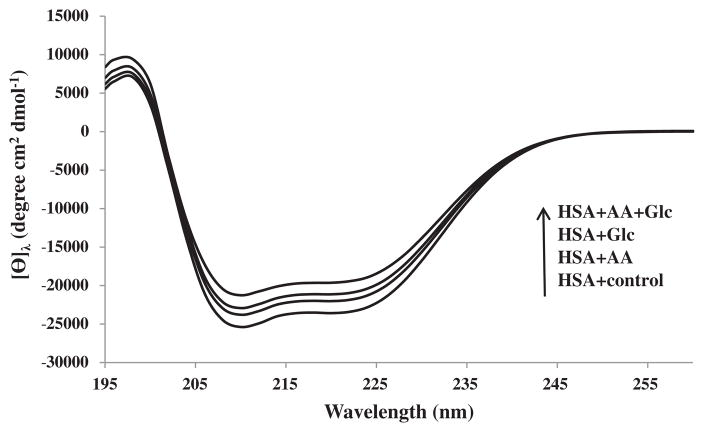
The secondary structure of all protein samples at pH 7.4 and 25 °C were determined using far UV circular dichroism (CD) spectroscopy (Fig. 6). The spectra analyzed for the content of secondary structure using the provided software by the manufacturer (Table 1). The HSA-control had the following secondary structure contents: 64.1% ± 0.5 α-helix, 2.8% ± 0.2 antiparallel β-sheet, 3.6% ± 0.3 parallel β-sheet, 12.5% ± 0.2 β-turn and 17.0% ± 0.8 unordered structure, whereas the modified HSA + Glc and the modified HSA + AA had an α-helix content of 60.1% ± 0.4 and 62.5% ± 0.3, respectively, being less than that of HSA-control. Interestingly, the α-helix content of HSA + AA + Glc was the lowest among all samples (57.2% ± 0.7). Thus, the presence of AA had some contributory role to increased effects of Glc on HSA secondary structure.
Fig. 6.
The CD spectra of HSA-control, HSA + Glc, HAS + AA and HSA + AA + Glc in 50 mM sodium phosphate buffer (pH 7.4), 1 mM EDTA and 0.1 mM sodium azide, incubated at 37 °C for 21 days. The arrow shows an increase in the order of mean residue ellipticity (deg cm2 mol−1).
Table 1.
The percentage secondary structure of HSA-control, HSA + Glc, HSA + AA and HSA + AA + Glc in 50 mM sodium phosphate buffer (pH 7.4), 1 mM EDTA and 0.1 mM sodium azide, incubated at 37 °C for 21 days.
| Sample | α – Helix | Antiparallel | Parallel | β – Turn | Random-coil |
|---|---|---|---|---|---|
| HSA-control | 64.1% ± 0.5 | 2.8% ± 0.2 | 3.6% ± 0.3 | 12.5% ± 0.2 | 17.0% ± 0.8 |
| HSA + Glc | 60.1% ± 0.4 | 3.6% ± 0.5 | 4.2% ± 0.2 | 13.3% ± 0.5 | 18.8% ± 0.4 |
| HSA + AA | 62.5% ± 0.3 | 3.1% ± 0.5 | 3.8% ± 0.4 | 12.8% ± 0.3 | 17.8% ± 0.5 |
| HSA + AA + Glc | 57.2% ± 0.7 | 3.9% ± 0.1 | 4.9% ± 0.1 | 14.0% ± 0.2 | 20.0% ± 0.6 |
3.7. Trp-fluorescence Measurements
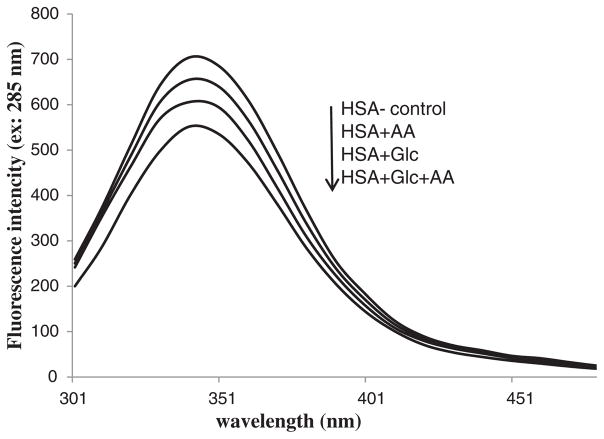
Trp fluorescence intensity of the HSA-control, HSA + Glc, HSA + AA and HSA + AA + Glc at the excitation/emission wavelength of 285/340 nm are shown in Figs. 7 and 8. The emission intensity of HSA + AA + Glc showed a significant decrease compared with the HSA + Glc and HSA + AA, which had an emission intensity lower than HSA-control.
Fig. 7.
Intrinsic fluorescence emission spectra of HSA-control, HSA + Glc, HSA + AA and HSA + AA + Glc in 50 mM sodium phosphate buffer (pH 7.4), 1 mM EDTA and 0.1 mM sodium azide, incubated at 37 °C for 21 days. The arrow shows a decrease in the order intrinsic fluorescence intensity.
Fig. 8.
Intrinsic fluorescence intensity of HSA-control, HSA + Glc, HSA + AA and HSA + AA + Glc at the excitation/emission wavelength of 285/340 nm in 50 mM sodium phosphate buffer (pH 7.4), 1 mM EDTA and 0.1 mM sodium azide, incubated at 37 °C for 7, 14 and 21 days incubation.
4. Discussion
Production of Amadori products is initiated by formation of a covalent bond between free amino group of proteins and carbonyl group of sugars [4]. This binding causes extensive protein structural changes [7]. The results of free lysine content assay (TNBSA test) showed that the amount of modified lysine residues in HSA incubated with AA + Glc was significantly greater than that of HSA incubated with Glc and AA alone (Fig. 1) Therefore, the number of covalent bond formation was increased in the presence of AA.
The thiol group of a cysteine residue is another nucleophilic group in HSA that can covalently bind to carbonyl group of sugars [30]. The results of free thiol group determinations (Ellman’s assay) indicated that the number of modified cysteine residues in HSA incubated with AA + Glc was greater than that of HSA incubated with Glc and AA alone (Fig. 2). Interestingly, free thiol groups of HSA incubated with AA + Glc showed a significant decrease compared with HSA incubated with Glc alone, AA alone, and HSA-control (Fig. 2). Thus, AA caused enhanced modification of HSA thiol groups with carbonyl groups. These results are consistent with the results of the free lysine content assays (Fig. 1) indicating enhanced covalent bond formation in the presence of AA.
The Amadori product is formed through covalent bond formation between a part of protein (a nucleophilic group) and reduced sugar’s carbonyl group [4], which after rearrangements produces a Schiff base [4]. The increased covalent bond in HSA incubated with AA + Glc may lead to enhanced formation of Amadori products. The NBT assay results indicated that the level of Amadori products in HSA incubated with AA + Glc was significantly greater than HSA incubated with Glc and AA alone (Fig. 3). These results are in agreement with free lysine content assays and the results of free thiol group test.
According to UV–vis results, the absorption of HSA incubated with AA + Glc was increased compared to HSA incubated with Glc and AA alone (Fig. 4). Based on previous studies, the modifications of lysine residues by Glc induce structural change [31]. Thus, AA increased the structural changes of HSA by covalent bond formation.
According to FTIR results, the amide I band (arising from C=O stretching) in HSA-control showed a pick at 1659.9 cm−1, which was consistent with the absorption peak of α-helix (Fig. 5a–d). This band at 1659 cm−1 shifted to 1660, 1655 and 1653 cm−1 in HSA + Glc, HSA + AA and HSA + AA + Glc, respectively. The amide II band (originating from N—H bending vibrations of peptide groups) showed a peak at 1556.2 cm−1 in HSA-control shifted to 1546.5, 1550.4 and 1542.6 cm−1 in HSA + Glc, HSA + AA and HSA + AA + Glc, respectively (Fig. 5a–d). Moreover, the band at 3419.6 cm−1 in HSA-control shifted to 3456.4, 3454.6 and 3459.4 cm−1 in HSA + Glc, HSA + AA and HSA + AA + Glc, respectively (Fig. 5a–d). According to previous studies the shifting of amide I and II bands indicate structural changes due to glycation [31]. Therefore, AA increased the structural changes of HSA by covalent bond formation.
As previously demonstrated the modification of nucleophilic group of amino acid residues (glycation) can change protein’s secondary structure [32]. Since covalent bond formation, which is the result of nucleophilic attack, was increased in the presence of AA the alterations in secondary structure of modified HSA was studied. The CD results of HSA incubated with Glc indicated a decrease in α-helix content, and an increase in β-sheet structure, turns, and unordered elements (Fig. 6 and Table 1). These results are in agreement with previous studies [33].
The CD result showed that the alteration in secondary structure of HSA incubated with AA + Glc was increased compared with HSA incubated with Glc and AA alone (Fig. 6 and Table 1). The binding of Glc to HSA (glycation) can cause a decrease in α-helix content of HSA [34, 35] and BSA [36]. Based on CD results, the presence of AA resulted in increased alterations of the HSA secondary structure. Thus, the decrease in α-helix content of HSA was attributed to its covalent binding to AA.
According to the Trp-fluorescence intensity results, intrinsic fluorescence intensity of HSA incubated with AA + Glc was decreased compared with HSA incubated with Glc and AA alone (Figs. 7 and 8). The alterations of intrinsic florescence intensity of a protein are an indicator of tertiary structural changes [37]. The modification of lysine residues by Glc causes a decrease in the intrinsic (tryptophan) fluorescence intensity of a protein, including HSA [34] and BSA [36]. Thus, the presence of AA resulted in increased changes in the tertiary structure of HSA through formation of covalent bonds.
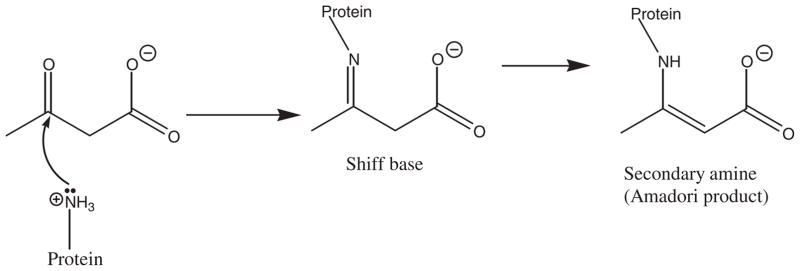
In summary, our results indicated that the presence of AA increased Amadori product formation and structural changes of HSA incubated with glucose. This was mainly attributed to the formation of covalent bonds between the carbonyl group of AA and the nucleophilic groups of HSA. The proposed mechanism for this reaction is depicted in Fig. 9. Fig. 9 shows that the amino group of Lys, as a nucleophilic group, reacts with the carbonyl group of AA to form a Schiff base. This Schiff base is then rearranged to form a secondary amine. Thus, the results presented in this study reveal that AA enhances the formation of Amadori products through its covalent bond formation with HSA.
Fig. 9.
Mechanism of reaction between acetoacetate and amino group of HSA lysine residue.
5. Conclusions
The AA is a ketone body that is increased during ketosis in diabetic patients. Our results indicate that AA can covalently bind to lysine residues of HSA, and increase the formation of Amadori products. The mechanism of Amadori product enhancement was attributed to the formation of covalent bonds between the AA and HSA nucleophilic groups. Enhanced Amadori product formation is associated with microvascular complications, in early and advanced stages of diabetic nephropathy and retinopathy. The increase in Amadori products, as intermediates in glycation, can lead to enhanced AGEs formation. The formations of AGEs contribute to the pathogenesis of many diseases including Alzheimer’s, Parkinson, and diabetes. Thus, control of AA concentration in the body may have an important beneficial role in human health and its improvement.
Acknowledgments
This work was supported by UNESCO Chair in Biophysics of Diabetes at University of Tehran, Iran. The work in NS laboratory is supported in part by a non-restricted fund from Research to Prevent Blindness Foundation to the Department of Ophthalmology, Retina Research Foundation, EY016665, EY022883, and EPA 83573701.
Abbreviations
- AA
Acetoacetate
- AGEs
Advanced glycation end products
- HSA
Human Serum Albumin
- GHSA
glycated human serum albumin
- 3BHB
3-β-hydroxybutyrate
- CD
Circular Dichroism
References
- 1.Voziyan PA, Khalifah RG, Thibaudeau C, Yildiz A, Jacob J, Serianni AS, Hudson BG. Modification of proteins in vitro by physiological levels of glucose: pyridoxamine inhibits conversion of Amadori intermediate to advanced glycation end-products through binding of redox metal ions. J Biol Chem. 2003;278:46616–46624. doi: 10.1074/jbc.M307155200. [DOI] [PubMed] [Google Scholar]
- 2.Basta G, Schmidt AM, De Caterina R. Advanced glycation end products and vascular inflammation: implications for accelerated atherosclerosis in diabetes. Cardiovasc Res. 2004;63:582–592. doi: 10.1016/j.cardiores.2004.05.001. [DOI] [PubMed] [Google Scholar]
- 3.Lapolla A, Traldib P, Fedelea D. Importance of measuring products of non-enzymatic glycation of proteins. Clin Biochem. 2005;38:103–115. doi: 10.1016/j.clinbiochem.2004.09.007. [DOI] [PubMed] [Google Scholar]
- 4.Brownlee M, Vlassara H, Cerami A. Nonenzymatic glycation and the pathogenesis of diabetic complications. Ann Intern Med. 1984;101:527–537. doi: 10.7326/0003-4819-101-4-527. [DOI] [PubMed] [Google Scholar]
- 5.Friedlander MA, Witko-Sarsat V, Nguyen AT, Wu YC, Labrunte M, Verger C, Jungers P, Descamps-Latscha B. The advanced glycation endproduct pentosidine and monocyte activation in uremia. Clin Nephrol. 1996;45:379–382. [PubMed] [Google Scholar]
- 6.Ahmed N. Advanced glycation endproducts—role in pathology of diabetic complications. Diabetes Res Clin Pract. 2005;67:3–21. doi: 10.1016/j.diabres.2004.09.004. [DOI] [PubMed] [Google Scholar]
- 7.Bohlooli M, Moosavi-Movahedi AA, Taghavi F, Saboury AA, Maghami P, Seyedarabi A, Moosavi-Movahedi F, Ahmad F, Shockravi A, Habibi-Rezaei M. Inhibition of fluorescent advanced glycation end products (AGEs) of human serum albumin upon incubation with 3-β-hydroxybutyrate. Mol Biol Rep. 2014;41:3705–3713. doi: 10.1007/s11033-014-3235-1. [DOI] [PubMed] [Google Scholar]
- 8.Philis-Tsimikas A, Parthasarathy S, Picard S, Palinski W, Witztum JL. Aminoguanidine has both pro-oxidant and antioxidant activity toward LDL. Arterioscler Thromb Vasc Biol. 1995;15:367–376. doi: 10.1161/01.atv.15.3.367. [DOI] [PubMed] [Google Scholar]
- 9.Jakus V, Rietbrock N. Advanced glycation end-products and the progress of diabetic vascular complications. Physiol Res. 2004;53:131–142. [PubMed] [Google Scholar]
- 10.Ansari AN, Dash D. Amadori glycated proteins: role in production of autoantibodies in diabetes mellitus and effect of inhibitors on non-enzymatic glycation. Aging Dis. 2013;4:50–56. [PMC free article] [PubMed] [Google Scholar]
- 11.Chen S, Cohen MP, Ziyadeh FN. Amadori-glycated albumin in diabetic nephropathy: pathophysiologic connections. Kidney Int Suppl. 2000;77:S40–S44. doi: 10.1046/j.1523-1755.2000.07707.x. [DOI] [PubMed] [Google Scholar]
- 12.Schalkwijk CG, Ligtvoet N, Twaafhoven H, Jager A, Blaauwgeers HG, Schlingemann RO, Tarnow L, Parving HH, Stehouwer CD, van Hinsbergh VW. Amadori albumin in type 1 diabetic patients: correlation with markers of endothelial function, association with diabetic nephropathy and localization in retinal capillaries. Diabetes. 1999;48:2446–2453. doi: 10.2337/diabetes.48.12.2446. [DOI] [PubMed] [Google Scholar]
- 13.Sakai H, Jinde K, Suzuki D, Yagame M, Nomoto Y. Localization of glycated proteins in the glomeruli of patients with diabetic nephropathy. Nephrol Dial Transplant. 1996;11:66–71. doi: 10.1093/ndt/11.supp5.66. [DOI] [PubMed] [Google Scholar]
- 14.Schalkwijk CG, Chaturvedi N, Twaafhoven H, Van Hinsbergh VW, Stehouwer CD. Amadori albumin correlates with microvascular complications and precedes nephropathy in type 1 diabetes. Eur J Clin Investig. 2002;32:500–556. doi: 10.1046/j.1365-2362.2002.01011.x. [DOI] [PubMed] [Google Scholar]
- 15.Clements RS, Jr, Robison WG, Jr, Cohen MP. Anti-glycated albumin therapy ameliorates early retinal microvascular pathology in db/db mice. J Diabetes Complicat. 1998;12:28–33. doi: 10.1016/s1056-8727(97)00051-2. [DOI] [PubMed] [Google Scholar]
- 16.Guthrie JP, Jordan F. Amine catalyzed decarboxylation of acetoacetic acid: the rate constant for decarboxylation of a β-imino acid. J Am Chem Soc. 1972;94:9136–9141. [Google Scholar]
- 17.Laffel L. Ketone bodies: a review of physiology, pathophysiology and application of monitoring to diabetes. Diabetes Metab Res Rev. 1999;15:412–426. doi: 10.1002/(sici)1520-7560(199911/12)15:6<412::aid-dmrr72>3.0.co;2-8. [DOI] [PubMed] [Google Scholar]
- 18.Lewis GD, Laufman AK, McAnalley BH, Garriott JC. Metabolism of acetone to isopropyl alcohol in rats and humans. J Forensic Sci. 1984;29:541–549. [PubMed] [Google Scholar]
- 19.Aguilar-Hernández M, Méndez JD. In vitro glycation of brain aminophospholipids by acetoacetate and its inhibition by urea. Biomed Pharmacother. 2007;61:693–697. doi: 10.1016/j.biopha.2007.06.004. [DOI] [PubMed] [Google Scholar]
- 20.Dockal M, Carter DC, Ruker F. Conformational transitions of the three recombinant domains of human serum albumin depending on pH. J Biol Chem. 2000;275:3042–3050. doi: 10.1074/jbc.275.5.3042. [DOI] [PubMed] [Google Scholar]
- 21.Dugiaczyk A, Law SW, Dennison OE. Nucleotide sequence and the encoded amino acids of human serum albumin mRNA. Proc Natl Acad Sci U S A. 1982;79:71–75. doi: 10.1073/pnas.79.1.71. [DOI] [PMC free article] [PubMed] [Google Scholar]
- 22.Iberg N, Fliick R. Nonenzymatic glycosylation of albumin in vivo. Identification of multiple glycosylated sites. J Biol Chem. 1986;261:13542–13545. [PubMed] [Google Scholar]
- 23.Fery F, Balasse EO. Ketone body production and disposal in diabetic ketosis. A comparison with fasting ketosis. Diabetes. 1985;34:326–332. doi: 10.2337/diab.34.4.326. [DOI] [PubMed] [Google Scholar]
- 24.Widenhoff KE. A micro-method for the enzymatic determination of acetoacetate and 3-hydroxybutyrate in blood and urine. Scand J Clin Lab Invest. 1970;25:171–179. doi: 10.3109/00365517009049200. [DOI] [PubMed] [Google Scholar]
- 25.Sattarahmady N, Moosavi-Movahedi AA, Ahmad F, Hakimelahi GH, Habibi-Rezaei M, Saboury AA, Sheibani N. Formation of the molten globule-like state during prolonged glycation of human serum albumin. Biochim Biophys Acta. 2007;1770:933–942. doi: 10.1016/j.bbagen.2007.02.001. [DOI] [PubMed] [Google Scholar]
- 26.Kakade ML, Irvin Liener E. Determination of available lysine in proteins. Anal Biochem. 1962;27:273–280. doi: 10.1016/0003-2697(69)90032-3. [DOI] [PubMed] [Google Scholar]
- 27.Cayot P, Tainturier G. The quantification of protein amino groups by the trinitrobenzenesulfonic acid: a reexamination. Anal Biochem. 1997;249:184–200. doi: 10.1006/abio.1997.2161. [DOI] [PubMed] [Google Scholar]
- 28.Ellman GL. Tissue sulfhydryl groups. Arch Biochem Biophys. 1959;82:70–77. doi: 10.1016/0003-9861(59)90090-6. [DOI] [PubMed] [Google Scholar]
- 29.Schmitt A, Schmitt J, Münch G, Gasic-Milencovic J. Characterization of advanced glycation end products for biochemical studies: side chain modifications and fluorescence characteristics. Anal Biochem. 2005;338:201–215. doi: 10.1016/j.ab.2004.12.003. [DOI] [PubMed] [Google Scholar]
- 30.Bohlooli M, Moosavi-Movahedi AA, Taghavi F, Shockravi A, Moosavi-Movahedi Z, Farhadi M, Saboury AA, Khajeh M, Poursasan N, Goodarzi M, Farivar F, Valipour M, Amanlou M, Sheibani N, Habibi-Rezaei M. Thermal reversibility and disaggregation of human serum albumin upon incubation with 3-β hydroxybutyrate: a proposed mechanism for thiol reaction. J Therm Anal Calorim. 2015;120:403–409. [Google Scholar]
- 31.Arif B, Ashraf JM, Moinuddin, Ahmad J, Arif Z, Alam K. Structural and immunological characterization of Amadori-rich human serum albumin: role in diabetes mellitus. Arch Biochem Biophys. 2012;522:17–25. doi: 10.1016/j.abb.2012.04.005. [DOI] [PubMed] [Google Scholar]
- 32.Bouma B, Kroon-Batenburg LM, Wu YP, Brünjes B, Posthuma G, Kranenburg O, de Groot PG, Voest EE, Gebbink MF. Glycation induces formation of amyloid cross-structure in albumin. J Biol Chem. 2003;278:41810–41819. doi: 10.1074/jbc.M303925200. [DOI] [PubMed] [Google Scholar]
- 33.Bohlooli M, Moosavi-Movahedi AA, Ghaffari-Moghaddam M, Saboury AA, Khajeh M, Najafi S, Poormolaie N, Taghavi F, Poursasan N, Sancholi M, Esmaeilzadeh S, Naderi M, Shahraki S. Comparative study of thermal domains analyzing of glycated and non-glycated human serum albumin. Thermochim Acta. 2014;594:24–30. [Google Scholar]
- 34.Singh R, Barden A, Mori T, Beilin L. Advanced glycation end-products: a review. Diabetologia. 2001;44:129–146. doi: 10.1007/s001250051591. [DOI] [PubMed] [Google Scholar]
- 35.Bohlooli M, Moosavi-Movahedi AA, Taghavi F, Maghami P, Saboury AA, Moosavi-Movahedi Z, Farhadi M, Hong J, Sheibani N, Habibi-Rezaei M. Investigation of thermal reversibility and stability of glycated human serum albumin. Int J Biol Macromol. 2013;62:358–364. doi: 10.1016/j.ijbiomac.2013.09.015. [DOI] [PubMed] [Google Scholar]
- 36.Takeda K, Wada A, Yamamoto K, Moriyama Y, Aoki K. Conformational change of bovine serum albumin by heat treatment. J Protein Chem. 1989;8:653–659. doi: 10.1007/BF01025605. [DOI] [PubMed] [Google Scholar]
- 37.Bohlooli M, Moosavi-Movahedi AA, Taghavi F, Habibi-Rezaei M, Seyedarabi A, Saboury AA, Ahmad F. Thermodynamics of a molten globule state of human serum albumin by 3-β-hydroxybutyrate as a ketone body. Int J Biol Macromol. 2013;54:258–263. doi: 10.1016/j.ijbiomac.2012.12.018. [DOI] [PubMed] [Google Scholar]


