Abstract
The oncogene MDMX is overexpressed in many cancers leading to suppression of the tumor suppressor p53. MDMX inhibitors therefore might help reactivate p53 and enhance the efficacy of DNA damaging drugs. However, we currently lack a quantitative understanding of how MDMX inhibition affects the p53 signaling pathway and the sensitivity to DNA damage. Live cell imaging showed that MDMX depletion triggered two distinct phases of p53 accumulation in single cells: an initial post-mitotic pulse followed by low-amplitude oscillations. The response to DNA damage was sharply different in these two phases; in the first phase, MDMX depletion was synergistic with DNA damage in causing cell death, whereas in the second phase depletion of MDMX inhibited cell death. Thus a quantitative understanding of signal dynamics and cellular state is important for designing an optimal schedule of dual-drug administration.
Efficient killing of cancer cells often requires combinations of drugs. A major rationale underlying such approaches is that administration of two drugs that work through different mechanisms should reduce overall drug resistance and increase tumor eradication. A related combinatorial therapy approach is to apply anticancer drugs sequentially (1, 2). In this case, treatment with the first drug may modify ("rewire") the behavior of specific signaling pathways, resulting in a population of cancer cells that is more sensitive to the second treatment (1). Improving the efficacy of time-staggered combinatorial treatments and designing optimal schedules require a detailed quantitative understanding of how each treatment dynamically alters cellular states in individual cells.
We investigated how weakening the effects of the oncogene product MDMX (also known as MDM4 and HDMX) alters the state of individual cancer cells and how these changes affect their sensitivity to DNA damage over time. MDMX is amplified in many tumors, including melanoma, osteosarcoma, breast and colorectal cancers. Overexpression of MDMX inhibits the tumor suppressive effects of the protein p53 and leads to resistance to anti-cancer drugs (3, 4). Antagonization of MDMX may therefore enhance the efficacy of DNA-damaging drugs (3, 5). Effects of MDMX on abundance of p53 has been measured at one or a few time points in populations of cells (6–8). However, it remains unclear how MDMX regulates the dynamics of p53, which is important in determining a cell’s response to DNA damage (9). We examined the effects of MDMX inhibition on p53 dynamics and the susceptibility to DNA damage in individual cells.
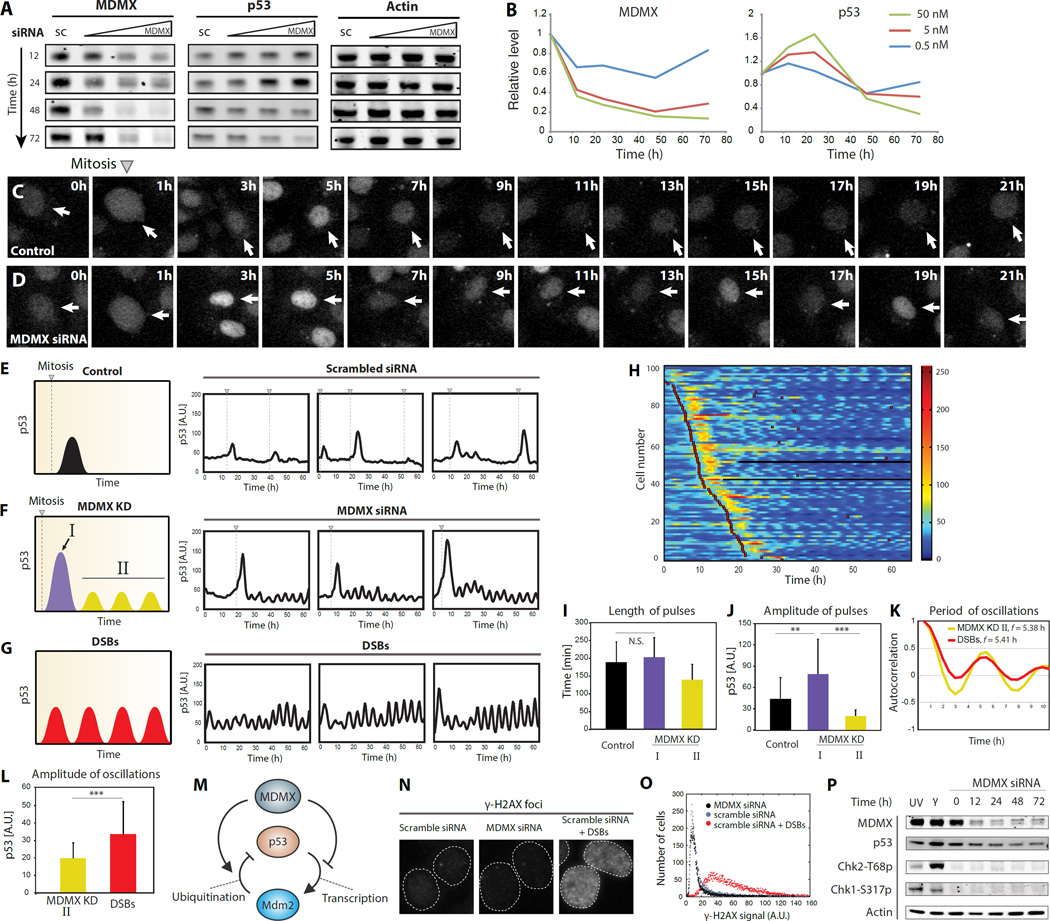
Multiple MDMX inhibitors are under development (10, 11) but the specificity and efficacy of candidate inhibitors are still under study. We therefore used siRNA to inhibit MDMX. Immunoblots showed that amounts of MDMX were effectively reduced in cells treated with siRNA (Fig. 1, A and B), leading to a transient increase in the amount of p53 followed by a decrease below its initial basal levels (Fig. 1, A and B). Population averages were previously shown to mask p53 dynamics in single cells (12, 13). We therefore quantified p53 dynamics in individual cells after MDMX depletion in a p53 reporter cell line (Fig. 1 C and D, and experimental procedures). Cells transfected with scrambled siRNA showed a pulse of p53 accumulation after mitosis, as previously reported for actively dividing cells (Fig. 1E and (13). Cells transfected with MDMX siRNA also showed this post-mitotic pulse (Fig. 1F) with a similar length but larger amplitude (Fig. 1, I and J). Note that most cells show the p53 post-mitotic pulse within the first 25 hours, which is consistent with their cell cycle length (fig. S1A). In our experimental conditions division time is not synchronized between individual cells (Fig. 1H), therefore each cell shows the post-mitotic pulse at a different time, giving the appearance of a prolonged increase in p53 immunoblots representing the population average (Fig. 1B). Following the initial post-mitotic p53 pulses, cells depleted of MDMX showed oscillations in p53 abundance that persisted during the course of the experiment (60 hr; Fig. 1, F and H). The amplitude of these oscillations was lower than that of the spontaneous p53 pulses in dividing cells expressing MDMX (Fig. 1J), leading to lower overall amounts of p53 in the cell population (Fig. 1, A and B). The response to MDMX depletion therefore has two phases in individual cells: during the first phase cells show a high amplitude p53 pulse, and during the second phase cells experience low-amplitude p53 oscillations. Because these dynamics are triggered after division, each cell enters the first and second phase of the response at a different time (Fig. 1H). Similar biphasic p53 dynamics were also found in the non-cancerous primary line RPE1 (fig. S2), suggesting that these MDMX-mediated dynamics are not limited to cancer cells. The p53 post-mitotic pulse appears in RPE1 within 20 hours consistent with their shorter cell cycle length (fig. S1B).
Figure 1. Single cells show two phases of p53 dynamics after MDMX depletion.
(A) Abundance of MDMX, p53 and actin in western blots of extracts from MCF7 cells were transfected with either scrambled siRNA (sc, 5nM) or siRNA targeting MDMX’s mRNA (0.5, 5, 50 nM) for the indicated times, and analyzed by western blots.
(B) Quantification of MDMX and p53 abundance from (A). Amount of siRNA used is shown in upper right corner.
(C and D) Time-lapse microscopy images of cells expressing p53-mCerulean after transfection with scrambled (C) or MDMX (D) siRNAs.
(E, F and G) Abundance of p53 in individual cells tracked as fluorescence p53-mCerulean. Triangles with dashed lines indicate cell division. p53-mCerulean dynamics in MDMX knockdown cells are classified into phase I (first post-mitotic pulse) and phase II (low amplitude oscillations). Double strand breaks (DSBs) were introduced by NCS. Illustrations on the left summarize p53 dynamics.
(H) Heat map of p53-mCerulean abundance in cells treated with MDMX siRNA. p53 traces of individual cells are arranged top to bottom by the occurrence of first mitosis. Red squares indicate the time of cell division.
(I) The mean relative widths measured by full width at half maximum (n > 90; error bars indicate S.D.; the two p53 post-mitotic pulses are not statistically significantly different P = 0.14; P-values obtained by Student's two-sample unequal variance t-Test, with a two-tailed distribution).
(J) Amplitude of p53 pulses in control cells and MDMX KD cells (n > 90; error bars indicate S.D.; **P < 10−8, ***P < 10−19; P-values obtained by Student's two-sample unequal variance t-Test, with a two-tailed distribution).
(K) Periods of p53 oscillations in MDMX knockdown [II] and NCS-treated cells measured by autocorrelation.
(L) The mean relative amplitude of p53 oscillations in MDMX knockdown [II] and NCS-treated cells are shown (n > 90; error bars indicate S.D., ***P < 10−19; P-values obtained by Student's two-sample unequal variance t-Test, with a two-tailed distribution).
(M) A schematic diagram of MDMX regulating p53. p53 oscillations were previously shown to result from the p53-Mdm2 negative feedback loop. MDMX acts to inhibit p53-Mdm2 oscillator through two arms: one arm inhibits p53 transcriptional activity (right arm); a second arm degrades p53 through catalyzing Mdm2-mediated p53 ubiquitination (left arm).
(N and O) γ-H2AX signal is shown (N) and quantified (O) in MCF7 cells transfected with either scrambled or MDMX siRNAs, followed by NCS treatment.
(P) Abundance of indicated proteins in MCF7 cells either UV- or γ-irradiated or transfected with MDMX siRNA for the indicated times analyzed by western blot.
The p53 oscillations during the second phase of the response resemble the p53 oscillations that occur in response to DNA Double Strand Breaks (DSBs) (14). While the p53 oscillations resulting from MDMX depletion had lower amplitude than those induced by DSBs (MCF7: Fig. 1, G and L; RPE1: fig. S2, C and H), both shared a remarkable similar period (Fig. 1K and S2G). We therefore suggest that MDMX-mediated p53 oscillations result from the core negative feedback loop between p53 and Mdm2 as was previously suggested after DNA damage (Fig. 1M and (14). Mdm2 suppression led to a completely different non-oscillatory p53 dynamics (fig. S3), strengthening the model that Mdm2 is required for p53 oscillations after DNA damage and MDMX suppression. The similarity in oscillation period led us to ask whether the p53 oscillations post MDMX knockdown result from activation of the DNA damage signaling pathway. We measured the abundance of gamma-H2AX, an indicator of DSBs, in cells transfected with scrambled or MDMX siRNA and found that MDMX depletion did not increase the gamma-H2AX signal (Fig. 1, N and O). There was also no change in the phosphorylation states of the two major DNA damage effector kinases, Chk1 and Chk2, after MDMX knockdown (Fig. 1P), suggesting that p53 oscillations after MDMX depletion do not result from DNA damage signaling.
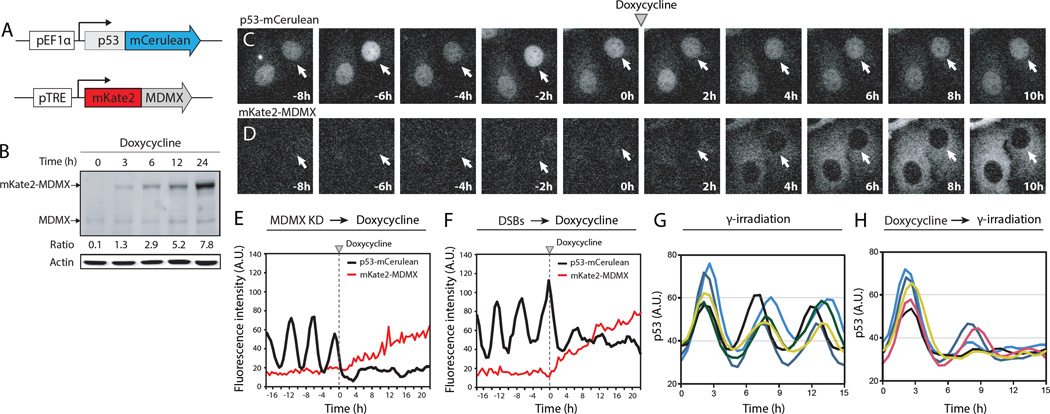
We used a cell line expressing a fluorescently tagged p53 and an inducible MDMX fused to mKate2 (a far-red fluorescent protein) to quantify p53 dynamics after re-introducing MDMX during the oscillatory phase (Fig. 2, A–D). Addition of doxycycline led to increased amounts of mKate2-MDMX (Fig. 2, B and D), which suppressed p53 oscillations (Fig. 2E), suggesting that MDMX prevents p53 oscillations in non-stressed conditions. Amounts of MDMX decrease in response to DSBs (fig. S4A and (15), raising the possibility that decreased abundance of MDMX is required for p53 oscillations. To examine the effect of MDMX on p53 oscillations that result from DSBs, we triggered DSBs with the radiomimetic drug Neocarzinostatin (NCS) and measured p53 dynamics before and after expression of mKate2-MDMX. NCS led to p53 oscillations (16), and accumulation of mKate2-MDMX again diminished p53 oscillations (Fig. 2F). Incubation of cells with doxycycline before treatment with NCS dampened the NCS-induced p53 oscillations (Fig. 2, G and H, and fig. S4B). Thus MDMX suppresses p53 oscillations both in basal conditions and in cells with DSBs. MDMX degradation after DSBs is required to allow p53 oscillations.
Figure 2. MDMX suppresses p53 oscillations in non-stressed conditions and after DNA damage.
(A) Schematic of the p53 and MDMX reporter constructs.
(B) Abundance of mKate2-MDMX in p53-MDMX reporter cells treated with doxycycline analyzed by western blot.
(C and D) Time-lapse microscopy images of p53-mCerulean (C) and mKate2-MDMX (D) after MDMX siRNAs (30hr), followed by doxycycline.
(E and F) Trajectories of p53-mCerulean and mKate2-MDMX levels are shown for cells with either MDMX knockdown (E) or NCS (F) treatment 30 hr prior to doxycycline addition.
(G and H) Trajectories of p53-mCerulean levels are shown for cells treated with NCS alone (G) or with prior treatment of doxycycline (H).
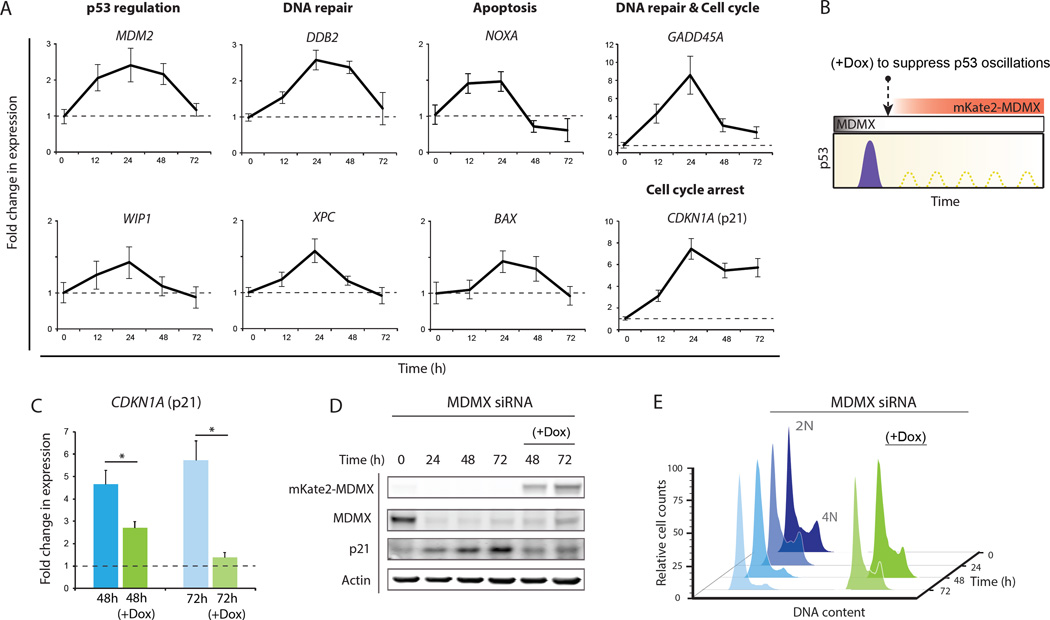
To determine the effects of the two-phase p53 response after MDMX depletion on the transcription of p53 target genes, we quantified amounts of transcripts of well-characterized p53 target genes in different cellular programs. Most p53 targets showed a mild transient increase in transcription after MDMX depletion in the first 24 to 48 hours, and returned to their basal levels by 72hr (Fig. 3A). These genes may be sensitive to the first-phase post-mitotic pulse of p53 after MDMX depletion, but less sensitive to the second oscillatory phase of p53. The behavior of CDKN1A, a gene encoding the cyclin dependent kinase inhibitor 1, p21, was distinct. Amounts of CDKN1A transcript showed an eight-fold increase at 24 hr after MDMX depletion and remained increased (> five fold) at 48 hr and 72 hr after depletion of MDMX (Fig. 3A, bottom-right panel). Amounts of p21 protein showed a continuous increase during the entire 72 hr period after MDMX depletion, which was p53 dependent (fig. S5). MDMX depletion also led to cell cycle arrest as indicated by the increase in the percentage of cells in G1 phase of the cell cycle and decrease in percentage of cells in S phase (Fig. 3E, left panel). Suppression of p53 low-amplitude oscillations by a delayed expression of mKate2-MDMX (Fig. 2E and 3B) lowered amounts of p21 mRNA and protein (Fig. 3, C and D) and rescued cells from arrest (Fig. 3E, right panel). This indicates that the p53 oscillations post MDMX knockdown are responsible for maintaining p21 and cell-cycle arrest.
Figure 3. p53 oscillations during phase II are required to maintain p21 accumulation and cell cycle arrest.
(A) Expression of p53 target genes measured by qPCR after MDMX knockdown. Genes are grouped according to their function (n = 3; error bars represent SD).
(B) Schematic of suppressing p53 oscillations by inducing mKate2-MDMX using doxycycline. Doxycycline was added 24 hr after MDMX siRNA transfection.
(C) Abundance of transcripts of CDKN1A (p21) two and three days after MDMX siRNA transfection alone or followed by doxycycline addition (n = 3; error bars indicate S.D., *P < 10−2; P-values obtained by Student's two-sample unequal variance t-Test, with a two-tailed distribution).
(D) Abundance of p21 protein in cells depleted of MDMX alone or with doxycycline addition.
(E) Cell cycle profile after MDMX depletion alone or with doxycycline addition.
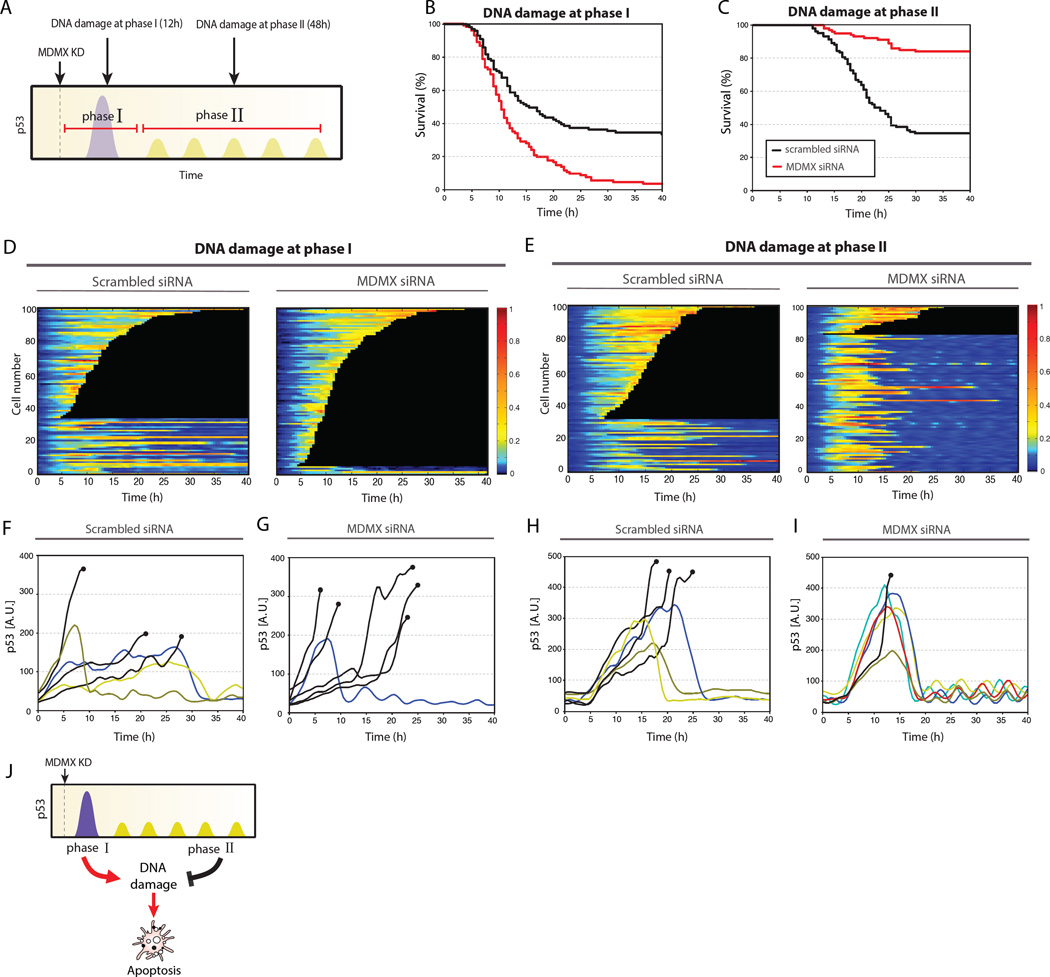
The complexity of the p53 response to MDMX depletion prompted us to investigate how cells respond to DNA damage at different times after depletion of MDMX. We applied DNA damage either during the first phase (post-mitotic pulse) or second phase (oscillations) of the p53 response and measured p53 dynamics and cell fate (Fig. 4A). When DNA damage was applied during the first phase (12 hr after transfection with MDMX siRNA), MDMX depletion sensitized cells to death, leading to 95% cell death compared with 66% resulting from DNA damage alone (Fig. 4B). This increase in cell death may result from increased accumulation of p53 (Fig. 4, D, F and G, and fig. S6A) and increased transcription of apoptotic genes (Fig. 3A) during this phase. In sharp contrast, when DNA damage was applied during the second, oscillatory phase of p53 dynamics (48 hr after MDMX was depleted) cell death was reduced (67% to 16%) (Fig. 4C). Similar schedule-dependent interactions were observed between MDMX suppression and four different chemotherapy agents (4NQO, Doxorubicin, Camptothecin and Actinomycin D) in MCF7 and the primary line RPE1 (fig. S7).
Figure 4. Synergistic or antagonistic effects of MDMX depletion on DNA damage depending on the time interval between treatments.
(A) Experimental design for applying DNA damage (UV radiation, 16 J/m2) during phase I and phase II of p53 dynamics post MDMX knockdown.
(B–C) Survival curve of cells with DNA damage applied during phase I (B) or phase II
(C) treatments compared with controls.
(D–I) Heat maps (D–E) or trajectories (F–I) of p53-mCerulean for cells in which damage was applied at phase I (D, F, G) or phase II (E, H, I) compared with controls. Black traces indicate cells that underwent apoptosis.
(J) Schematic of MDMX depletion leading to two phases in p53 dynamics. Phase I leads to synergy with DNA damage. Phase II antagonizes with DNA damage.
MDMX depleted cells showed a similar amplitude of p53 accumulation to that in mock-treated cells when DNA damage was applied during phase II (Fig. 4, E, H and I, and fig. S6B), indicating that the reduction in cell death is not caused by lower amounts of p53. Instead, we suggest that transcriptional regulation of genes by MDMX-induced p53 oscillations could make cells less susceptible to DNA damage. Indeed, p53 oscillations during the second phase after MDMX depletion induced accumulation of p21 and cell cycle arrest (Fig. 3, D and E), which provides protection from cell death (17). In addition, MDMX suppression led to a stronger activation of the pro-survival signal phospho-Akt after DNA damage and to a weaker accumulation of the pro-apoptotic protein PUMA compared with those in MDMX expressing cells (fig. S8). This suggests that, in addition to induction of p21 and cell cycle arrest by p53 oscillations, MDMX suppression shifts cells toward pro-survival cellular state (fig. S8), which may also contribute to antagonism with DNA damage.
The complexity of cellular signaling pathways makes it challenging to predict the response to a single perturbation, and even more challenging to predict responses to combined perturbations. In the context of combined therapeutic treatments, the schedule of administration can be crucial (Fig. 4J and (1, 18, 19). The results presented here unexpectedly show that the combination of DNA damage with MDMX inhibitors for cancer therapy has the potential either to improve cancer therapy, or to blunt its effects. Our results have implications for the design of MDMX-combination drug regimes, and perhaps for the design of combination therapies in general. Further consideration of treatment schemes in the context of other physiological rhythms, such as the cell cycle and circadian clock (20–22), can be critical for more precise and effective therapies. Such a detailed quantitative description of system behavior at the single cell level can reveal hidden regulatory principles and the nature of a cellular state changes in response to perturbations.
Supplementary Material
Acknowledgments
We thank AG Jochemsen, JC Marine, X Wang and J Chen for sharing their experience and thoughts on MDMX regulation; R Ward, S Gruver and members of the Lahav laboratory for comments and discussion, and the Nikon Imaging Center at Harvard Medical School for support with live-cell imaging. This research was supported by National Institute of Health grant GM083303 to G.L., F32GM105205 to S.C. and funding from the Novartis Institutes for Biomedical Research.
REFERENCES AND NOTES
- 1.Lee MJ, et al. Sequential application of anticancer drugs enhances cell death by rewiring apoptotic signaling networks. Cell. 2012;149:780–794. doi: 10.1016/j.cell.2012.03.031. [DOI] [PMC free article] [PubMed] [Google Scholar]
- 2.Morton SW, et al. A nanoparticle-based combination chemotherapy delivery system for enhanced tumor killing by dynamic rewiring of signaling pathways. Sci Signal. 2014;7:ra44. doi: 10.1126/scisignal.2005261. [DOI] [PMC free article] [PubMed] [Google Scholar]
- 3.Wade M, Li Y-C, Wahl GM. MDM2, MDMX and p53 in oncogenesis and cancer therapy. Nat. Rev. Cancer. 2013;13:83–96. doi: 10.1038/nrc3430. [DOI] [PMC free article] [PubMed] [Google Scholar]
- 4.Gembarska A, et al. MDM4 is a key therapeutic target in cutaneous melanoma. Nat Med. 2012;18:1239–1247. doi: 10.1038/nm.2863. [DOI] [PMC free article] [PubMed] [Google Scholar]
- 5.Brown CJ, Lain S, Verma CS, Fersht AR, Lane DP. Awakening guardian angels: drugging the p53 pathway. Nat. Rev. Cancer. 2009;9:862–873. doi: 10.1038/nrc2763. [DOI] [PubMed] [Google Scholar]
- 6.Barboza JA, Iwakuma T, Terzian T, El-Naggar AK, Lozano G. Mdm2 and Mdm4 loss regulates distinct p53 activities. Mol. Cancer Res. 2008;6:947–954. doi: 10.1158/1541-7786.MCR-07-2079. [DOI] [PMC free article] [PubMed] [Google Scholar]
- 7.Mancini F, et al. Puzzling over MDM4–p53 network. The International Journal of Biochemistry & Cell Biology. 2010;42:1080–1083. doi: 10.1016/j.biocel.2010.04.010. [DOI] [PubMed] [Google Scholar]
- 8.Wang X, Wang J, Jiang X. MdmX protein is essential for Mdm2 protein-mediated p53 polyubiquitination. J Biol. Chem. 2011;286:23725–23734. doi: 10.1074/jbc.M110.213868. [DOI] [PMC free article] [PubMed] [Google Scholar]
- 9.Purvis JE, et al. p53 dynamics control cell fate. Science. 2012;336:1440–1444. doi: 10.1126/science.1218351. [DOI] [PMC free article] [PubMed] [Google Scholar]
- 10.Graves B, et al. Activation of the p53 pathway by small-molecule-induced MDM2 and MDMX dimerization. Proc. Natl. Acad. Sci. U.S.A. 2012;109:11788–11793. doi: 10.1073/pnas.1203789109. [DOI] [PMC free article] [PubMed] [Google Scholar]
- 11.Reed D, et al. Identification and characterization of the first small molecule inhibitor of MDMX. J Biol. Chem. 2010;285:10786–10796. doi: 10.1074/jbc.M109.056747. [DOI] [PMC free article] [PubMed] [Google Scholar]
- 12.Lahav G, et al. Dynamics of the p53-Mdm2 feedback loop in individual cells. Nat. Genet. 2004;36:147–150. doi: 10.1038/ng1293. [DOI] [PubMed] [Google Scholar]
- 13.Loewer A, Batchelor E, Gaglia G, Lahav G. Basal dynamics of p53 reveal transcriptionally attenuated pulses in cycling cells. Cell. 2010;142:89–100. doi: 10.1016/j.cell.2010.05.031. [DOI] [PMC free article] [PubMed] [Google Scholar]
- 14.Batchelor E, Mock CS, Bhan I, Loewer A, Lahav G. Recurrent initiation: a mechanism for triggering p53 pulses in response to DNA damage. Mol. Cell. 2008;30:277–289. doi: 10.1016/j.molcel.2008.03.016. [DOI] [PMC free article] [PubMed] [Google Scholar]
- 15.Kawai H, et al. DNA damage-induced MDMX degradation is mediated by MDM2. J Biol. Chem. 2003;278:45946–45953. doi: 10.1074/jbc.M308295200. [DOI] [PubMed] [Google Scholar]
- 16.Lahav G. Oscillations by the p53-Mdm2 feedback loop. Adv. Exp. Med. Biol. 2008;641:28–38. doi: 10.1007/978-0-387-09794-7_2. [DOI] [PubMed] [Google Scholar]
- 17.Maddocks ODK, et al. Serine starvation induces stress and p53-dependent metabolic remodelling in cancer cells. Nature. 2013;493:542–546. doi: 10.1038/nature11743. [DOI] [PMC free article] [PubMed] [Google Scholar]
- 18.Behar M, Barken D, Werner SL, Hoffmann A. The dynamics of signaling as a pharmacological target. Cell. 2013;155:448–461. doi: 10.1016/j.cell.2013.09.018. [DOI] [PMC free article] [PubMed] [Google Scholar]
- 19.Lito P, Rosen N, Solit DB. Tumor adaptation and resistance to RAF inhibitors. Nat Med. 2013;19:1401–1409. doi: 10.1038/nm.3392. [DOI] [PubMed] [Google Scholar]
- 20.Bieler J, et al. Robust synchronization of coupled circadian and cell cycle oscillators in single mammalian cells. Mol. Syst. Biol. 2014;10:739. doi: 10.15252/msb.20145218. [DOI] [PMC free article] [PubMed] [Google Scholar]
- 21.Feillet C, et al. Phase locking and multiple oscillating attractors for the coupled mammalian clock and cell cycle. Proc. Natl. Acad. Sci. U.S.A. 2014;111:9828–9833. doi: 10.1073/pnas.1320474111. [DOI] [PMC free article] [PubMed] [Google Scholar]
- 22.Sancar A, et al. Circadian clock control of the cellular response to DNA damage. FEBS Lett. 2010;584:2618–2625. doi: 10.1016/j.febslet.2010.03.017. [DOI] [PMC free article] [PubMed] [Google Scholar]
- 23.Gaglia G, Guan Y, Shah JV, Lahav G. Activation and control of p53 tetramerization in individual living cells. Proc. Natl. Acad. Sci. U.S.A. 2013;110:15497–15501. doi: 10.1073/pnas.1311126110. [DOI] [PMC free article] [PubMed] [Google Scholar]
- 24.Carpenter AE, et al. CellProfiler: image analysis software for identifying and quantifying cell phenotypes. Genome Biol. 2006;7:R100. doi: 10.1186/gb-2006-7-10-r100. [DOI] [PMC free article] [PubMed] [Google Scholar]
- 25.Loewer A, Karanam K, Mock C, Lahav G. The p53 response in single cells is linearly correlated to the number of DNA breaks without a distinct threshold. BMC Biol. 2013;11:114. doi: 10.1186/1741-7007-11-114. [DOI] [PMC free article] [PubMed] [Google Scholar]
Associated Data
This section collects any data citations, data availability statements, or supplementary materials included in this article.


