Abstract
Previous research suggests that extinction learning is temporally specific. Changing the CS duration between training and extinction can facilitate the loss of the CR within the extinction session but impairs long-term retention of extinction. In two experiments using conditioned magazine approach with rats, we examined the relation between temporal specificity of extinction and CR timing. In Experiment 1 rats were trained on a 12-s, fixed CS-US interval and then extinguished with CS presentations that were 6, 12, or 24 s in duration. The design of Experiment 2 was the same except rats were trained using partial rather than continuous reinforcement. In both experiments, extending the CS duration in extinction facilitated the diminution of CRs during the extinction session, but shortening the CS duration failed to slow extinction. In addition, extending (but not shortening) the CS duration caused temporal rescaling of the CR, in that the peak CR rate migrated later into the trial over the course of extinction training. This migration partially accounted for the faster loss of the CR when the CS duration was extended. Results are incompatible with the hypothesis that extinction is driven by cumulative CS exposure and suggest that temporally extended nonreinforced CS exposure reduces conditioned responding via temporal displacement rather than through extinction per se.
Keywords: Extinction, Pavlovian, classical conditioning, appetitive, interval timing, partial reinforcement
The repeated presentation of a conditioned stimulus (CS) without the unconditioned stimulus (US) causes extinction of CRs. But what feature of a CS presentation drives extinction? As the number of non-reinforced trials accumulate in an extinction procedure, the cumulative duration of non-reinforced exposure to the CS necessarily increases. In many experiments these two aspects of extinction—the number of non-reinforced trials and cumulative exposure—are confounded. From a theoretical point of view this confounding is important, as some theories suggest that extinction depends on the number of non-reinforced trials (Mackintosh, 1975a; Pearce & Hall, 1980; Rescorla & Wagner, 1972), some alternatives assert that extinction depends on cumulative non-reinforced exposure to CS (Gallistel & Gibbon, 2000), and other theoretical approaches allow for both possibilities (Balsam, Drew, & Gallistel, 2010; Gallistel, 2012; Gallistel & Balsam, 2014).
The cumulative exposure theories are based on the idea that during conditioning subjects come to form temporal expectations about the rate of US presentation (Balsam et al., 2010; Balsam & Gallistel, 2009; Gallistel & Gibbon, 2000; Ward, Gallistel, & Balsam, 2013). To compute rates animals must accumulate the duration of CSs as well as the number of USs signaled by the CS. Consequently, extinction will depend on detecting that the rate of US presentations has changed. When US rates are low this will necessarily take longer (greater cumulative exposure) than when US rates are high. The strong prediction of these theories is that when cues are partially reinforced during acquisition, the number of trials it takes to reach an extinction criterion will be inversely proportional to US probability. Take as an example a 10-s CS that is reinforced on every occasion. The minimum exposure to the CS that is needed to detect that a reward was not presented will be 10s. On the other hand, if a 10-s cue is reinforced on 50% of its presentations the animal will come to expect reward on average after 20s of CS. Consequently, it will need at least 20s of exposure to the CS in extinction to detect that the US was omitted. There have been a few tests of this prediction about partial reinforcement. Haselgrove, Aydin and Pearce.(2004) examined extinction after continuous and partial reinforcement in CSs that were equivalent with respect to the expected rate of reward. They either changed the duration of CSs (e.g. a 10-s cue reinforced 50% of the time vs. a 20-s cue reinforced 100% of the time) or the number of US's per CS (e.g. a 10-s CS reinforced 50% of the time with 2 USs vs. a 10-s CS reinforced 100% of the time) in order to equate the US rates in the partial and continuous conditions. Nevertheless, they found that extinction took longer in all conditions in which the CS was partially reinforced. Using a similar experimental design, Bouton, Woods & Todd (2014) observed similar results. The data are not consistent with time-based theories, which predict that extinction speed should be directly related to CS duration. The empirical evidence instead suggests that extinction is a trial-driven process (Bouton et al., 2014; Drew, Yang, Ohyama, & Balsam, 2004; Golkar, Bellander, & Öhman, 2013).
While these studies provide convincing evidence that the speed with which CRs extinguish is regulated by the number of discrete extinction trials, this is not to say that the temporal properties of trials have no impact on extinction. If the duration of the CS in extinction is very different (longer or shorter) than the one used during conditioning, extinction is more rapid (Drew et al., 2004; Haselgrove & Pearce, 2003)—likely the result of generalization decrement in the same way that changing other properties of CSs in extinction diminish CR strength (Hovland, 1937). Furthermore, there is evidence that retention of extinction learning is best when the training and extinction CS durations are identical. That is, spontaneous recovery of CRs is high if extinction occurs with a CS of different duration than the training CS (Drew et al., 2004; Plendl & Wotjak, 2010). This effect of changing the CS duration could, again, reflect generalization decrement (Drew et al., 2004).
However, another reason why changes in CS duration might influence the speed and permanence of extinction could arise because a change in CS duration during extinction might itself change the expected time of US arrival. Previous work examining CR timing following extinction suggests that during extinction specific temporal expectancies of the US are preserved (Drew et al., 2004; Dudeney, Olsen, & Kehoe, 2007; Guilhardi & Church, 2006; Ohyama, Gibbon, Deich, & Balsam, 1999) and are reflected in maximum CR probability around the expected time of US presentation when subjects are retested on the original training CS duration. However, an additional potentially important effect of changing CS duration during extinction was found by Guilhardi & Church (2006) in a series of creative experiments. In their second experiment, rats were trained on fixed interval (FI) schedules to expect reward in the presence of 3 different cues that each signaled a different expected time to reward. As in previous studies, anticipatory responding was scaled such that the maximum response rate coincided with the expected delay to reward signaled by each cue. For some subjects the cue durations were changed in extinction. Surprisingly, the pattern of anticipatory responding was determined by the duration of the cues in extinction, not by the previous training interval. Subjects' maximal responding shifted to the end of the extinction cue even when the cue was of a different duration than the training cue. It appeared as though the subjects rescaled their expectation of reward to the new cue durations as reflected in this shift in CR timing.
The current studies had two main purposes. First, we sought to monitor changes in CR timing during extinction and spontaneous recovery and determine the extent to which such changes account for effects of CS duration on extinction speed and retention. Second, we asked whether the sensitivity to changes in CS duration during extinction is modulated by the training protocol. In previous studies demonstrating that changes in CS duration between training and extinction impair long-term extinction (Drew et al., 2004; Plendl & Wotjak, 2010) subjects were trained on continuous reinforcement (CRF). In contrast, studies examining changes in CS duration after partial reinforcement (PRF) focused exclusively on within-session extinction. We wondered whether PRF might encourage more temporally-based expectancies (Harris, Patterson, & Gharaei, 2015), that might render subjects more sensitive to effects of cumulative CS exposure on long-term extinction.
Consequently, we examined the effect of changing the CS duration between training and extinction. Rats were trained with a fixed CS-US interval using a Pavlovian magazine approach paradigm. In Experiment 1 rats were trained with continuous reinforcement (CRF); in Experiment 2 partial reinforcement (PRF) was used. In extinction rats received CS presentations that were shorter, the same as, or longer than the acquisition CS duration. On the day following extinction, rats received a test session with the original CS duration. Our analysis focuses on the rate of decrease of responding during extinction as well as the temporal distributions of responding. Our goals were (1) to assess whether the training reinforcement schedule (CRF v. PRF) affects sensitivity to changes in CS duration in extinction, (2) to determine whether changes in CS duration during extinction modify CR timing, and, if so, (3) to assess the extent to which changes in CR timing account for effects of CS duration on extinction speed and retention of extinction.
Experiment 1
In Experiment 1 rats were trained on CRF in a Pavlovian approach paradigm using a 12-s fixed CS-US interval. During extinction, the CS presentations were 6, 12, or 24 s in duration in different groups of subjects. On the day following extinction, rats received a test session with CS presentations at the original 12-s duration. We assess how a change in CS duration affects the loss of responding and the timing of responding within the extinction session and in the test session the following day.
Method
Subjects
Forty-eight male Sprague–Dawley rats (400 – 550 g), which were housed on a 13 – 11 light – dark cycle (lights on at 8:00 a.m.). They were given 1 h access to food (Purina rat chow) per day and ad libitum water, except on weekends when they were allowed free access to food until Sunday afternoon. The experimental protocol was approved by the Columbia University Institutional Animal Care and Use Committee.
Apparatus
The subjects were trained and tested in modular test chambers (Med Associates, Georgia, VT; model ENV-008-VP) with dimensions of 30 × 24 × 21 cm. The chambers were housed individually inside light- and sound-attenuating isolation boxes equipped with fans for ventilation. A food trough (5 × 5 cm) was centered in the right side panel, 2 cm above the floor. The food trough was equipped with an infrared photocell that recorded head entries, the response of interest in this study. The chambers were illuminated throughout the session by a red stimulus light, acting as a houselight. The chambers were equipped with a speaker that delivered an 80-dB white noise serving as the conditioned stimulus.
Procedure
Rats were given feeder training sessions, once per day on consecutive days. Rats were placed in the test chambers with the houselight illuminated and five food pellets (45mg grain-based pellets, Bioserve, Frenchtown, NJ) in the food trough. After 15 min, they were removed. By the second session, all rats were eating from the trough. Next, rats received up to 5 sessions of magazine training. Pellets were dropped into the food trough on a variable-time schedule with an inter-pellet interval averaging 45s. The session ended after 20 pellets had been presented. Sessions continued until each pellet was consumed within 5 s after being presented.
Upon completion of pre-training rats received 14-17 conditioning sessions in which a fixed-duration white noise conditioned stimulus (CS; 80dB) was paired with food pellet US on a CRF schedule. Each training session consisted of 8 pairings of a 12-s white noise CS and food pellet US. The food pellet was delivered as the CS terminated. The intertrial interval (ITI) was variable with a mean of 120s (minimum 22s, maximum 442s). At the completion of acquisition, subjects were assigned to 3 groups, matched for CS response rate during the final 2 acquisition sessions. Rats then received a single extinction session in which the CS was presented 80 times without reinforcement, and the CS duration was 6 s (n = 16; Group 6), 12 s (n = 16; Group 12) or 24s (n = 16; Group 24). The ITI was the same as that used during training. Because all the extinction sessions could not be run in a single day (because of their length), the sessions were staggered, with subjects receiving acquisition sessions until their extinction day arrived. On the day following extinction, rats received a test session consisting of 16 CS presentations, and the CS duration was 12 s for all subjects. The ITI was the same as in training.
Data Analysis
The primary measure of interest was the rate of head entries into the food compartment (entries/s). The extinction data were analyzed in two ways. First we analyzed per-trial response rates as a function of trials. These data were analyzed using Group × Trial Block mixed ANOVA implemented in SPSS Version 24 (IBM, Inc.). Trial block was treated as a repeated measure. ANOVA interactions were probed using pairwise Tukey HSD tests for between-subject comparisons and Bonferroni-corrected oneway analysis for within-subject comparisons. Effect size was calculated using the partial eta-squared statistic (ηp2), which is reported with 90% confidence intervals using the method described by Steiger (2004) and calculated using the MBESS package in R (Kelley 2007).
We also assessed temporal distribution of responses during extinction using curve fitting described below. The fit parameters (I and r2) were analyzed using a linear mixed model implemented in JMP (SAS Institute). The mixed model was used (rather than ANOVA) because of its tolerance of missing observations, which, in this case, occurred when subjects failed to emit enough responses for inclusion in the temporal analysis (see below). The basic form of the mixed model included CS Duration, Trial Block and the CS Duration × Trial Block Interaction as predictors. Subjects were included as a random variable (nested within CS Duration), which permitted each individual subject to have a unique intercept that accounted for individual differences in response rate. Because the dependent measures typically changed monotonically as a function of Trial Block, Trial Block was treated as a continuous variable with 1 degree of freedom. The models were fit using the restricted maximum likelihood (REML) method. The contributions of each predictor to the model were evaluated by computing a type III F ratio, which evaluates the marginal contribution of each predictor after excluding variance explained by the other predictors in the model.
Curve Fitting
To characterize the timing of responding during the CS in extinction, Weibull cumulative distribution functions were fit to individual subject data from Figures 4 and 10. The data were response rates per second of the trial, averaged into 2-trial (Experiment 1) or 8-trial (Experiment 2) blocks. The data were converted to cumulative sum functions, then fit to a 3-parameter Weibull cumulative distribution function
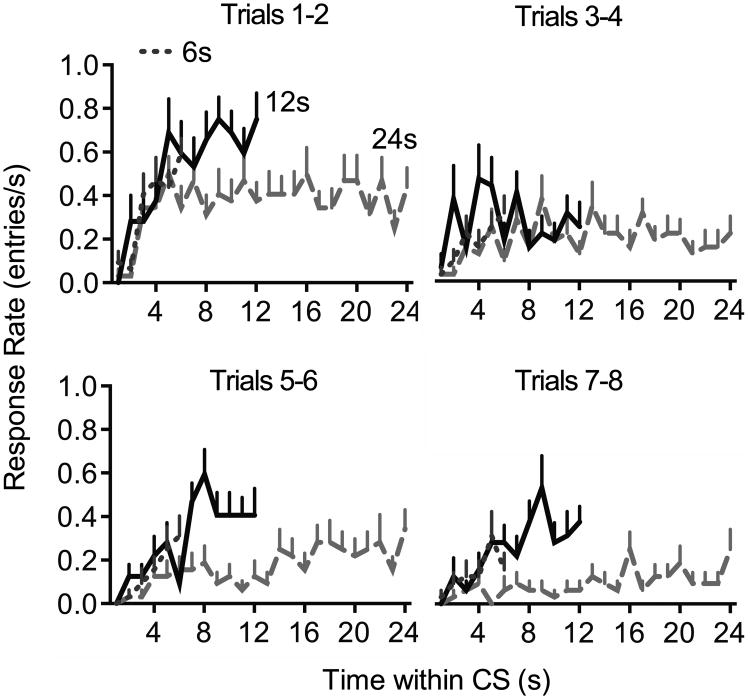
Figure 4.
Temporal distribution of responses during extinction in Experiment 1. The response rate is plotted as a function of time within the CS. All groups show an acceleration of responding in the early part of the CS. The location of the response rate asymptote appears to shift rightward over the course of extinction, particularly in Group 24.
Figure 10.
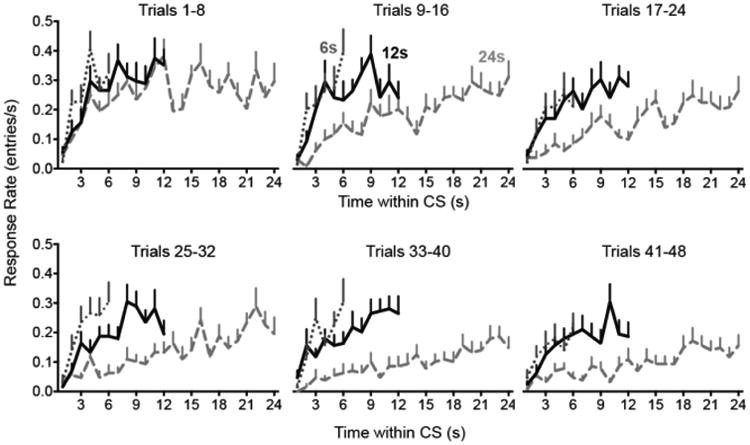
Temporal distribution of responses during extinction in Experiment 2. The response rate is plotted as a function of time within the CS. All groups show an acceleration of responding in the early part of the CS. The location of the response rate asymptote appears to shift rightward over the course of extinction, particularly in Group 24.
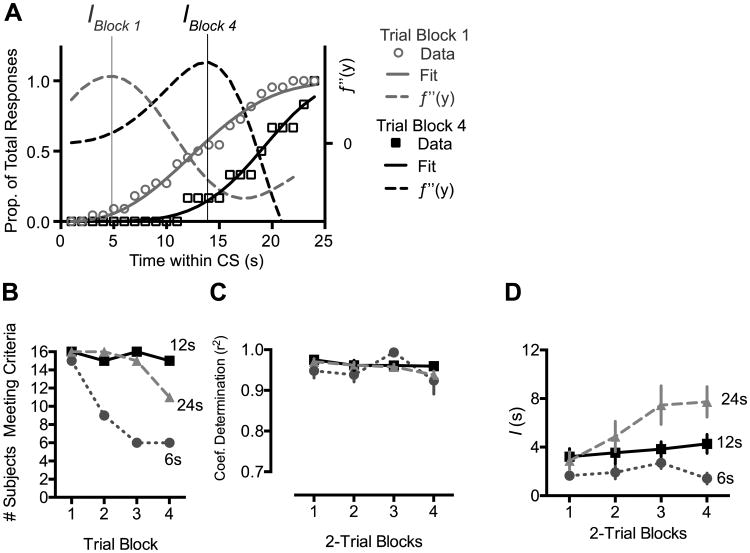
The data were fit using the nonlinear least squares method in the MatLab curve fitting toolbox (Mathworks, Inc.). Our analysis focused on the first inflection point of the obtained curve, which identifies the time at which response rate transitioned from low to high. This point, which we termed I, was defined as the maximum of the second derivative (determined empirically) of the Weibull fit (Figure 5A). Only those fits that accounted for more than 70% of variance in the data (coefficient of determination > .7) were included in analysis. All trial blocks with at least 2 responses were fit.
Figure 5.
Characterization of response timing in Experiment 1. A, To obtain a quantitative assessment of response timing, we fit cumulative records of within-CS responding to the Weibull cumulative distribution function. The time, I, at which response rate transitioned from low to high was defined as the maximum of the second derivative of the obtained Weibull fit. B, Number of subjects reaching criteria for inclusion in the temporal analysis. C, Coefficient of determination for the obtained curve fits. D, The value of the I parameter as a function of extinction trial blocks. I increased over trial blocks only in Group 24. Error bars represent ±1 SEM.
Bootstrap Analysis
A mere reduction in responding may be sufficient to produce a rightward shift in the temporal distribution of responses. Bootstrap analysis was used to test whether the temporal rescaling observed in our data exceeded that expected purely on the basis of decreased responding during extinction. The data represented in Figures 4 and 10 were the source of the bootstrap samples. These data (response rates per second of the CS) were converted to arrays of response times, each data point representing the time (relative to CS onset) of one response. The bootstrap samples were selected randomly with replacement from these arrays. The trial block from which the responses were drawn was denoted SourceRT. We varied the number of responses, n, selected for each bootstrap sample. The number, n, corresponded to the number of responses made during a particular block of extinction. The trial block from which n was obtained was denoted Sourcen. To test the hypothesis that a reduction in responding is sufficient to cause an apparent rescaling of response timing, we performed a boostrapping experiment in which SourceRT was trial block 1, and each of the first 4 trial blocks was used as Sourcen. For comparison, in a second bootstrap analysis SourceRT and Sourcen were the same. One thousand samples were generated for each trial block (1-4) of each subject. Curve fitting was performed on each bootstrap sample, as described above. The median I value and goodness-of-fit (r2) were taken across the 1000 bootstrap samples for each subject.
Statistical analysis of the bootstrap data tested whether the increase in S over Sourcen trial blocks was larger when SourceRT = Sourcen then when SourceRT was always Trial Block 1. The S values for each CS Duration group were fit to each of two linear mixed models using the lme4 package in R (Bates, Mächler, Bolker, & Walker, 2015). Model 1 included Sourcen Trial Block and SourceRT, but not their interaction, as predictors. Model 2 included the interaction and the main effect terms. Subjects were included as a random effect in both models. The models were fit using the maximum likelihood method (Pinheiro & Bates, 2010; Winter, 2013) and compared using the likelihood ratio, which approximates the chi-square (χ2) distribution. A significant chi-square indicates the presence of a significant Sourcen × SourceRT interaction and supports the conclusion that the increase in I over trials exceeded that caused by a change in response rate. We also computed a Bayes factor (BF) to compare the likelihood of the data under the two linear models. BF10 refers to the likelihood of the alternative hypothesis (interaction model) compared to the null (main effects only model), whereas BF01 (BF01 = 1/BF10) refers to the likelihood of the null compared to the alternative. The BF was calculated using JZS method in the BayesFactor package in R (Rouder, Morey, Speckman, & Province, 2012; http://bayesfactorpcl.r-forge.r-project.org/; Rouder, Speckman, Sun, Morey, & Iverson, 2009). A BF greater than 3 is considered “some evidence” in favor of one hypothesis (or model) over the other; odds greater than 10 is considered “strong evidence”; and odds greater than 30 is considered “very strong evidence” (Jeffreys, 1998).
Results and Discussion
As shown in Figure 1, during acquisition training rats reached asymptotic levels of responding within approximately 8 training sessions. Response rates during the CS where substantially higher than those during the pre-CS period, defined as the 12 s prior to CS onset.
Figure 1.
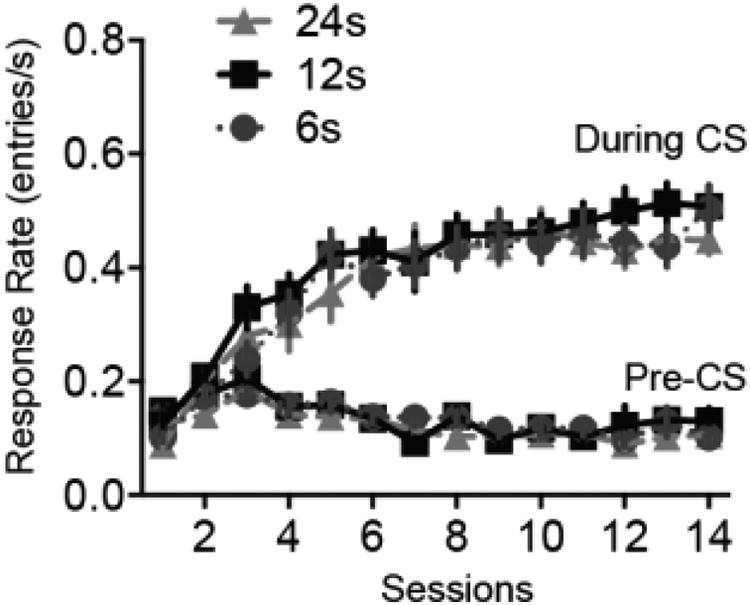
Acquisition of magazine approach to the noise CS. During acquisition, the CS-US interval was 12s for all subjects. Pre-CS response rates are taken from the 12s prior to each CS presentation. Error bars represent ±1 SEM.
For the extinction session, we first analyzed responding during the pre-CS periods (Figure 2A). The pre-CS rates were quite low in all groups relative to the CS rates. The pre-CS rates declined over trials (F11,495 = 7.72, p < .001, ηp2 = .15 [.08, .18] but did not differ by CS Duration (F < 1) or the interaction (F22,495 = 1.3, p = .181). The CS response rates were analyzed in three ways. First we analyzed the whole-CS response rates as a function of trials (2-trial blocks) during the extinction session (Figure 2B). Because all subjects had fully extinguished by the 12th trial block, only the first 12 blocks were included in the analysis. Data were subjected to a Trial Block × CS Duration ANOVA with the former as a repeated measure. The Trial Block × CS Duration interaction was highly significant, (F22495 = 2.07, p = .003, ηp2 = .084 [.006, .104]). The interaction was probed using pairwise comparisons within each Trial Block. The Group 12 response rate exceeded that of each of the other two groups in Trials Blocks 1 (p's < .01), 3 (p's < .01), and 4 (p's < .05). Group 24 and Group 6 differed in block 6 (p = .032). The analysis suggests that the Groups 6 and 24 groups extinguished faster than Group 12.
Figure 2.
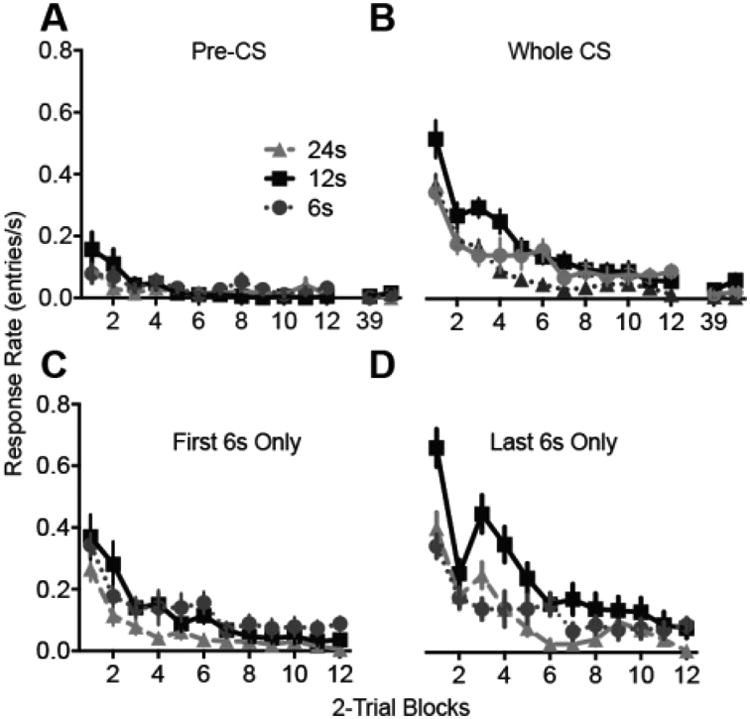
Extinction for Experiment 1. The duration of each noise presentation was 6, 12 or 24s. A, Response rate during the pre-CS periods. B-D, Responding during the CS periods. Response rate was calculated using the entire CS duration (B), using only the first 6 s of each CS presentation (C), or using only the last 6s of each CS presentation (D). Error bars represent ±1 SEM.
The apparent differences in extinction speed may be an artifact related to the change in CS duration between training and extinction. CRs are timed to anticipate the US, meaning that the CR rate varies across the duration of a CS presentation. Thus, the response rate will depend on which portion of the CS was included in the calculation. To control for this source of variation, we conducted additional analyses using comparable segments of the CS. First we analyzed only the first 6 s of each CS presentation for all groups (Figure 2C). The data were subjected to Trial Block × CS Duration ANOVA, which yielded a significant effects of CS Duration (F2,45 = 5.1, p = .010, ηp2 = .184 [.027, .322]) and Trial (F11,495 = 24.9, p < .001, ηp2 = .356 [.289, .393]) but not of the interaction (F < 1). Pairwise comparisons among the 3 groups confirmed that Group 24's response rate was significantly lower than that of the Groups 12 (p = .012) and 6 (p = .048), but Groups 12 and 6 (p = .852) did not differ. We also compared the groups using only the final 6s of each CS presentation (Figure 2D). In this analysis the Trial Block × CS Duration interaction reached significance (F22, 495 = 3.4, p < .001, ηp2 = .13 [.053, .139]). Post-hoc pairwise comparisons within each trial block showed that Group 12 exceeded Groups 6 and 24 in trial blocks 1, 3 and 4 (p's < .01). Groups 6 and 24 differed only in trial block 6 (p = .047).
Thus, the effects of changing the CS duration during extinction depended on which portion of the extinction CS was analyzed. When the whole CS or only the last 6s of the CS were analyzed, a changed CS duration during extinction was associated with faster cessation of responding. However, when the only first 6s of the CS was analyzed, extending the CS duration in extinction speeded the cessation of responding but shortening the CS duration had no effect. The results are partially consistent with those of Drew et al. (2004) and Haselgrove et al. (2003). Both studies reported that increases in CS duration between training and extinction facilitated within-session extinction. Haselgrove et al. reported that decreases in CS duration were also sufficient to facilitate extinction; however, the changes in CS duration were much larger than those employed in the current experiments. The current data suggest that measures of extinction speed vary depending on which portion of the CS is analyzed, and the effects of changing the CS duration on extinction may, in part, reflect changes in CR timing. We revisit this issue below.
On the day following extinction, all rats received test trials with the original CS duration. Pre-CS rates (Figure 3, left panel) and CS rates (Figure 3, right panel) were both low. Responding during the pre-CS period did not differ significantly among Groups, although the CS Duration × Trial Block interaction approached significance (F14,315 = 1.6, p = .082). During the CS periods responding was modestly higher in Group 6 than the other groups. A CS Duration × Trial Block ANOVA on the CS rates revealed a significant effect of CS Duration (F2, 45 = 3.9, p = 0.027, ηp2 = .15 [.010, .283]) but not of the interaction (F14, 315 = 1.4, p = 0.135). In follow-up pairwise comparisons, Groups 6 and 24 differed significantly (p = .021), but the other comparisons did not reach significance. The test session results are consistent with those of Drew et al. (2004), who reported that decreases in CS duration between training extinction were associated with stronger spontaneous recovery during a test session with the original CS duration. However, the present test session should be interpreted with caution because of the potential for floor effects resulting from the low CS response rates.
Figure 3.
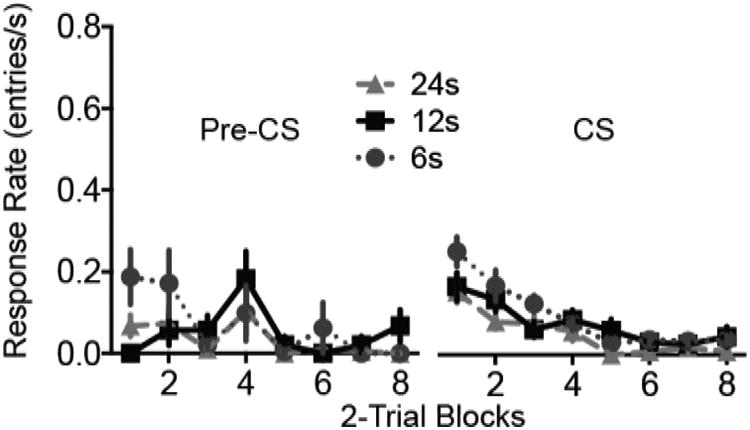
Test session for Experiment 1. Response rates during the pre-CS (left panel) and CS (right panel) periods during a test session 24h after extinction in which all rats received sixteen 12-s presentations of the CS. Error bars represent ±1 SEM.
Timing in Extinction
The fact that extinction speed varied according to which portion of the CS was analyzed raises the question of how CRs are timed during extinction, and whether CR timing is influenced by the extinction CS duration. We plotted the temporal distribution of responses as a function of time within the CS for each block of 2 extinction trials. Because timing can only be assessed in subjects that exhibit responses, we limited our analysis to the first 4 trial blocks. As shown in Figure 4, all groups showed evidence of timed responding, in that the response rate peaked near the time at which the US was delivered during training. However, CR timing appeared to change over the course of extinction, particularly in Group 24, whose asymptote appeared to shift rightward during extinction. To quantify changes in CR timing, we used the curve fitting method described above to determine the time, I (in seconds), during the CS at which response rate transitioned from low to high (Figure 5A). The number of subjects meeting criteria for inclusion in the modeling (see Methods, above) is shown in Figure 5B. The fit results are shown in Figure 5C,D. The mean coefficient of determination (r2), which represents the amount of variance accounted for by the model, exceeded .9 for all groups (Figure 5C) and did not differ by Group (F2,39 = 1.5, p = .240), Trial Block (F1,118 = 2.6, p = .107) or the Group × Trial interaction (F2,117 < 1). The value of the I parameter (Figure 5D), however, was modulated by the Group × Trial interaction (F2,120 = 5.3, p = .006). Simple effects analysis using a Bonferroni-corrected criterion indicated that I increased as a function of trials in Group 24 (F1,42 = 12.6, p = .001) but not in Groups 6 (F < 1) or 12 (F1,45 = 1.2, p = .284)
We wished to assess whether the rightward shift in response timing during extinction was greater in magnitude than any shift caused simply by a decrease in responding. As the response rate decreases in extinction, responding early in the trial may cease before responding later in the trial, creating an apparent rightward shift in the temporal distribution of responses. This could conceivably produce an increase in the value of I. To assess the extent to which changes in response rate explain changes in I during extinction, we performed a bootstrapping experiment in which different numbers of responses were drawn from the pool of responses that occurred during different extinction trial blocks. We first used the responses during trial block 1 (before rescaling) as the source of the bootstrap samples (i.e., SourceRT = 1). To test the hypothesis that a reduction in responding is sufficient to alter response timing, we varied the number of responses, n, selected (with replacement) for each bootstrap sample. The value of n was equal to the number of responses made during each (actual) extinction trial block. For example, subject 1006 made 22 responses during block 1 of extinction and 6 responses during block 4 (Figure 6A,B). Bootstrap samples were generated by selecting 22 responses from block 1 (SourceRT = 1, Sourcen = 1) or 6 responses from block 1 (SourceRT = 1, Sourcen = 4). For comparison, we generated bootstrap samples in which SourceRT and Sourcen were the same; e.g., 6 responses were drawn from block 4 (SourceRT = Sourcen = 4). One thousand samples were generated for each trial block of each subject. Curve fitting was performed on each sample, as described above. The median I value and goodness-of-fit (r2) were taken across the 1000 bootstrap samples for each subject, then analyzed using mixed-effects model with SourceRT, Sourcen, and their interaction as independent variables. If the reduction in responding during extinction is sufficient to increase I, then the value of I should increase as a function of Sourcen trial blocks regardless of SourceRT. If, on the other hand, the shift in I exceeds that expected purely on the basis of reduced responding, then the change in I will be larger when SourceRT = Sourcen than when SourceRT is trial block 1.
Figure 6.
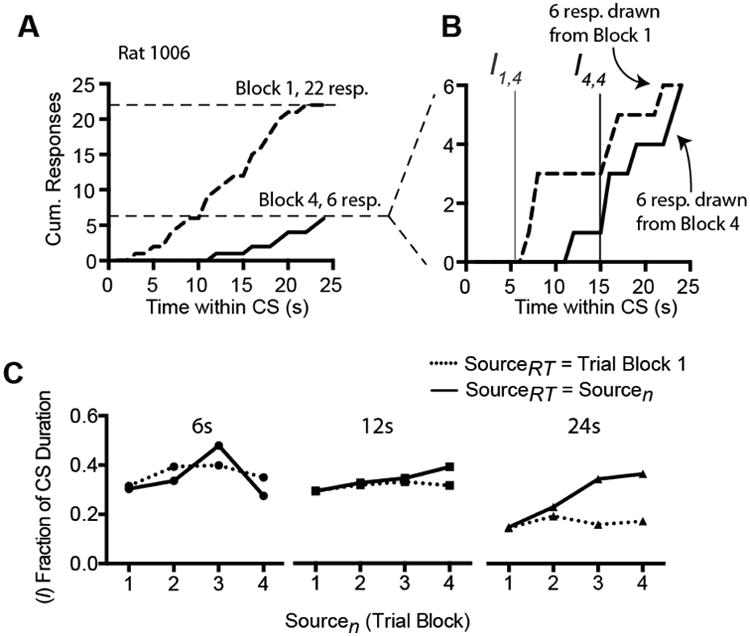
Bootstrapping was performed on the curve fits from Experiment 1 to determine whether the reduction in responding during extinction was itself sufficient to cause a shift in I. A,B, Example data from the boostrapping experiment. To test the hypothesis that a reduction in responding is sufficient to shift I, we generated bootstrap samples by randomly selecting n responses from the real distribution of response times. The value of n corresponded to the number of responses occurring during a particular trial block (Sourcen). The trial block from which response times were drawn is denoted SourceRT. SourceRT could be either block 1 or the same block as Sourcen. The bootstrap samples were fit and the I value calculated as described above. C, Results of the bootstrap experiment. I is expressed as a fraction of the extinction CS duration. In Groups 6 and 12, I did not differ as a function of SourceRT. In Group 24, changes in Sourcen increased I when responses times were drawn from Sourcen but not when all response times were drawn from block 1 only. This pattern confirms that the increase in I during extinction in Group 24 exceeded any change expected purely on the basis of diminished responding.
The results of the boostrap analysis are shown in Figure 6C. The data for each CS duration group were individually analyzed using the mixed model to test for an interaction between Sourcen Trial Block and SourceRT. A significant interaction would indicate that the change in I over trials exceeded any migration attributable to a decline in responding. As described above (Data Analysis), the obtained S values were fit to two linear models, one including Sourcen Trial Block and SourceRT main effects as predictors and a second model with the interaction and main effects as predictors. Both models included Subjects as a random variable. In Group 24 the interaction model provided a better fit to the data than the main effects model (χ2 = 11.4, df = 1, p < .001). Follow-up pairwise comparisons at each level of Trial Block confirmed significant effects of SourceRT in Sourcen trial blocks 3 and 4 (p's < .02). The two models were additionally compared using the Bayes factor, which confirmed that the data were more consistent with the interaction model than with the main effects model (BF10 = 4.61). In contrast, for Groups 6 and 12, the interaction models failed to provide a better fit than the main effects models (χ2's < 1, df's = 1, p's > .3). In these groups, the Bayes factors indicated a weak preference for the main effects model over the interaction model (Group 6: BF01 = 2.9; Group 12: BF01 = 2.9). The analysis indicates that only Group 24 exhibited a migration of I during extinction, and this migration exceeded what would be expected purely because of a reduction in responding. We did not detect evidence of migration in Groups 6 and 12. However, we cannot exclude the possibility of a weaker (undetected) migration these groups, particularly because of the small number of subjects in Group 6 meeting the criteria for inclusion in this analysis.
In summary, the results of Experiment 1 are consistent with earlier reports that a change in CS duration between training and extinction can facilitate within-session extinction (Drew et al, 2004; Haselgrove & Pearce, 2003) and weaken long-term extinction (Drew et al., 2004). There was also evidence for temporal rescaling (Guilhardi & Church, 2006). When the extinction CS duration was longer than the training CS duration, conditioned responding migrated toward later periods in the trial as extinction progressed. The migration was not evident in groups extinguished with CS durations that were shorter than or the same as the training CS duration. However, between-group comparisons were complicated by the rapid diminution of responding during extinction, which yielded little data suitable for the temporal analysis, particularly in the group extinguished on the short CS duration.
Experiment 2
Experiment 2 had two purposes. First, we sought to determine whether PRF training would render subjects more sensitive to changes in CS duration during extinction. Second, we wished to characterize temporal rescaling using a training procedure (PRF) that favors more robust responding in extinction. We predicted that partial reinforcement would yield more responding during extinction and the spontaneous recovery test session, thus enabling a more precise characterization of temporal rescaling during extinction. The procedure, results and analysis are identical to those of Experiment 1, except rats were trained on PRF rather than CRF.
Procedure
The protocol was same as that of Experiment 1, except rats were trained on a partial reinforcement (PRF) schedule. Each training session consisted of 32 CS presentations, of which a randomly-selected 8 were reinforced. As in Experiment 1, subjects received 80 extinction trials with CS durations of 6 s (n = 16), 12 s (n = 16) or 24 s (n = 16). A test session consisting of 16 presentations of the 12-s CS occurred on the day following extinction.
Results and Discussion
As shown in Figure 7, during acquisition training rats reached asymptotic levels of responding within approximately 6 training sessions. Response rates during the CS where substantially higher than those during the pre-CS period, defined as the 12 s prior to CS onset.
Figure 7.
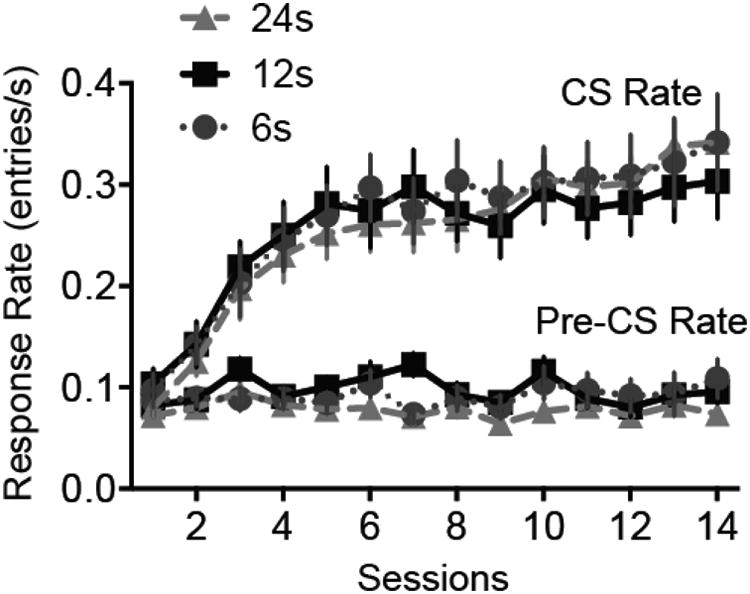
Acquisition of magazine approach to the noise CS in Experiment 2. The CS-US interval was 12s for all subjects. Error bars represent ±1 SEM.
The extinction data in 8-trial blocks are displayed in Figure 8. As in Experiment 1, the pre-CS response rates were quite low during extinction (Figure 8A). Nevertheless, there were modest differences among groups early in the extinction session. A CS Duration × Trial Block ANOVA turned up a significant interaction effect (F18,405 = 1.8, p = .021, ηp2 = .07 [.005, .076]. Group 6 and 12 rates exceeded those of Group 24 in the first trial block (p's < .01) and Group 12 exceeded both other groups in trial block 3 (p's < .01). Out of concern that the pre-CS responding might affect interpretation of CS responding, we analyzed CS responding using both absolute CS response rates and difference scores (CS rate - ITI rate; data not shown). Because the pre-CS response rates were quite low, the choice of measures did not affect any of outcomes discussed below. Therefore, our analysis of CS responding focuses on absolute response rates, as in Experiment 1.
Figure 8.
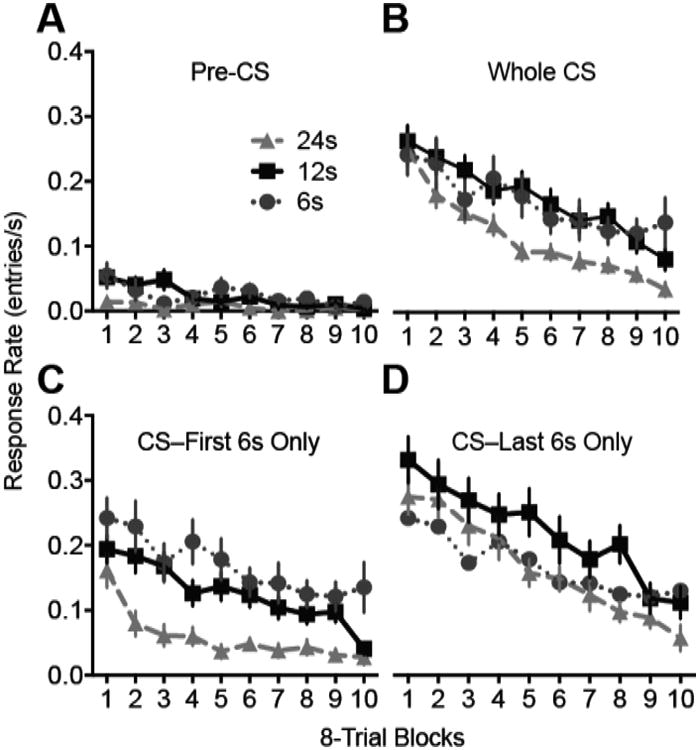
The extinction session for Experiment 2. The duration of each noise presentation was 6, 12 or 24s. A, Response rate during the pre-CS periods. B-D, Responding during the CS periods. Response rate was calculated using the entire CS duration (B), using only the first 6 s of each CS presentation (C), or using only the last 6s of each CS presentation (D). Error bars represent ±1 SEM.
As in Experiment 1, the extinction CS response rates were affected by CS duration. Figure 8B shows whole-trial response rates as a function of extinction trials. ANOVA confirmed a significant effect of Group (F2,45 = 3.5, p = .038, ηp2 = .14 [.004, .268]). Planned pairwise comparisons confirmed significant differences between Groups 12 and 24 (p = .021) and between 6 and 24 (p = .034) but not between Groups 6 and 12 (p = .849). To assess the strength of evidence against a difference between Groups 6 and 12, we computed a Bayes factor, which indicated that the data from these two groups were modestly more consistent with the null hypotheses (response rate affected by Trial Block only) than under the alternative hypothesis (affected by CS Duration and Trial Block; BF01 = 2.8).
As in Experiment 1, the effects of changing the CS duration on extinction speed varied depending on which portion of the CS duration was analyzed. When the response rates were recalculated using only the first 6s of each CS presentation (Figure 8C), Group 24 continued to exhibit faster extinction. ANOVA confirmed a significant effect of Group (F2,45 = 11.3, p < .001, ηp2 = 34 [.135, .466]). Pairwise comparisons confirmed that Group 24's response rate was lower than that of the other two groups (p's < .01) but Groups 6 and 12 did not differ significantly (p = .119). A Bayes factor indicated that the Group 6 and 12 data were about equally likely under the null and alternative hypotheses (BF01 = 1.1). The data suggest that extending the CS duration had a larger effect on extinction speed than did shortening the CS duration, but we cannot confidently conclude that shortening the CS duration had no effect on extinction speed. In contrast, when extinction was analyzed using only the final 6s of each CS presentation (Figure 8D) there was no significant effect of either increasing or decreasing the CS duration on extinction speed. In the Group × Trial Block ANOVA there was a significant effect of Trial Block (F9,405 = 28.14, p < .001, ηp2 =.38 [.313, .426]) but not of Group (F2,45 = 1.9, p = .156) or the interaction (F18,405 = 1.5, p = .101). However, the Bayes factor indicated that the data were about equally likely under a model including only Trial Block as a predictor as compared to a model including Trial Block and CS Duration (BF01 = 1.5). Thus, although assessing extinction on the basis of response rates at the end of each trial attenuates the effect of CS duration on extinction speed, this analysis regime may not completely abolish the effect of CS duration.
On the day following extinction, subjects received test trials with the original CS duration (Figure 9). Response rates during the pre-CS periods (Figure 9, left panel) were quite low and did not differ by CS Duration (F < 1), Trial Block (F1,45 = 1.5, p = .232) or the interaction (F < 1). During the CS periods (Figure 9, right panel), responding was higher in Groups 6 and 12 than in Group 24. ANOVA yielded a significant effect of Group (F2,24 = 7.3, p = .002, ηp2 =.24 [.065, .383]). Pairwise comparisons confirmed that the response rate of Group 24 was significantly lower than that of the other groups (p's < .01), but Groups 6 and 12 did not differ significantly (p = .571). A Bayes factor computed on the data from Groups 6 and 12 strongly favored the null hypothesis (no difference between Groups 6 and 12; BF01 = 98.9). In PRF training, extending the CS duration in extinction facilitated long-term extinction, but shortening the CS duration failed to attenuate long-term extinction.
Figure 9.
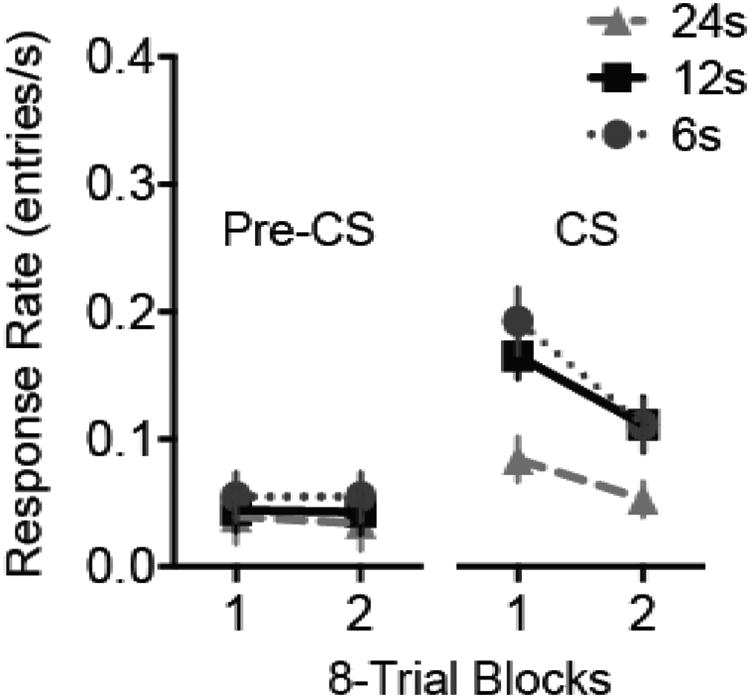
Test session for Experiment 2. Response rates during the pre-CS (left panel) and CS (right panel) periods during a test session 24h after extinction in which all rats received sixteen 12-s presentations of the CS. The CS response rate was lower in Group 24 relative to the other groups. Error bars represent ±1 SEM.
Timing in Extinction
To evaluate possible temporal rescaling of the CR during extinction, we plotted response rates during extinction as a function of time within each CS presentation (Figure 10). As in Experiment 1, Group 24's asymptote shifted rightward during the course of extinction. Response timing was quantified using curve fitting, as in Experiment 1. The number of subjects meeting criteria for inclusion in the analysis is shown in Figure 11A. Although the mean coefficient of determination (r2) exceeded 0.9 in all groups (Figure 11B), there were significant effects of Group (F2,41 = 6.3, p = .004) and Trial Block (F1,222 = 10.0, p = .002) on this measure, confirming that the fits were slightly better for Groups 12 and 24 than Group 6 and that the quality of the fits declined somewhat over Trial Block. Raising the criterion r2 to 0.9 abolished these effects but failed to alter the statistical outcomes reported below. The value of the I parameter increased over trials only in the Group 24 (Figure 11C). There was a significant Group × Trial Block interaction on the I parameter (F2,224 = 7.2, p = .001). Oneway analysis on the individual groups showed a significant effect of Trial block in the Group 24 (F1,76 = 14.7, p < .001) but not in Group 6 (F1,69 = 3.0, p = .085) or Group 12 (F1,77 = 1.9, p = .170).
Figure 11.
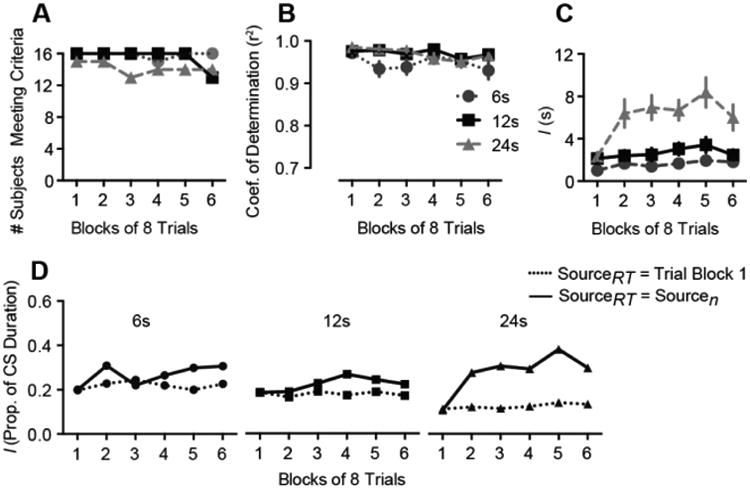
Characterization of response timing in Experiment 2. A, Number of subjects meeting criteria for inclusion in the temporal analysis. B, Coefficient of determination (goodness of fit) for the Weibull fits. C, The value of the I parameter as a function of extinction trials. D, Results of the bootstrapping experiment used to determine whether the shift in I during extinction exceeded any shift produced purely by a reduction in response rate. In Groups 6 and 12, I was affected by neither SourceRT nor Sourcen, indicating that the diminution of responding during extinction was not sufficient to alter I. In Group 24, changes in Sourcen altered I when response times were drawn from Sourcen but not when response times were drawn from Block 1 only. This pattern confirms that the increase in I during extinction in Group 24 exceeded any change expected purely on the basis of diminished responding. Error bars represent ±1 SEM.
To assess whether the temporal rescaling in Group 24 exceeded any effect expected purely on the basis of a diminution in responding, we conducted a bootstrapping experiment (Figure 11D). As in Experiment 1, responses were drawn with replacement from block 1 (SourceRT = Block 1) or, for comparison, from each of the extinction trial blocks (SourceRT = Sourcen). The number of responses in each bootstrap sample was determined by the number of responses that occurred in each actual extinction block. The obtained I values for each group were fit to linear mixed models using the same method as Experiment 1. The SourceRT × Sourcen interaction was significant for Group 24 (χ2 = 12.7, df = 1, p < .001) but not for Groups 6 (χ2 = 1.8, df = 1, p < .177) and 12 (χ2 = 1.8, df = 1, p < .180). Bayes factors indicated a modest preference for the main effects models for Groups 6 (BF01 = 2.3) and 12 (BF01 = 3.0), but for Group 24 the interaction model was preferred (BF10 = 3.9). In summary, temporal migration was detected only in Group 24, and the bootstrap analysis confirms that the temporal rescaling in Group 24 was not an artifact related to changes in response rate during extinction.
Temporal rescaling may have also influenced response patterns on the test trials when Group 24 was re-exposed to the original CS duration. To the extent that responding rescaled to the 24-s extinction CS duration, relatively few responses would occur during the test trials that are only 12-s in duration. Figure 12A shows the temporal distribution of responses during the first 8 test trials with the 12-s CS. These distributions are superimposed on temporal distributions from extinction in Figure 12B. We selected the extinction block whose response rate was most similar to that during the test session. This was trial block 6 for Groups 6 and 12 and block 3 for Group 24. The test trial temporal distributions closely approximate those from extinction. Each group was individually subjected to Phase (Test v. Extinction) × Time (seconds within CS) ANOVA, including the first 6s (Group 6) or 12s (Groups 12 and 24) of the test session data. The Phase × Time interaction failed to reach significance for any of the 3 groups (F's < 1). We also computed Bayes factors to assess whether the temporal distributions were more consistent with the null hypothesis (affected by Time in CS only) or the alternative hypothesis (affected by Time, Phase or the interaction). The Bayes factors strongly favored the null hypothesis (Group 6: BF01 = 35.0; Group 12: BF01 = 68.8; Group 24: BF01 = 263.1). The temporal distributions suggest that the low recovery observed in Group 24 is in part attributable to temporal rescaling that occurred during extinction, which caused fewer responses to be emitted during the first 12 s of the CS.
Figure 12.
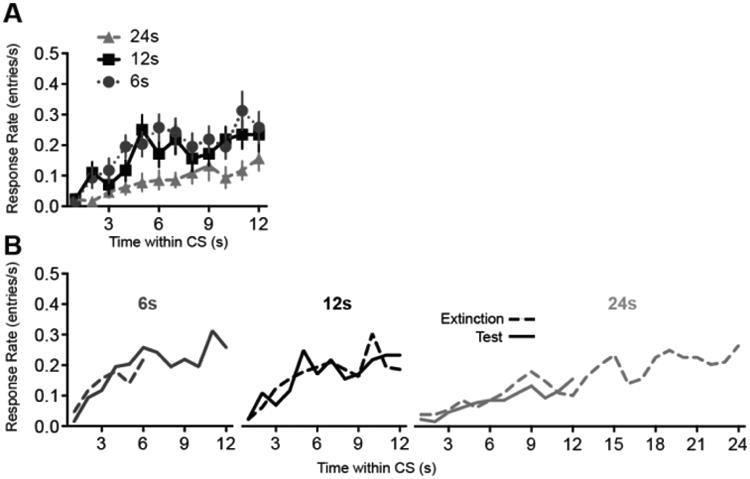
Response timing during the test session of Experiment 2. A, Response rate as a function of time within the CS. B, The test session distributions are superimposed on distributions obtained from the extinction session (extinction trial block 6 for Groups 6 and 12, and block 3 for Group 24). Error bars represent ±1 SEM.
General Discussion
There were three main findings. First, after both CRF training and PRF training, neither within-session extinction nor retention of extinction were driven by cumulative CS exposure. Second, changing the CS duration between training and extinction facilitated within-session extinction. Following CRF in Experiment 1, CSs of both greater and lesser duration than the training CS generated lower initial response rates than did CSs of the same duration as the training CS. Following PRF in Experiment 2, only the group with the longer CS duration showed diminished responding at the start of extinction. Third, after both CRF and PRF training, increasing the CS duration during extinction caused temporal rescaling of CRs, in that CRs occurred later within the CS. This rescaling partially accounted for the effects of extinction CS duration on within-session extinction and on retention of extinction across sessions.
Temporal rescaling during extinction was asymmetric. Lengthening the CS duration caused CRs to migrate toward the end of the extinction CS, whereas we did not detect consistent rescaling when the CS duration was shortened (though in several extinction blocks the average response rate near the end of the short CS was numerically higher than that of the other groups). The asymmetry may be a consequence of the shape of the temporal distributions of CRs. There is a latency of 1-2s before most subjects reach the feeder trough. The CR rate then ramps up as a function of time during the training CS (e.g., Figure 4). As a result, when the CS is shortened during extinction, the peak response rate still occurs at the end of the CS, as it did during training. It is possible that 6s is just not long enough to always see a leftward migration of the highest rate of responding. In contrast, when the CS duration was extended to 24s in extinction, during the initial extinction trials response rate reached asymptote near the end of training CS-US interval (12 s; e.g., Figure 10, top left panel) and then remained at the asymptote for the duration of the CS presentation. As extinction progressed, CRs became more delayed, and the asymptote was not reached until the end of the CS presentation. Thus, extending the CS in extinction shifted timing of CRs, whereas shortening the CS duration to 6s had comparatively little effect on CR timing.
We investigated the possibility that temporal rescaling during extinction was an artifact produced by a decline in response rate. A decline in response rate could, in theory, produce an apparent rightward shift in the onset of CRs or the peak in CRs. However, bootstrap analysis ruled out this explanation by demonstrating that a reduction in the number of responses per trial in extinction was not sufficient to reproduce temporal rescaling. The fact that rescaling was consistently observed only in Group 24, even though all groups exhibited diminished responding in extinction, also argues against the interpretation that rescaling is caused by diminished responding.
Why did temporal rescaling occur? We can envision both temporal and associative accounts for this phenomenon. One possibility is that a temporal map of the expected time of US delivery represents an integration of temporal information from both the training and testing experience (Arcediano, Escobar, & Miller, 2003; Balsam & Gallistel, 2009; Polack, Molet, Miguez, & Miller, 2013; Taylor, Joseph, Zhao, & Balsam, 2014). In this view, during training, rats would learn that pellets should be expected shortly after CS offset. They would also come to expect CS offset to occur 12s after CS onset. During extinction they learn a new expectation of how long the CS will last and integrate this new information with the expectation that the US occurs shortly after CS offset. The integration of this information results in an expectation of the US at the end of the new CS duration. Another possibility is that the new CS duration acquires the ability to control timed CRs through second order conditioning. In this view, CS offset serves as a first-order CS to condition the nominal CS at a new duration. In either case—whether it is an expectation of the US or expectation of CS-offset—CRs rescale to accommodate the changed timing of CS offset. Both accounts lead to the prediction that temporal rescaling will fail to occur if CS offset and reward are uncorrelated during training— for instance, if rewards are delivered prior to CS offset. Alternatively, temporal expectations could be encoded as relative rather than absolute durations with respect to the CS duration and automatically rescale when durations change (Wan, Djourthe, Taylor, & Balsam, 2010). In this case, rescaling should occur during extinction even if CS offset and reward were decorrelated during training.
An associative account of temporal rescaling would draw on the idea that the associability of a cue can be dissociated from its ability to elicit CRs (Le Pelley, 2004; Pearce & Hall, 1980). Although in this study CRs occurred at a higher rate in the later segments of the CS than the earlier segments, it is conceivable that associability was higher at the start than at the end, at least in the long CS groups—for instance, because the early CS segment had previously been reinforced whereas the end had not (Mackintosh, 1975b). Such variations in associability would cause the early segments of the CS to extinguish more rapidly than the later segments. A comparison of Figures 8C and 8D confirms that the first 6s of the 24-s CS indeed extinguished faster than its final 6s, lending some credence to this account.
The rescaling is somewhat surprising given that responding migrated away from the trained CS-US interval rather than away from the non-reinforced CS duration, as might have been expected based the phenomenon of “peak shift” observed in discrimination experiments (Hanson, 1959). However, to our knowledge, peak shift has only been demonstrated in subjects explicitly trained on a discrimination and has not been observed when the only exposure to the nonreinforced cue occurs during extinction (Honig, Thomas, & Guttman, 1959; Rosen & Terrace, 1975). The absence of peak shift in the present and other extinction experiments may provide some insight into the nature of extinction learning. Peak shift has been hypothesized to reflect the learning of partially overlapping gradients of excitation and inhibition (Spence, 1937). The absence of peak shift in the present experiment suggests that massed non-reinforced exposure to a CS is not sufficient to produce significant inhibitory associations, although in other learning paradigms the extinguished cues may become inhibitors (Rescorla, 1997).
Our data are consistent with the idea that within-session extinction and retention of extinction are regulated by distinct processes (Drew et al., 2004; Plendl & Wotjak, 2010; Vurbic & Bouton, 2014). In both CRF and PRF, within-session extinction was speeded by an increase in CS duration during extinction, consistent with other reports (Drew et al., 2004; Haselgrove & Pearce, 2003; Plendl & Wotjak, 2010). For retention of extinction, however, the effects of changing the CS duration differed depending on whether training was CRF or PRF. After CRF training, shortening the CS duration in extinction reduced retention of extinction, whereas after PRF training, lengthening CS duration facilitated retention of extinction. We are hesitant to draw conclusions from this dissociation because extinction proceeded considerably faster after CRF than PRF, meaning that the CRF subjects were overtrained in extinction but the PRF subjects were not. Furthermore, CRF subjects displayed very little responding during the post-extinction test session, which renders the absence of group differences somewhat uninformative. Thus, it is not clear whether the observed differences between CRF and PRF groups in extinction relate to reinforcement schedule per se versus less interesting procedural differences.
We did not obtain support for the hypothesis, advanced in time-based models (Gallistel & Gibbon, 2000; Gibbon & Balsam, 1981), that extinction is driven by cumulative CS exposure. The cumulative exposure account predicts that increases or decreases in CS duration will have symmetric effects on the speed or strength of extinction: increasing CS duration should speed (per-trial) extinction, whereas shortening CS duration should slow (per-trial) extinction. Earlier studies using CRF training failed to support this hypothesis (Bouton et al., 2014; Drew et al., 2004; Plendl & Wotjak, 2010). We asked whether PRF training would favor more temporally-based reward expectations that might make extinction more amenable to a time-based account. Our results, like those of Bouton et al (2014), did not support this hypothesis. After both CRF and PRF training, within-session extinction was speeded by an increase in CS duration, but a decrease in CS duration failed to produce a commensurate slowing of extinction. Our data are consistent with the interpretation of Drew et al. (2004) that that within-session extinction is driven largely by two factors: the number of CS presentations and generalization between the training CS duration and extinction CS duration. That is, within-session extinction accrues as a function of the number of CS presentations, but changes in CS characteristics (duration, in this case) cause generalization decrement and create the appearance of faster extinction.
However, similar to Drew at al. (2004), the generalization decrement account is complicated by asymmetrical effects of changing the CS duration. An increase in CS duration speeded extinction, but a decrease in CS duration did not consistently do so. This asymmetry may be attributable in part to temporal migration of the CR during extinction, which was itself asymmetric: rescaling occurred in the groups experiencing a longer CS duration during extinction but not groups in which the CS duration was the same or shorter during extinction. Because of temporal migration, the response rate early in the CS declined faster in the long CS groups than the short and unchanged CS duration groups. Perhaps as a consequence of this, in PRF (but not CRF) training, group differences in extinction speed were attenuated when response rate was calculated from the final 6s of the CS. In summary, within-session extinction was speeded by extending the CS duration during extinction, and this effect was partially attributable to temporal migration of the CR.
Asymmetries were also observed with respect to retention of extinction. After CRF training retention of extinction was modestly impaired by a reduction in CS duration, but increasing the CS duration failed to enhance retention of extinction. The results replicate those of Drew et al (2004 Experiments 1 and 2), who observed the same asymmetry when the CS duration was doubled or halved during extinction. After PRF training, however, a different asymmetry was observed: an increase in CS duration enhanced retention of extinction, but a decrease in CS duration failed to impair extinction retention. Analysis of CR timing suggests that impaired extinction retention in the PRF Group 24 (CS duration extended in extinction) was explained by temporal rescaling of the CR. During extinction the peak response rate migrated later in the trial, and the migration appeared to be maintained during the test session with the original CS duration. As a result, PRF Group 24 emitted fewer responses during the 12-s CS presentations in the test session.
In summary, our data our incompatible with the hypothesis that extinction is driven by cumulative CS exposure. However, consistent with earlier reports, increasing the CS duration during extinction facilitates the loss of responding. The effect of increasing the CS duration has several components. First, there may be an initial generalization decrement so that the CS of changed duration controls a lower response rate. Additionally, temporal rescaling of the CR to the duration of the extinction CS can also change response rate. In our experiments this was most clear when CS duration was increased and responding was rescaled to the new duration during extinction treatment. Despite the rescaling, Experiment 2 clearly showed that the same number of extinction trials were required to reduce responding equivalently no matter what the duration of the CS during extinction. Furthermore, at least some of the time, changing CS durations may protect the original CS from being fully extinguished resulting in poor retention of the extinction experience. Prolonged exposure therapy is a component of treatment for many anxiety disorders (Craske & Mystkowski, 2006; Levis, 2009) including social anxiety disorder (Anderson et al., 2013), anorexia nervosa (Steinglass et al., 2014) obsessive compulsive disorder (Shikatani et al., 2014) as well as post-traumatic stress disorder (Powers, Halpern, Ferenschak, Gillihan, & Foa, 2010). The current data suggest that temporally extended CS exposures may be less effective at eliminating unwanted responses than are exposures that more closely match the temporal relations experienced during the original learning.
References
- Anderson PL, Price M, Edwards SM, Obasaju MA, Schmertz SK, Zimand E, Calamaras MR. Virtual reality exposure therapy for social anxiety disorder: A randomized controlled trial. Journal of Consulting and Clinical Psychology. 2013;81(5):751–760. doi: 10.1037/a0033559. http://doi.org/10.1037/a0033559. [DOI] [PubMed] [Google Scholar]
- Arcediano F, Escobar M, Miller RR. Temporal integration and temporal backward associations in human and nonhuman subjects. Animal Learning & Behavior. 2003;31(3):242–256. doi: 10.3758/bf03195986. http://doi.org/10.3758/BF03195986. [DOI] [PubMed] [Google Scholar]
- Balsam PD, Gallistel CR. Temporal maps and informativeness in associative learning. Trends in Neurosciences. 2009;32(2):73–78. doi: 10.1016/j.tins.2008.10.004. http://doi.org/10.1016/j.tins.2008.10.004. [DOI] [PMC free article] [PubMed] [Google Scholar]
- Balsam PD, Drew MR, Gallistel CR. Time and Associative Learning. Comparative Cognition & Behavior Reviews. 2010;5:1–22. doi: 10.3819/ccbr.2010.50001. [DOI] [PMC free article] [PubMed] [Google Scholar]
- Bates D, Mächler M, Bolker B, Walker S. Fitting Linear Mixed-Effects Models Using lme4. Journal of Statistical Software. 2015;67(1):1–48. http://doi.org/10.18637/jss.v067.i01. [Google Scholar]
- Bouton ME, Woods AM, Todd TP. Separation of time-based and trial-based accounts of the partial reinforcement extinction effect. Behavioural Processes. 2014;101:23–31. doi: 10.1016/j.beproc.2013.08.006. http://doi.org/10.1016/j.beproc.2013.08.006. [DOI] [PMC free article] [PubMed] [Google Scholar]
- Craske MG, Mystkowski JL. Exposure Therapy and Extinction: Clinical Studies. In: Craske MG, Hermans D, Vansteenwegen D, editors. Fear and learning: From basic processes to clinical implications. Washington: American Psychological Association; 2006. pp. 217–233. http://doi.org/10.1037/11474-011. [Google Scholar]
- Drew MR, Yang C, Ohyama T, Balsam PD. Temporal specificity of extinction in autoshaping. Journal of Experimental Psychology: Animal Behavior Processes. 2004;30(3):163–176. doi: 10.1037/0097-7403.30.3.163. http://doi.org/10.1037/0097-7403.30.3.163. [DOI] [PubMed] [Google Scholar]
- Dudeney JE, Olsen KN, Kehoe EJ. Time-specific extinction and recovery of the rabbit's (Oryctolagus cuniculus) conditioned nictitating membrane response using mixed interstimulus intervals. Behavioral Neuroscience. 2007;121(4):808–813. doi: 10.1037/0735-7044.121.4.808. http://doi.org/10.1037/0735-7044.121.4.808. [DOI] [PubMed] [Google Scholar]
- Gallistel CR. Extinction from a rationalist perspective. Behavioural Processes. 2012;90(1):66–80. doi: 10.1016/j.beproc.2012.02.008. http://doi.org/10.1016/j.beproc.2012.02.008. [DOI] [PMC free article] [PubMed] [Google Scholar]
- Gallistel CR, Balsam PD. Time to rethink the neural mechanisms of learning and memory. Neurobiology of Learning and Memory. 2014;108:136–144. doi: 10.1016/j.nlm.2013.11.019. http://doi.org/10.1016/j.nlm.2013.11.019. [DOI] [PMC free article] [PubMed] [Google Scholar]
- Gallistel CR, Gibbon J. Time, rate, and conditioning. Psychological Review. 2000;107(2):289–344. doi: 10.1037/0033-295x.107.2.289. [DOI] [PubMed] [Google Scholar]
- Gibbon J, Balsam PD. Spreading Association in Time. In: Locurto CM, Terrace HS, Gibbon J, editors. Autoshaping and Conditioning Theory. New York: Academic Press; 1981. pp. 219–253. [Google Scholar]
- Golkar A, Bellander M, Öhman A. Temporal properties of fear extinction—Does time matter? Behavioral Neuroscience. 2013;127(1):59–69. doi: 10.1037/a0030892. http://doi.org/10.1037/a0030892. [DOI] [PubMed] [Google Scholar]
- Guilhardi P, Church RM. The pattern of responding after extensive extinction. Learning & Behavior. 2006;34(3):269–284. doi: 10.3758/bf03192883. [DOI] [PubMed] [Google Scholar]
- Hanson HM. Effects of discrimination training on stimulus generalization. Journal of Experimental Psychology. 1959;58:321–334. doi: 10.1037/h0042606. [DOI] [PubMed] [Google Scholar]
- Harris JA, Patterson AE, Gharaei S. Pavlovian conditioning and cumulative reinforcement rate. Journal of Experimental Psychology: Animal Learning and Cognition. 2015;41(2):137–151. doi: 10.1037/xan0000054. http://doi.org/10.1037/xan0000054. [DOI] [PubMed] [Google Scholar]
- Haselgrove M, Pearce JM. Facilitation of extinction by an increase or a decrease in trial duration. Journal of Experimental Psychology: Animal Behavior Processes. 2003;29(2):153–166. doi: 10.1037/0097-7403.29.2.153. http://doi.org/10.1037/0097-7403.29.2.153. [DOI] [PubMed] [Google Scholar]
- Haselgrove M, Aydin A, Pearce JM. A Partial Reinforcement Extinction Effect Despite Equal Rates of Reinforcement During Pavlovian Conditioning. Journal of Experimental Psychology: Animal Behavior Processes. 2004;30(3):240–250. doi: 10.1037/0097-7403.30.3.240. http://doi.org/10.1037/0097-7403.30.3.240. [DOI] [PubMed] [Google Scholar]
- Honig WK, Thomas DR, Guttman N. Differential effects of continuous extinction and discrimination training on the generalization gradient. Journal of Experimental …. 1959 doi: 10.1037/h0048484. [DOI] [PubMed] [Google Scholar]
- Hovland CI. The generalization of conditioned responses. III. Extinction, spontaneous recovery, and disinhibition of conditioned and of generalized responses. Journal of Experimental Psychology. 1937;21(1):47–62. http://doi.org/10.1037/h0055714. [Google Scholar]
- Jeffreys H. The Theory of Probability. OUP; Oxford: 1998. [Google Scholar]
- Kelley K. Confidence intervals for standardized effect sizes: Theory, application, and implementation. Journal of Statistical Software 2007 [Google Scholar]
- Le Pelley ME. The role of associative history in models of associative learning: A selective review and a hybrid model. The Quarterly Journal of Experimental Psychology: Section B. 2004;57(3):193–243. doi: 10.1080/02724990344000141. http://doi.org/10.1080/02724990344000141. [DOI] [PubMed] [Google Scholar]
- Levis DJ. The Prolonged Cs Exposure: Techniques Of Implosive (Flooding) Therapy. In: Fisher JE, ODonohue WT, editors. General Principles and Empirically Supported Techniques of Cognitive Behavior Therapy. 2009. [Google Scholar]
- Mackintosh NJ. A theory of attention: Variations in the associability of stimuli with reinforcement. Psychological Review. 1975a;82(4):276–298. http://doi.org/10.1037/h0076778. [Google Scholar]
- Mackintosh NJ. A theory of attention: Variations in the associability of stimuli with reinforcement. Psychological Review. 1975b;82(4):276–298. http://doi.org/10.1037/h0076778. [Google Scholar]
- Ohyama T, Gibbon J, Deich JD, Balsam PD. Temporal control during maintenance and extinction of conditioned keypecking in ring doves. Animal Learning & Behavior. 1999;27(1):89–98. http://doi.org/10.3758/BF03199434. [Google Scholar]
- Pearce JM, Hall G. A model for Pavlovian learning: Variations in the effectiveness of conditioned but not of unconditioned stimuli. Psychological Review. 1980;87(6):532–552. http://doi.org/10.1037/0033-295X.87.6.532. [PubMed] [Google Scholar]
- Pinheiro J, Bates D. Mixed-Effects Models in S and S-PLUS. New York, NY: Springer Science & Business Media; 2010. http://doi.org/10.1007/978-1-4419-0318-1. [Google Scholar]
- Plendl W, Wotjak CT. Dissociation of within- and between-Session Extinction of Conditioned Fear. Journal of Neuroscience. 2010;30(14):4990–4998. doi: 10.1523/JNEUROSCI.6038-09.2010. http://doi.org/10.1523/JNEUROSCI.6038-09.2010. [DOI] [PMC free article] [PubMed] [Google Scholar]
- Polack CW, Molet M, Miguez G, Miller RR. Associative structure of integrated temporal relationships. Learning & Behavior. 2013;41(4):443–454. doi: 10.3758/s13420-013-0119-5. http://doi.org/10.3758/s13420-013-0119-5. [DOI] [PMC free article] [PubMed] [Google Scholar]
- Powers MB, Halpern JM, Ferenschak MP, Gillihan SJ, Foa EB. A meta-analytic review of prolonged exposure for posttraumatic stress disorder. Clinical Psychology Review. 2010;30(6):635–641. doi: 10.1016/j.cpr.2010.04.007. http://doi.org/10.1016/j.cpr.2010.04.007. [DOI] [PubMed] [Google Scholar]
- Rescorla RA. Response inhibition in extinction. The Quarterly Journal of Experimental Psychology. 1997 http://doi.org/10.1080/713932655.
- Rescorla RA, Wagner AR. In: A theory of Pavlovian conditioning: Variations in the effectiveness of reinforcement and nonreinforcement. Black AH, Prokasy WF, editors. New York: Appleton-Century-Crofts; 1972. [Google Scholar]
- Rosen AP, Terrace HS. On the Minimal Conditions for the Development of a Peak-Shift and Inhibitory Stimulus Control1. Journal of the Experimental Analysis of …. 1975 doi: 10.1901/jeab.1975.23-385. http://doi.org/10.1901/jeab.1975.23-385/abstract. [DOI] [PMC free article] [PubMed]
- Rouder JN, Morey RD, Speckman PL, Province JM. Default Bayes factors for ANOVA designs. Journal of Mathematical Psychology. 2012;56(5):356–374. http://doi.org/10.1016/j.jmp.2012.08.001. [Google Scholar]
- Rouder JN, Speckman PL, Sun D, Morey RD, Iverson G. Bayesian t tests for accepting and rejecting the null hypothesis. Psychonomic Bulletin & Review. 2009;16(2):225–237. doi: 10.3758/PBR.16.2.225. http://doi.org/10.3758/PBR.16.2.225. [DOI] [PubMed] [Google Scholar]
- Shikatani B, Vas SN, Goldstein DA, Wilkes CM, Buchanan A, Sankin LS, Grant JE. Individualized Intensive Treatment for Obsessive-Compulsive Disorder: A Team Approach. Cognitive and Behavioral Practice. 2014 http://doi.org/10.1016/j.cbpra.2014.09.002.
- Spence KW. The differential response in animals to stimuli varying within a single dimension. Psychological Review. 1937;44(5):430–444. http://doi.org/10.1037/h0062885. [Google Scholar]
- Steiger JH. Beyond the F Test: Effect Size Confidence Intervals and Tests of Close Fit in the Analysis of Variance and Contrast Analysis. Psychological Methods. 2004;9(2):164–182. doi: 10.1037/1082-989X.9.2.164. http://doi.org/10.1037/1082-989X.9.2.164. [DOI] [PubMed] [Google Scholar]
- Steinglass JE, Albano AM, Simpson HB, Wang Y, Zou J, Attia E, Walsh BT. Confronting fear using exposure and response prevention for anorexia nervosa: A randomized controlled pilot study. International Journal of Eating Disorders. 2014;47(2):174–180. doi: 10.1002/eat.22214. http://doi.org/10.1002/eat.22214. [DOI] [PMC free article] [PubMed] [Google Scholar]
- Taylor KM, Joseph V, Zhao AS, Balsam PD. Temporal maps in appetitive Pavlovian conditioning. Behavioural Processes. 2014;101:15–22. doi: 10.1016/j.beproc.2013.08.015. http://doi.org/10.1016/j.beproc.2013.08.015. [DOI] [PMC free article] [PubMed] [Google Scholar]
- Vurbic D, Bouton ME. The Wiley Blackwell Handbook of Operant and Classical Conditioning. Oxford, UK: John Wiley & Sons, Ltd; 2014. A Contemporary Behavioral Perspective on Extinction; pp. 53–76. http://doi.org/10.1002/9781118468135.ch3. [Google Scholar]
- Wan M, Djourthe M, Taylor KM, Balsam PD. Relative temporal representations in Pavlovian conditioning. Behavioural Processes. 2010;83(2):154–161. doi: 10.1016/j.beproc.2009.11.012. http://doi.org/10.1016/j.beproc.2009.11.012. [DOI] [PMC free article] [PubMed] [Google Scholar]
- Ward RD, Gallistel CR, Balsam PD. It's the information! Behavioural Processes. 2013;95:3–7. doi: 10.1016/j.beproc.2013.01.005. http://doi.org/10.1016/j.beproc.2013.01.005. [DOI] [PMC free article] [PubMed] [Google Scholar]
- Winter B. Linear models and linear mixed effects models in R with linguistic applications. arXiv org 2013 Aug 26; [Google Scholar]


