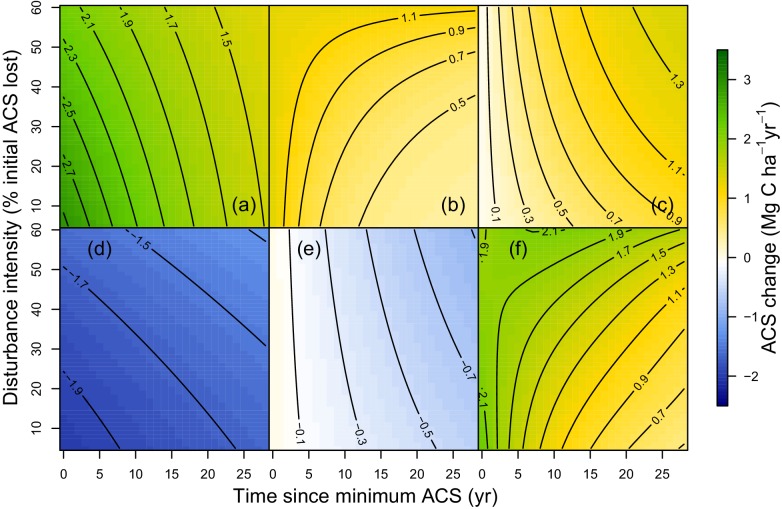
Figure 3. Predicted effect of disturbance intensity on ACS changes along time in an Amazonian-average plot.
(a) Survivors’ ACS growth. (b) New recruits’ ACS. (c) Recruits’ ACS growth. (d) Survivors’ ACS loss. (e) Recruits’ ACS loss. (f) Net ACS change. The net ACS change is the sum of all five ACS changes. ACS changes were calculated with all parameters set to their maximum-likelihood value and covariates (except standardized disturbance intensity ) set to 0. Time since minimum ACS varies from 0 to 30 year (i.e. the calibration interval) and disturbance intensity ranges between 5% and 60% of initial ACS loss.

