

Abstract
Many important experiments in proteomics including protein digestion, enzyme substrate screening, enzymatic labeling, etc., involve the enzymatic reactions in a complex system where numerous substrates coexists with an enzyme. However, the enzyme kinetics in such a system remains unexplored and poorly understood. Herein, we derived and validated the kinetics equations for the enzymatic reactions in complex system. We developed an iteration approach to depict the enzymatic reactions in complex system. It was validated by 630 time-course points from 24 enzymatic reaction experiments and was demonstrated to be a powerful tool to simulate the reactions in the complex system. By applying this approach, we found that the ratio of substrate depletion is independent of other coexisted substrates under specific condition. This observation was then validated by experiments. Based on this striking observation, a simplified model was developed to determine the catalytic efficiencies of numerous competing substrates presented in the complex enzyme reaction system. When coupled with high-throughput quantitative proteomics technique, this simplified model enabled the accurate determination of catalytic efficiencies for 2369 peptide substrates of a protease by using only one enzymatic reaction experiment. Thus, this study provided, in the first time, a validated model for the large scale determination of specificity constants which could enable the enzyme substrate screening approach turned from a qualitative method of identifying substrates to a quantitative method of identifying and prioritizing substrates. Data are available via ProteomeXchange with identifier PXD004665.
Enzymes play a key role in nearly all signal transduction cascades and metabolic pathways. Overexpression and/or dysregulation of enzymes result in many diseases, thus providing numerous drug targets for multiple therapeutic areas (1–3). Identification and further prioritizing new substrates are important for the study of the enzymology of the selected enzymes and the next generation of drug targets (4). Because of the well-developed enzyme kinetics theories and assay methods, the screening for optimal substrates is often performed by using the in vitro enzymatic reaction system involving an enzyme and a substrate (5–8). However, such approach requires purified substrate and large amounts of material. There is an increasing interest in using a pool of different substrates for substrate screening. Highly complex substrate libraries including the synthetic oligonucleotide or peptide mixture (9, 10), the peptide library derived from the digestion of proteins in total cell lysate (11, 12) and the proteins in total cell lysate (13, 14) were used for substrate screening. In such experiments, an enzyme was incubated with numerous competing substrates for enzymatic reaction which would generate numerous different products. The state of art high throughput assay approaches like mass spectrometry-based proteomics are able to monitor the changing of substrates or products during the course of this type of complex enzymatic reactions. As a result, numerous new substrates could be identified by such substrate screening approach (9–15). However, prioritizing new substrates is usually not achieved because the kinetic constants were typically not determined due to the lacking of well-studied kinetics theory for such a complex reaction system. Because the high specificity and efficiency of the enzymatic reactions, enzyme is also an important tool for biological studies. Especially the genomics and proteomics techniques are enabled by the application of some well characterized enzymes as the tool to selectively cleave the sites on the sequences (16, 17). The enzymatic reactions for such applications are also often performed in the complex system where numerous competing substrates present. For example, the digestion of proteome sample in shot-gun proteomics involves the incubation of a protease with all proteins presented in total cell lysate (18), the enzymatic labeling of peptides for quantitative proteomics involves the incubation of an enzyme with all peptides derived from a proteome (19, 20). Unfortunately, the kinetics model to describe the enzymatic reactions in such a complex system is still lacking.
The classic Michaelis-Menten model derived one century ago (21) is still routinely used to characterize the catalytic power and selectivity of enzymes. It should be mentioned that the equations derived from the classic model are usually derived and validated for the uni-uni enzymatic reaction system involving only one enzyme and one substrate. Application of these equations to the complex system without serious consideration of the competitive binding of the coexisted numerous alternative substrates is tend to draw wrong conclusion or obtain inaccurate results. For example, a conclusion that high-abundance proteins in a protein mixture could be digested earlier than low abundance proteins based on the kinetic equation derivation (22) was later proved to be incorrect by experiments (23). Recently, pseudo-first-order kinetic equations have been applied to determine hundreds of catalytic efficiencies (i.e., specificity constants (kcat/Km)) of substrates by monitoring the appearance of the cleaved peptides in lysate as a function of time after a protease was added using LC-MS/MS (24, 25). This is truly a high throughput approach to prioritize enzyme substrates. It should be noted that the enzymatic reaction in a simple system could be considered as pseudo-first-order reaction only when the reaction is taken place at low substrate concentrations meeting [S] << Km. However, the protein concentration was not given in their studies. More importantly, pseudo-first-order kinetic equation has never been derived and validated for the complex system as above. Clearly direct application of this equation without knowledge of its applicable conditions is not scientifically rigorous and the catalytic efficiencies determined in their studies could be inaccurate. To prevent falsely or improperly using of kinetic equations, it is urgent to systematically investigate the enzymatic kinetics in the complex system.
The derivation of theoretic models to depict the enzymatic reactions in the complex system is challenging. The obtaining of rate equation for the enzymatic reaction of each coexisted substrate is quite easy. However, solution solving of the resulting differential equation set is extremely difficult. In this study, we proposed an iteration approach to solve this problem. The detailed process for implementing this approach is outlined in Fig. 1A. By this way, the free enzyme concentration, the reaction rate for each substrate, the free concentration for each substrate and the portion of substrate consumed for any time point during the reaction could be predicted, which enabled the plotting of corresponding progress curves. It was validated by 630 time-course points from 24 enzymatic reaction experiments with various substrate concentrations. In addition, we found that the ratio of substrate depletion was independent of other coexisted substrates when the term is insignificant, which resulted in the derivation of a simplified model to depict such system. When a high-throughput proteomics approach was applied to monitoring the Glu-C catalyzed hydrolysis of a peptide library, the catalytic efficiencies for 2369 peptide substrates were successfully determined by using this model. A feature of this model is that it enables the accurate determination of the catalytic efficiencies for numerous competing substrates in one reaction system.
Fig. 1.

Prediction of progress curves in a complex enzymatic system where multiple competing substrates coexist with a single enzyme by the iteration approach. (A), Computation workflow for the iteration approach; The computed progress curves of (B) free enzyme concentration, (C) substrate reaction rates and (D) percentage of substrates consumed during the course of enzymatic reactions in a system with five synthetic peptides coexisted with trypsin. The initial concentrations of the five peptides were 50 μm. Solid lines represent predicted results based on the iteration approach, and dots represent observed values under the same condition. All values represent the average ± one standard derivation from three replicates.
MATERIALS AND METHODS
Validation of Kinetics Models Using Trypsin Catalyzed Hydrolysis of Synthetic Peptide Mixture
All the five synthetic peptides (supplemental Table S1) (1 mm in reaction buffer) are mixed with the ratio of 1:1:1:1:1. Different volumes of the peptide mixture were added to 1.5 ml tube, and then the reaction buffer (HEPES, pH 8.09) was added until the reaction volume reached 500 μl. In this way, the reaction systems with different total concentrations were obtained (30, 50, 100, and 200 μm for each peptide). All the mixtures were preheated at 37 °C, and then 0.1 μg or 0.15 μg Trypsin was added into the mixtures, with the final enzyme concentration of 0.0083 or 0.01245 μm. The mixture was incubated at 37 °C for enzymatic reaction, while the same aliquots (150 μl) were taken from the mixture after the reaction of 5 min, 10 min and 15 min, and then 1 μl formic acid (10%, v/v) was added to stop the hydrolytic reaction. The obtained samples were centrifuged (25,000 × g, 3 min, 20 °C) and analyzed immediately or stored at −30 °C.
For the investigation of the effect of the concentration of a competing substrate, the enzymatic reactions were performed as following. The kinetically best and worst substrates (The kinetically best peptide: (Ac)ALRSIYSDR; The kinetically worst peptide: FLKSALSGHLEK, see supplemental Table S1) from the five synthetic peptides were selected, and initial samples were prepared by adding the other four peptides fixed at 50 μm level as targeted substrates, the selected substrates were then added into the system with different mole concentration ratios to the fixed concentration (1:1, 2:1, 4:1, 10:1, 20:1, and 50:1), i.e. 50, 100, 200, 500, 1000, and 2500 μm for the selected peptide, respectively. All the reaction volumes of samples were adjusted to 500 μl by adding reaction buffer. After the addition of 0.15 μg trypsin, the samples were incubated at 37 °C for the reaction of 10 min, and then 150 μl aliquots were taken out and acidified with FA. All the samples were centrifuged (25,000 × g, 3 min, 20 °C) and analyzed or stored at −30 °C. For accurate quantification, samples with substrate concentration of 1000 and 2500 μm were further 10-fold diluted and analyzed once again.
For the investigation of the dependence of the enzymatic reactions on the , the experiments were performed as followings. Only one peptide ((Ac)ALRSIYSDR) was fixed to be 500 μm in the original reaction system with the concentration of the other four peptides to be the same of 50 μm. The volume of the original reaction was 500 μl, and series of dilutions (0, 5, 10, 15, 20, 25, and 30-fold, respectively) of the original solution were performed. And the final concentration of enzyme was fixed to be 0.01245 μm after addition of a different amount of trypsin. After incubated at 37 °C for 5 and 10 min, three-tenths of the reaction volumes were taken (for instance, when the original reaction system was diluted 5-fold, 2.5 ml, and 750 μl of the sample should be taken from the mixture), acidified, lyophilized, and redissolved with 150 μl reaction buffer. All the samples were centrifuged (25,000 × g, 3 min, 20 °C) and analyzed immediately or stored at −30 °C.
Above samples were analyzed by high pressure liquid chromatography (HPLC)1 using a C18 column (150 × 4.6 mm, 3.5 μm). The flow rate was 1 ml/min, and the peptides were detected at 214 nm. Solvent A consisted of 0.1% (v/v) trifluoroacetic acid (TFA) in H2O. Solvent B consisted of 0.1% (v/v) TFA in acetonitrile. A sample volume of 50 μl was injected. The gradient elution of the peptide mixtures was started with 5% B (0 min), then linearly increased to 18% B (0 to 15 min), 20% B (15 to 20 min), 30% B (20 to 23 min), 100% B (23 to 24 min), hold for 3 min (24 to 27 min), then decreased to 5% B (27 to 28 min) and hold for 2 min 5% B (28 to 30 min).
Large-scale Determination of Catalytic Efficiencies of Glu-C Substrates by Quantitative Proteomics
The Glu-C peptide substrate library were obtained by digestion of proteins in a cell lysate by trypsin. The preparation of protein samples from Jurkat cell lysate was performed according to Bian et al. (13). The obtained protein samples (1 mg) were dissolved in 1 ml of denaturing buffer (pH 8.0) containing 8 m Urea and 50 mm Tris-HCl. The disulfide bonds of protein were opened with the addition of 20 μl of 50 mm DTT, and incubated for 1 h at 56 °C. Then 40 μl of 50 mm IAA was added and the solution was incubated for 40 min at room temperature in the dark. After that, the mixture was diluted 8-fold with 50 mm Tris-HCl (pH 8.0) and incubated for 16–20 h at 37 °C with trypsin at an enzyme/substrate ratio of 1:20 (w/w) to produce a tryptic digest. Finally, the tryptic peptide samples were desalted with homemade C18 solid-phase extraction (SPE) column, lyophilized, and all the samples were then stored in the freezer at −30 °C for further use.
The enzyme kinetics experiments were then performed by incubating the obtained tryptic peptides with Glu-C for different reaction times. The tryptic digest (50 μg) was dissolved in 4 ml of buffer (pH 8.09) containing 50 mm HEPES-NaOH. Glu-C (16 μg) was added for hydrolysis at 37 °C. After digested for 30 and 60 min, aliquots (1.6 ml) of samples were removed from the reaction tube respectively. To prevent the further digestion, formic acid (10 μl) was added to drop the pH of the mixture below 2. Another sample was prepared as the internal standard with the addition of 40 μg Glu-C and incubated at 37 °C for 20 h. Then, the three samples above were desalted by SPE column, lyophilized, dissolved in HEPES-NaOH (200 μl, pH 8.09) and labeled with light, intermediate and heavy dimethyl, respectively for quantitative proteomics analysis (supplementary Note S3).
The quantified Glu-C substrate peptides can be described as P1-Xn-P1′ (P1 and P1′ are the cleavage sites at the N- and C termini of the peptides), the sequence surrounding the peptide can be described as Xa-P2-P1-Xn-P1′-P2′-Xb′ after mapping to their parent protein in the sequences database, respectively. As the peptide substrate library was first generated by trypsin and then incubated with Glu-C, cleavage sites of P2 and P1′ positions could be either K/R or D/E. For all the identified peptides, only the peptides with cleavage site sequences of X4-P(D/E)-X4′ were chosen as the final quantified Glu-C substrates. The simplified model was applied to obtain the corresponding catalytic efficiencies for such peptides. Sequence logos were automatically generated by the WebLogo (http://weblogo.berkeley.edu/logo.cgi) (26).
Raw Data Repository
All mass spectrometry proteomics data have been deposited to the ProteomeXchange Consortium (27) via the PRIDE partner with the data set identifiers PXD004665 (Jurkat 2D-LC-MS/MS).
RESULTS
Theoretical Models to Simulate the Enzyme-catalyzed Reactions in a Complex System
In a complex system, numerous substrates with different concentrations coexist with an enzyme, therefore each substrate will compete with other substrates to form an enzyme-substrate complex. Thus, the free enzyme concentration [E]free could be determined as (see supplementary Note S1)
| (Eq. 1) |
Clearly the [E]free depends on the Michaelis constants (Kmx) and concentrations [Sx] of all the substrates in the system. According to steady-state assumption which is used to derive the classic Michaelis-Menten (M-M) equation, the rate vi for the consumption of the substrate Si in the complex system could be derived as:
| (Eq. 2) |
Inserting Equation (1) into (2) we get
| (Eq. 3) |
It can be observed that the vi depends on the total enzyme concentration [E]tot, its own kinetic constants (kcati, kmi) and concentration [Si], the number of coexisted substrates (n) and their Michaelis constants (Kmx) and concentrations ([Sx]).
During the course of enzyme-catalyzed reactions in the same pot, vi is not constant as the substrates will be gradually consumed which resulted in the decrease of substrate concentrations. To determine the portion or amount of a substrate consumed after reaction for a given time (t), the integration of Equation (3) should be performed. However, this is very difficult because vi depends on the concentrations of all the substrates presented in the system. Instead, we proposed an iteration approach using above equations to determine the portion of each substrate consumed after reaction for a given time in a given system where the initial concentrations and the kinetic constants for all the substrates are known (see Fig. 1A, supplementary Note S2). In addition, the free enzyme concentration, the reaction rates, the substrate concentrations and the portion of substrates consumed after reacted for a given time can all be determined. Therefore, this approach is very useful to simulate the progress of enzymatic reactions in a complex system.
If the concentration of substrates in the system are very low to meet ≪ 1, then the free enzyme concentration equal proximately to its total concentration ([E]free≈[E]tot) according to Equation (1). Under this condition, Equation (3) could be simplified as
| (Eq. 4) |
Surprisingly, the rate for the consumption of a substrate in the complex system depends only on its own kinetic constants and concentration, while independent of other coexisted substrates. Clearly the reaction for each substrate follow the first order kinetics under this condition. Integration of above equation, we get the expression for the portion of substrates consumed (pi) as a function of reaction time:
| (Eq. 5) |
Where Pi,∞ is the final product concentration when the substrate i is almost completely consumed. Equation (5) indicates the catalytic efficiency () for any competing substrate could be determined if the portion of substrate consumed (pi) for a given reaction time could be experimentally measured.
The Iteration Approach Allows Accurate Description of the Enzymatic Process in a Complex System
Trypsin catalyzed hydrolysis is known to strictly conform to Michaelis-Menten kinetics (28). To validate the proposed models, we synthesized five peptides with only one trypsin cleavage site. The kinetic constants (kcat, Km) of these substrate peptides (see supplemental Table S1) were determined separately by using classic method where only one peptide was incubated with trypsin for the reaction (29). These substrate peptides were found to have various kinetic constants. (Ac)ALRSIYSDR represents the kinetically best peptide ( = 0.331 s−1μm−1) whereas FLKSALSGHLEK represents the kinetically worst peptide ( = 0.0129 s−1μm−1). When these five peptides were present simultaneously with trypsin in the same pot, complex enzyme-catalyzed reactions occurred. Because the kinetic constants for these peptides were determined, the progress curves for the trypsin-catalyzed cleavage of the five peptides could be predicted by the iteration approach (Fig. 1B–1D, supplemental Fig. S1). It can be seen that the concentrations for these substrate peptides decreased while those for product peptides increased along with the reaction proceeded (Fig. 1D, supplemental Fig. S1). The free enzyme concentration increased during the course of reaction because the decreasing of substrate concentration resulted in lower concentration of enzyme-substrate complex (Fig. 1B). The reaction rates also decreased with the decreasing of substrate concentration (Fig. 1C). The percentages of substrate peptides consumed for a given time could also be predicted (Fig. 1D). It is amazing that so many time-course parameters could be plotted by this approach. Clearly this iteration approach, if it is valid, allows the description of the time course of the enzyme catalyzed reactions and would be a powerful tool to understand the enzyme kinetics in a complex system. It is impractical to experimentally determine the free enzyme concentration and the reaction rates for each time point while it is quite easy to determine the substrate concentrations which allow the determination of substrate consumed. Therefore, we valid the iteration approach by comparing the predicted and the experimentally determined values for the percentages of the substrates consumed during an enzyme-catalyzed reaction system.
In the first group of the experiments, enzymatic reaction experiments with equal initial concentration of 30 μm, 50 μm, 100 μm, and 200 μm for each substrate peptides in the mixture and two different concentrations of trypsin (0.0083 and 0.01245 μm) were performed. For each experiment, an aliquot of sample was removed from the reaction tube after reaction for 5, 10, and 15 min and analyzed by HPLC with UV detection. The substrate peptides can be well resolved by HPLC (A representative chromatogram is given in supplemental Fig. S2) which allowed accurate quantification of substrate peptides. Thus, the fractions of each substrate peptide consumed during the enzymatic reactions were determined experimentally. Totally, 24 time-course points for each substrate peptides (three time points for each experiment of eight experiments) were obtained. Comparison of the experimentally observed values with those of the predicted values by iteration approach are given in Fig. 2A–2E. It can be seen that the predicted data correlated very well with the observed data for all the five peptide substrates with correlation coefficient over 0.97 and slope around 1. This means the iteration approach can accurately predict the percentage of consumed substrates. We performed an additional experiment with initial concentration of 50 μm for each substrate peptides and determined the values for 7 time points (Fig. 1D). It's not surprise that all the determined values are located very close on the predicted curves for the enzymatic reactions.
Fig. 2.

Plots of all the observed ratio of substrate consumed against their respective predicted values based on the iteration approach. (colors: ●●●● [E] = 0.0083 μm, [S1,2,3,4,5] = 30 μm, 50 μm, 100 μm, 200 μm, respectively; ●●●● [E] = 0.01245 μm, [S1,2,3,4,5] = 30 μm, 50 μm, 100 μm, 200 μm, respectively), (A–E) show the correlation analysis of the observed and predicted ratio for the five peptide substrates coexisted in the mimetic complex systems (See data in supplemental Table S2); (F), summational correlation analysis of the five peptide substrates, 630 time course points in 32 enzymatic reaction experiments. The observed values show a linear dependence on the predicted values (R2 = 0.978, y = 1.014 × −0.25).
In a complex system, an enzyme often coexists with numerous competing substrates of different abundance. We therefore performed another group of experiments to investigate the effect of substrate abundance on the progress of enzyme catalyzed reactions. The substrate mixtures were prepared by keeping four peptides the same concentration while increasing the concentration of one selected substrates with the concentration ratios of 1:1, 2:1, 4:1, 10:1, 20:1, and 50:1 compared with others, respectively. After reaction for 10 min, aliquots of the samples were removed for HPLC analysis. It was found that the relative consumption of the peptide substrates decreased with the increasing concentration of selected peptides, which was very similar to the trends predicted by the iteration approach (Fig. 3). This is because the high concentration of a substrate will result in low concentration of free enzyme according to Equation (1), and thus leaded to the decreasing of reaction rates for all substrates including itself according to Equation (3). Such substrate inhibition effect is more remarkable for the substrate with low Km because of the big value of (see supplemental Table S3.1 and Table S3.2).
Fig. 3.

The competitive inhibition effects with the increasing of one selected substrate concentration. (A), Peptide 4 and (B) Peptide 5. Geometric shapes indicate experimental observations; solid lines represent predicted results based on the iteration approach. The concentrations of the other four peptides were all 50 μm. The concentration of enzyme was fixed to 0.01245 μm in all the reaction systems. All observed values represent the average ± one standard derivation from three replicate experiments.
It can be seen from Equation (3) that is an important term affecting the reaction rate. The value of this term could be decreased by simply diluting the substrate solution prior to reaction. Our iteration approach predicted that the percentages of substrates consumed for a given reaction time increased with the dilution, while they kept almost constant when the solution was further diluted to make insignificant (Fig. 4). To validate this prediction, we performed the third part of the experiments. The reaction mixture with five peptide substrates ((Ac)ALRSIYSDR: 500 μm; other peptides: 50 μm) was chosen, and serial dilutions (0, 5, 10, 15, 20, 25, 30 folds to reach = 3.138, 0.628, 0.314, 0.209, 0.157, 0.126 and 0.105, respectively) of the mixture were performed. After enzymatic reaction for 10 min, the samples were removed for HPLC analysis. It was found the relative consumption of the substrate peptides increased with the dilution folds in a general trend (see Fig. 4). However, the values kept almost constant when value was under 0.2. Above results are highly consistent with that predicted by the iteration approach (Fig. 4).
Fig. 4.
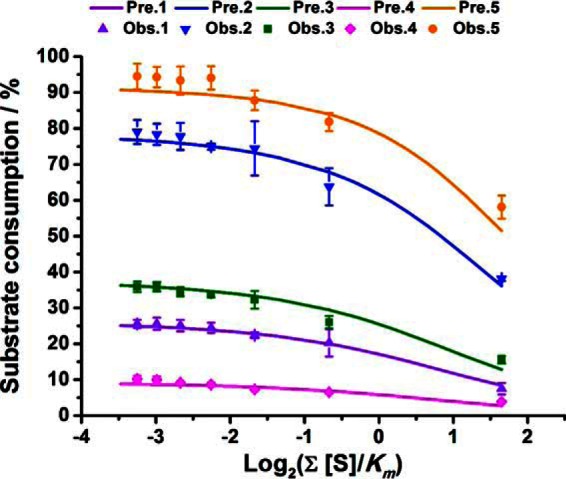
The percentages of the peptide substrates consumed in the reaction system as the function of . Geometric shapes indicate experimental observations; solid lines represent simulated results based on the iteration approach. The original reaction volume was 500 μl, detailed peptide information was listed in supplemental Table S1, and the concentrations of peptides 1 to 4 were 50 μm, while 500 μm for peptide 5. Different values of were achieved by dilution of the original reaction solution. The enzyme concentration was fixed to 0.01245 μm in all the reaction systems. All observed values represent the average ± one standard derivation from three replicates.
In total, we have performed 24 enzymatic reaction experiments with various substrate concentrations and obtained 630 time-course data for these experiments (see supplemental Table S4). As shown in Fig. 2F, the experimental determined values are highly consistent with the predicted ones for the fraction of substrates consumed (R2 = 0.978, y = 1.014 × −0.25). Among all these dataset, 412 (65.4%) pairs of time course data with relative deviation of the observed values from the predicted ones were less than 10%, 154 (24.4%) were around 10 to 20%. Although only 37 (5.9%) were around 20 to 30% and 27 (4.3%) were above 30%. More importantly, the trends predicted by the iteration approach including the progress curves for the fraction of consumed substrates, the effect of the concentration of a competing substrate on the enzymatic reactions and the dependence of the enzymatic reactions on the were all validated experimentally. Clearly the iteration approach allowed accurate description of the enzymatic process in a complex system.
The Simplified Model Allows Determination of Catalytic Efficiencies of Substrates in a Complex System
We then investigate when the simplified model in Equation (5) could be used to simulate the enzymatic reactions in a complex system. For all the enzymatic experiments performed, this simplified model was also applied to predict the fraction of substrates consumed and the obtained results are summarized in supplemental Table S4. The dependence of the linear regression slopes for the correlation of predicted and observed values on the is given in Fig. 5A. It can be seen that the values predicted by the iteration approach are consistent to the determined values for all these experiments with various values of (The slopes are all close to 1). However, consistency for the prediction by the simplified model were only obtained when is insignificant. And the predicted values were always higher than the observed ones for those with bigger values of (The slopes are much smaller than 1). The reason for this deviation is because [E]free ≪ [E]tot when is insignificant and thus replacing [E]free with [E]tot in Equation (2) to derive Equation (4) is improper. Because the slopes are only less than 3% away from 1 when the <0.314, it is quite safe to conclude that the simplified model allows accurate description of the enzymatic process in a complex system with < 0.2. This condition could be easily achieved by diluting the substrate mixture. We found that the fraction of substrates consumed kept almost constant when the substrate mixture was diluted to make insignificant as illustrated in Fig. 4. This confirmed that the fractions of substrates consumed for a given reaction time are independent of the substrate concentrations under this condition.
Fig. 5.

The dependence of prediction accuracy on by the proposed models. (A), Slopes for linear regression analysis of the observed and predicted fraction of substrate consumed (See correlation plots in supplemental Table S4); (B), Slopes for linear regression analysis of the catalytic efficiencies determined by classic method and the simplified model (See correlation plots in supplemental Fig. S3).
Compared with the iteration approach, a significant advantage of the simplified model is that it offers an approach to simultaneously determine the catalytic efficiencies of enzyme for all the competing substrates presented in a complex system. According to Equation (5), the catalytic efficiency for each substrate could be determined based on the portion of substrate consumed at a given time for a specific substrate and the total enzyme concentration. The total enzyme concentration is always known and the portion of substrates consumed could be determined by different assay methods and so the catalytic efficiencies could be easily determined. The portion of peptide substrates consumed in the enzymatic experiments with different by serial dilutions were already determined experimentally (Fig. 4). We then applied the simplified model to calculate the catalytic efficiencies of the five peptide substrates according to the data obtained for those experiments. It was found that the simplified model could accurately determine the values of for the five substrate peptides when was insignificant (Fig. 5b, Supplemental Fig. 3) which was consistent with the facts that this model was able to accurately describe the enzymatic reaction under this condition. For example, when <0.2, the computed values were consistent with those determined by the classic Lineweaver-Burk plot analysis with the slope of 0.961 ( = 0.157, dilution factor of 20, R2 = 0.966) and 0.926 ( = 0.105, dilution factor of 30, R2 = 0.998), but when >0.2, the computed values were much smaller than those determined by classic method. These results suggested that the simplified model was reliable for the calculation of catalytic efficiency only when the satisfaction of <0.2. It should be noted that the catalytic efficiencies for the five peptide substrates were determined based on one enzymatic experiment by incubating all the substrates with the enzyme, whereas the classic method with Lineweaver-Burk plot analysis requires one experiment for each substrate. Thus, this new method is best fitted to determine the catalytic efficiencies for many substrates in high throughput.
LC-MS Analysis Allows Large-scale Determination of Catalytic Efficiencies
LC-MS-based approach is a powerful tool for identifying and quantifying hundreds to thousands of analytes in complex mixtures. When this tool is applied to determine the portion of individual substrate consumed in an enzymatic experiment where numerous substrates are present simultaneously with an enzyme, the simplified model should be able to determine hundreds of catalytic efficiencies in parallel. To test this capability, a complex peptide mixture was generated by trypsin digestion of Jurkat cell lysate. After desalting, this peptide mixture was used as the peptide substrate library to screen the substrates of a protease, Glu-C. The enzymatic reaction was performed by incubating the peptide mixture with Glu-C. Three aliquots (800 μl) were removed and quenched at time points of 30 and 60 min, and 20 h (the time for the last one was long enough with excess amount of enzyme to ensure the cleavage by Glu-C was complete). Then, triplex stable isotope dimethyl labeling, which is often used in high throughput quantitative proteomics (30), was applied to quantify the percentages of generated products at different reaction times. The removed mixtures were labeled with light (30 min Glu-C digestion), intermediate (60 min Glu-C digestion), and heavy dimethyl (20 h with excess amount of Glu-C), respectively. Then the labeled aliquots from the above three time points were mixed with a ratio of 1:1:1, desalted and analyzed with 2D-LC-MS/MS.
The acquired raw files from two replication LC-MS/MS runs were processed using the Maxquant platform (31), which resulted in quantification of 12,137 unique peptides. By mapping these peptides to their protein sequences, we were able to determine if the cleavages are generated by Glu-C digestion. Take two quantified peptide, GSLAAVAHAQSLVE and GLLGLQNLLK, as the examples. The sequences surrounding the two cleavage sites on the two peptide termini were observed to be PLPLSR.GSLAAVAHAQSLVE.AQPNND and WSERKE.GLLGLQNLLK.NQRTLS, respectively, after mapping to protein sequences. Clearly the N-terminal of the first peptide and C-terminal of the second peptide were generated by trypsin digestion as they follow the trypsin cleavage rule. Glu-C cleaves peptide bonds after Asp or Glu. Thus, the cleavage sites for Glu-C for these two peptides could be determined to be AQSLVE.AQPNN and WSERKE. GLLGL. By this way, 2369 unique peptides were identified to be generated by Glu-C and were successfully quantified. Catalytic efficiencies of the above peptide substrates were calculated by the simplified model (see supplemental Table S6). According to the catalytic efficiency distribution of the substrates, we classified the quantified substrates into three types of cleavage sites: fast (with catalytic efficiency above 0.01 μm−1 s−1, 326 peptide substrates), slow (with catalytic efficiency between 0.001 and 0.01 μm−1 s−1, 1494 peptide substrates) and very slow (with catalytic efficiency below 0.001 μm−1 s−1, 549 peptide substrates). The sequence logos for the normalized peptide sequences were generated by the WebLogo (26) and are shown in Fig. 6. It was observed that the cleavage site E surrounded by neutral residues could be quickly cut, while those with negatively charged amino acid residues (Asp/Glu) could be slowly cut. It was also observed that the cleavage rarely occurred on D sites. This was consistent with the fact that Glu-C cleaves peptide bonds C-terminally at Glu with a 3,000-fold higher rate than those at Asp (32). Six identified Glu-C substrate peptides (see supplemental Table S5) with various catalytic efficiencies were chosen for further validation. They were synthesized and the kinetic constants of Glu-C for these substrate peptides were determined individually with classic method of Lineweaver-Burk plot analysis. As can be seen in Fig. 6 (insert), the catalytic efficiencies calculated by the simplified model were consistent with these determined by the conventional method with the slope of 0.94 in the linear correlation analysis (R2 = 0.969).
Fig. 6.
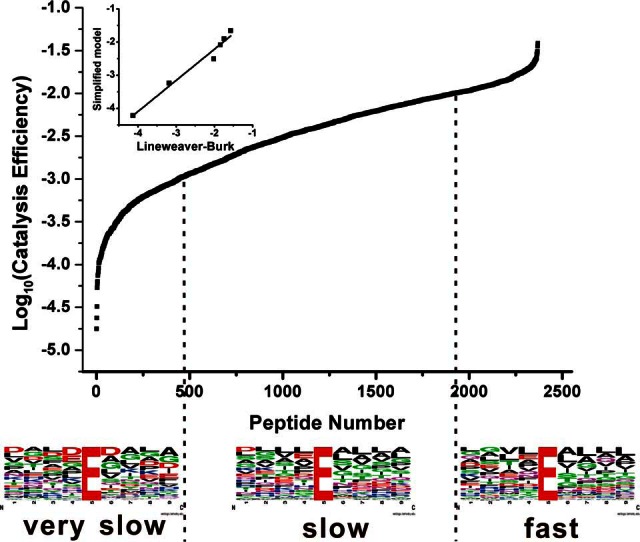
Distributions of the catalytic efficiencies of the Glu-C substrate peptides determined by the simplified model using the dataset aquired by proteomics plateform. The x axis indicates the number of peptide identifications and the y axis represents the log10(Catalytic efficiency) of the substrate peptides. Sequence logos of cleavage sites were classified into three types: very slow (<0.001 μm−1s−1), slow (0.001<<0.01 μm−1s−1), and fast (>0.01 μm−1s−1), the height of each amino acid reflects its occurrence frequency at the corresponding position. The insert is the comparison of the Log10(catalytic efficiency) of six selected Glu-C peptide substrates deteremined by the simplified model versus classic method (y = 0.94 × −0.30, R2 = 0.969, see data in supplemental Table S5).
The above example illustrated that large scale detemination of catalytic efficiencies could be achieved by interpretation of the time course data obtained by the high-throughput quantitative proteomics platform with the simplified model. However, it should be mentioned that the simplified model is only valid for the enzymatic reaction system with insignificant. Before the enzymatic experiment, it is important to estimate the value of for the reaction system. In this study, 25 μg peptide mixture was incubated with Glu-C for enzymatic reaction. Assuming the average molecular weight of substrate peptides was about 1.5 kDa (estimated by the peptides generated by trypsin digestion) and the minimum Km of the Glu-C substrate was 100 μm (Km values of trypsin and Glu-C for different peptide substrates determined by conventional methods are all greater than 100 μm, see supplemental Table S1 and supplemental Table S5), the volume of the reaction system was determined to be 0.83 ml when the equal to 0.2. To further make the term insignificant, a much-diluted reaction system with volume of 2 ml was finally applied in the enzymatic reaction in this study. The high accurancy of the determined catalytic efficiencies shown in Fig. 6 (Insert) indicated that above reaction conditions are proper. The pseudo-first-order kinetics model derived for conventional single substrate system, which has the same form with Equation (5), was applied to assess the catalytic efficiencies of competing substrates in complex system (24, 25). However, it is not sure if the enzymatic reaction was performed with insignificant because the important parameter, substrate protein concentration for enzymatic reaction, was not given in their studies. If is insignificant in their study, then the catalytic efficiencies they determined would be smaller than true values as we discussed above.
DISCUSSION
Many important experiments in biochemistry including enzyme substrate screening, enzymatic labeling, and protein digestion involve the enzymatic reactions in complex system. Due to the difficulty to resolve the differential rate equation set, the simulation of the enzymatic reactions in such a complex system is not achieved before. The iteration approach presented in this study is a powerful tool for this purpose. As long as the kinetic constants for the substrates of an enzyme are known, it can be used to generate a series of progress curves including the change of free enzyme concentration, the substrate/product concentration and the rates of substrate consumption. This will certainly facilitate our understanding on the enzymatic reaction in a complex system, which is more similar to those occurring in vivo. Compared with time-consuming and costly experiments, the prediction by iteration approach is high-throughput and cost-effective. We found the trends predicted by the iteration approach including the progress curves for the fraction of consumed substrates, the effect of the concentration of a competing substrate on the enzymatic reactions and the dependence of the enzymatic reactions on the were all highly consistent with those experimentally determined. Enzyme is an important catalyst for industrial synthetic chemistry due to its exquisite selectivity enabling the transformations without the need for the tedious blocking and deblocking steps (33). If there are competing interference substrates coexist with the substrate to be transformed, the byproducts from these interference substrates will be generated during the enzymatic reactions. This iteration approach could be used to simulate these reactions and optimize the reaction conditions to minimize the yield of byproducts. It can be expected that this iteration approach will have broad applications in both fundamental and applied enzymology.
Catalytic efficiency (kcat/Km), also referred to as the “specificity constant,” is a useful index for comparing the relative rates of an enzyme acting on alternative, competing substrates (34, 35). The higher the catalytic efficiency, the better the substrate for the enzyme. It is an important index to prioritize the substrates of an enzyme. Unfortunately, the conventional proteomics-based substrate screening approaches typically do not provide the values of catalytic efficiency even though several hundred substrates could be identified (7, 11, 13, 15). Although the simplified model presented in this study allowed for the accurate determination of the catalytic efficiencies of numerous substrates in the complex enzymatic reaction system. Compared with the approach reported by Schellenberger et al. (36), the significant feature of this approach is that the addition of substrate of known catalytic efficiency into the reaction mixture is not necessary. As long as the enzymatic reaction is performed with the condition of < 0.2, the catalytic efficiencies for substrates presented in the reaction mixture could be determined according to Equation (5). This condition could be easily achieved by diluting the reaction solution. This approach is a truly high throughput one as we have demonstrated that the catalytic efficiencies of over 2000 peptide substrates were determined for the enzyme of Glu-C. As a result, the prioritizing of these substrates could be achieved in high throughput, which is very important for enzyme substrate screening. Clearly this approach enabled the substrate screening changed from qualitative to quantitative. Classically, to determine the kinetic constants of the enzyme for a specific substrate, the substrate must be purified which is often tedious and labor intensive. The application of the simplified model also allows the characterization of specific substrates in a substrate mixture. For example, the catalytic efficiency of an enzyme for a specific protein in total cell lysate could be determined by performing the enzymatic reactions using total cell lysate as the substrate mixture followed with the determination of the portion of the specific protein consumed by immune assay methods like enzyme-linked immunosorbent assay (ELISA). It is expected that the simplified model will find broad applications in both high throughput substrate screening and the focused characterization of a few specific substrates.
In conclusion, an iteration approach was established for the description of enzymatic reactions in a complex system. Its validation was achieved with 630 time-course points of 24 enzymatic reaction experiments with various substrate concentrations. A simplified model was further developed to depict the reactions in the complex system with <0.2. It was found that the rate for the consumption of a substrate in such a complex system depends only on its own kinetic constants and concentration, while independent of other coexisting substrates. The simplified model, combined with high throughput proteomics platform, enabled the determination of the catalytic efficiencies of Glu-C for 2369 substrate peptides. Our study indicated that the iteration approach allowed the accurate simulation of the progress curves for the complex enzymatic reactions and the simplified model enabled the prioritizing of substrates in high throughput. They are expected to be important tools to understand and characterize the enzymatic reactions in complex system.
Supplementary Material
Footnotes
Author contributions: M.Y., H.Z., and Z.D. conceived and designed the experiments. Z.D. performed the experiments. J.M. and Y. W. participated in the discussions and analysis of data. Z.D., M.Y., and H.Z. wrote the manuscript.
* This work was supported, in part, by funds from the China State Key Basic Research Program Grants (2016YFA0501402, 2013CB911202), the National Natural Science Foundation of China (21235006, 21321064, 21535008, 81430072, 81361128015). MY is a recipient of the National Science Fund of China for Distinguished Young Scholars (21525524).
 This article contains supplemental material.
The authors declare no competing financial interest.
1 The abbreviations used are:
- HPLC
- high pressure liquid chromatography
- LC-MS/MS
- liquid chromatography-tandem mass spectrometry.
REFERENCES
- 1. Kho C., Lee A., Jeong D., Oh J. G., Gorski P. A., Fish K., Sanchez R., DeVita R. J., Christensen G., Dahl R., and Hajjar R. J. (2015) Small-molecule activation of SERCA2a SUMOylation for the treatment of heart failure. Nat. Commun. 6, 7229. [DOI] [PMC free article] [PubMed] [Google Scholar]
- 2. Mirtschink P., Krishnan J., Grimm F., Sarre A., Horl M., Kayikci M., Fankhauser N., Christinat Y., Cortijo C., Feehan O., Vukolic A., Sossalla S., Stehr S. N., Ule J., Zamboni N., Pedrazzini T., and Krek W. (2015) HIF-driven SF3B1 induces KHK-C to enforce fructolysis and heart disease. Nature 522, 444–449 [DOI] [PMC free article] [PubMed] [Google Scholar]
- 3. Webb B. A., Forouhar F., Szu F. E., Seetharaman J., Tong L., and Barber D. L. (2015) Structures of human phosphofructokinase-1 and atomic basis of cancer-associated mutations. Nature 523, 111–114 [DOI] [PMC free article] [PubMed] [Google Scholar]
- 4. Noble M. E., Endicott J. A., and Johnson L. N. (2004) Protein kinase inhibitors: insights into drug design from structure. Science 303, 1800–1805 [DOI] [PubMed] [Google Scholar]
- 5. Rossé G., Kueng E., Page M. G., Schauer-Vukasinovic V., Giller T., Lahm H. W., Hunziker P., and Schlatter D. (2000) Rapid identification of substrates for novel proteases using a combinational peptide library. J. Comb. Chem. 2, 461–466 [DOI] [PubMed] [Google Scholar]
- 6. Saghatelian A., Trauger S. A., Want E. J., Hawkins E. G., Siuzdak G., and Cravatt B. F. (2004) Assignment of endogenous substrates to enzymes by global metabolite profiling. Biochemistry 43, 14332–14339 [DOI] [PubMed] [Google Scholar]
- 7. Schlüter H., Rykl J., Thiemann J., Kurzawski S., Gobom J., Tepel M., Zidek W., and Linscheid M. (2007) Mass spectrometry-assisted protease substrate screening. Anal. Chem. 79, 1251–1255 [DOI] [PubMed] [Google Scholar]
- 8. Patterson A. W., Wood W. J., and Ellman J. A. (2007) Substrate activity screening (SAS): a general procedure for the preparation and screening of a fragment-based non-peptidic protease substrate library for inhibitor discovery. Nat. Protoc. 2, 424–433 [DOI] [PubMed] [Google Scholar]
- 9. Gläsner W., Merkl R., Schellenberger V., and Fritz H. J. (1995) Substrate preferences of Vsr DNA mismatch endonuclease and their consequences for the evoluton of the Escherichia coli K-12 genome. J. Mol. Biol. 245, 1–7 [DOI] [PubMed] [Google Scholar]
- 10. Turk B. E., Huang L. L., Piro E. T., and Cantley L. C. (2001) Determination of protease cleavage site motifs using mixture-based oriented peptide libraries. Nat. Biotechnol. 19, 661–667 [DOI] [PubMed] [Google Scholar]
- 11. Schilling O., and Overall C. M. (2008) Proteome-derived, database-searchable peptide libraries for identifying protease cleavage sites. Nat. Biotechnol. 26, 685–694 [DOI] [PubMed] [Google Scholar]
- 12. Wang C., Ye M., Bian Y., Liu F., Cheng K., Dong M., Dong J., and Zou H. (2013) Determination of CK2 specificity and substrates by proteome-derived Peptide libraries. J. Proteome Res. 12, 3813–3821 [DOI] [PubMed] [Google Scholar]
- 13. Bian Y., Ye M., Wang C., Cheng K., Song C., Dong M., Pan Y., Qin H., and Zou H. (2013) Global Screening of CK2 Kinase Substrates by an Integrated Phosphoproteomics Workflow. Sci. Rep. 3, 1611–1614 [DOI] [PMC free article] [PubMed] [Google Scholar]
- 14. Sivars U., Aivazian D., and Pfeffer S. R. (2003) Targets of the cyclin-dependent kinase Cdk1. Nature 425, 856–85914574414 [Google Scholar]
- 15. Xue L., Wang W., lliuk A., Hu L., Galan J. A., Yu S., Hans M., Geahlen R. L., and Tao W. A. (2012) Sensitive kinase assay linked with phosphoproteomics for identifying direct kinase substrates. Proc. Natl. Acad. Sci. U.S.A. 109, 5616–5620 [DOI] [PMC free article] [PubMed] [Google Scholar]
- 16. Swaney D. L., Wenger C. D., and Coon J. J. (2010) Value of using multiple proteases for large-scale mass spectrometry-based proteomics. J. Proteome Res. 9, 1323–1329 [DOI] [PMC free article] [PubMed] [Google Scholar]
- 17. Anders C., Niewoehner O., Duerst A., and Jinek M. (2014) Structural basis of PAM-dependent target DNA recognition by the Cas9 endonuclease. Nature 513, 569–573 [DOI] [PMC free article] [PubMed] [Google Scholar]
- 18. Bian Y., Ye M., Song C., Cheng K., Wang C., Wei X., Zhu J., Chen R., Wang F., and Zou H. (2012) Improve the coverage for the analysis of phosphoproteome of HeLa cells by a tandem digestion approach. J. Proteome Res. 11, 2828–2837 [DOI] [PubMed] [Google Scholar]
- 19. Petritis B. O., Qian W. J., Camp D. G. 2nd, and Smith R. D. (2009) A simple procedure for effective quenching of trypsin activity and prevention of 18O-labeling back-exchange. J. Proteome Res. 8, 2157–2163 [DOI] [PMC free article] [PubMed] [Google Scholar]
- 20. Pan Y., Ye M., Zhao L., Cheng K., Dong M., Song C., Qin H., Wang F., and Zou H. (2013) N-terminal labeling of peptides by trypsin-catalyzed ligation for quantitative proteomics. Angewandte Chemie 52, 9205–9209 [DOI] [PubMed] [Google Scholar]
- 21. Michaelis L., and Menten M. L. (1913) Die Kinetik der INvertinwirkung. Biochemistry 49, 333–369 [Google Scholar]
- 22. Fonslow B. R., Stein B. D., Webb K. J., Xu T., Choi J., Park S. K., and Yates J. R. 3rd. (2013) Digestion and depletion of abundant proteins improves proteomic coverage. Nat. Methods 10, 54–56 [DOI] [PMC free article] [PubMed] [Google Scholar]
- 23. Ye M., Pan Y., Cheng K., and Zou H. (2014) Protein digestion priority is independent of protein abundances. Nat. Methods 11, 220–222 [DOI] [PubMed] [Google Scholar]
- 24. Agard N. J., Mahrus S., Trinidad J. C., Lynn A., Burlingame A. L., and Wells J. A. (2012) Global kinetic analysis of proteolysis via quantitative targeted proteomics. Proc. Natl. Acad. Sci. U.S.A. 109, 1913–1918 [DOI] [PMC free article] [PubMed] [Google Scholar]
- 25. Julien O., Zhuang M., Wiita A. P., O'Donoghue A. J., Knudsen G. M., Craik C. S., and Wells J. A. (2016) Quantitative MS-based enzymology of caspases reveals distinct protein substrate specificities, hierarchies, and cellular roles. Proc. Natl. Acad. Sci. U.S.A. 113, E2001–E2010. [DOI] [PMC free article] [PubMed] [Google Scholar]
- 26. Doerks T., Copley R. R., Schultz J., Ponting C. P., and Bork P. (2002) Weblogo: A sequence logo generator. Genome. Res. 12, 47–56 [DOI] [PMC free article] [PubMed] [Google Scholar]
- 27. Vizcaino J. A., Csordas A., del-Toro N., Dianes J. A., Griss J., Lavidas I., Mayer G., Perez-Riverol Y., Reisinger F., Ternent T., Xu Q. W., Wang R., and Hermjakob H. (2016) 2016 update of the PRIDE database and its related tools. Nucleic Acids Res. 44, D447–456 [DOI] [PMC free article] [PubMed] [Google Scholar]
- 28. Inagami T., and Sturtevant J. M. (1960) The trypsin-catalyzed hydrolysis of benzoyl-L-arginine ethyl ester. Biochim. Biophys. Acta 38, 64–79 [DOI] [PubMed] [Google Scholar]
- 29. Lineweaver H., and Burk D. (1934) The determination of enzyme dissociation constants. J. Am. Chem. Soc. 56, 658–666 [Google Scholar]
- 30. Boersema P. J., Raijmakers R., Lemeer S., Mohammed S., and Heck A. J. (2009) Multiplex peptide stable isotope dimethyl labeling for quantitative proteomics. Nat. Protoc. 4, 484–494 [DOI] [PubMed] [Google Scholar]
- 31. Cox J., and Mann M. (2008) MaxQuant enables high peptide identification rates, individualized p.p.b.-range mass accuracies and proteome-wide protein quantification. Nat. Biotechnol. 26, 1367–1372 [DOI] [PubMed] [Google Scholar]
- 32. Sørensen S. B., Sørensen T. L., and Breddam K. (1991) Fragmentation of proteins by S. aureus strain V8 protease Ammonium bicabonate strongly inhibits the enzyme but does not improve the selectivity for glutamic acid. FEBS Lett. 294, 195–197 [DOI] [PubMed] [Google Scholar]
- 33. Schmid A., Dordick J. S., Hauer B., Kiener A., Wubbolts M., and Witholt B. (2001) Industrial biocatalysis today and tomorrow. Nature 409, 258–268 [DOI] [PubMed] [Google Scholar]
- 34. Eisenthal R., Danson M. J., and Hough D. W. (2007) Catalytic efficiency and kcat/KM: a useful comparator? Trends Biotechnol. 25, 247–249 [DOI] [PubMed] [Google Scholar]
- 35. Brot F. E., and Bender M. L. (1969) Use the specificity constant of alpha-Chymotrypsin. J. Am. Chem. Soc. 91, 7187–7191 [DOI] [PubMed] [Google Scholar]
- 36. Schellenberger V., Siegel R. A., and Rutter W. J. (1993) Analysis of enzyme specificity by multiple substrate kinetics. Biochemistry 32, 4344–4348 [DOI] [PubMed] [Google Scholar]
Associated Data
This section collects any data citations, data availability statements, or supplementary materials included in this article.