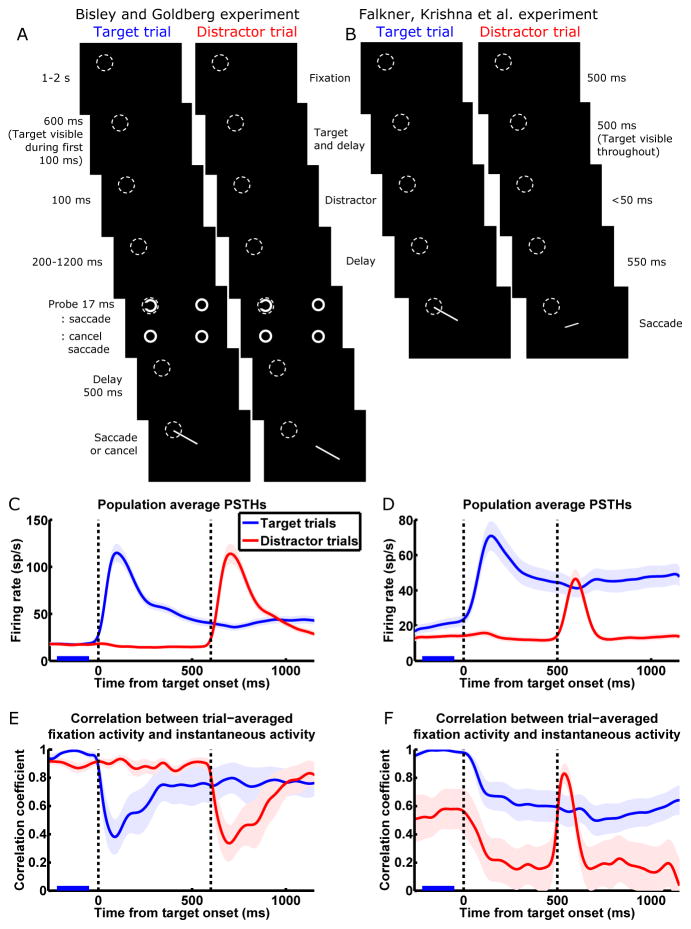
Figure 1.
The conflicting population dynamics observed by Bisley and Goldberg (2003; BG; left column) and Falkner, Krishna et al. (2010; FK; right column).
(A and B) Task schematics. While the monkey fixates a central spot, a target appears. The monkey is required to hold fixation until the disappearance of the fixation spot, at which time it makes a saccade to the location of the target. During the delay between target onset and fixation spot disappearance, a task-irrelevant distractor stimulus is flashed. We call a given trial a target trial or distractor trial when the target or distractor, respectively, is in the RF (dashed circles) of the neuron being recorded. In the BG task, the target and distractor are in opposite visual quadrants and equidistant from the fixation spot; in the FK task, either the target or the distractor is in the RF, and the other stimulus is at the location that elicits maximum surround suppression for the recorded neuron. In the BG task, between 200 and 1200 ms after the distractor disappears, a probe (a Landolt ring) is flashed at either the target or the distractor location, along with three complete rings elsewhere; a left-facing or right-facing ring instructs the monkey to proceed with or cancel the planned saccade, respectively. In C and E, we only include trials in which the probe appeared at least 700 ms after distractor onset. For task details, see SI section 1.
(C and D) Population average peristimulus time histograms (PSTHs) in the BG (C; n = 41 cells) and FK (D; n = 27) studies. Blue/red traces denote trials in which the target/distractor appears in the RF of the neuron being recorded; every neuron was recorded during both target and distractor trials and contributes to both traces. The first and second vertical dashed lines denote the onset of the target and the distractor, respectively. Shading around traces indicates SEM. PSTHs have been smoothed by convolution with a Gaussian kernel (σ = 30 ms; firing rates and correlations appearing to change before stimuli onset in Fig. 1C–F are artifacts of this smoothing).
(E and F) Correlation analysis for the BG (E) and FK (F) datasets. We define a trial-averaged population fixation activity vector F⃗, each element of which is the activity of one cell on target trials, averaged over trials and over the period from 220 ms to 50 ms before target onset (marked by blue bars in C–F). At each millisecond time point over the course of the target trial (blue traces) or distractor trial (red traces), the correlation coefficient was computed between the trial-averaged population instantaneous activity vector at that point in time and F⃗. The BG correlation patterns (E; presented in similar format in Ganguli et al., 2008) exhibit one-dimensional dynamics on slow timescales (high correlations during stable fixation activity and delay activity), while the FK correlation patterns (F) markedly deviate from one dimension (on distractor trials, low correlations during stable activity, and transient increase in correlation during distractor visual response). Vertical dashed lines are as in C and D. Shading around traces indicates standard error estimated from 1000 bootstrap samples.
See Fig. S1A for correlations between distractor trials fixation activity and instantaneous activity of the FK data, and Fig. S2A–D for the FK data plotted separately for different reward conditions.

