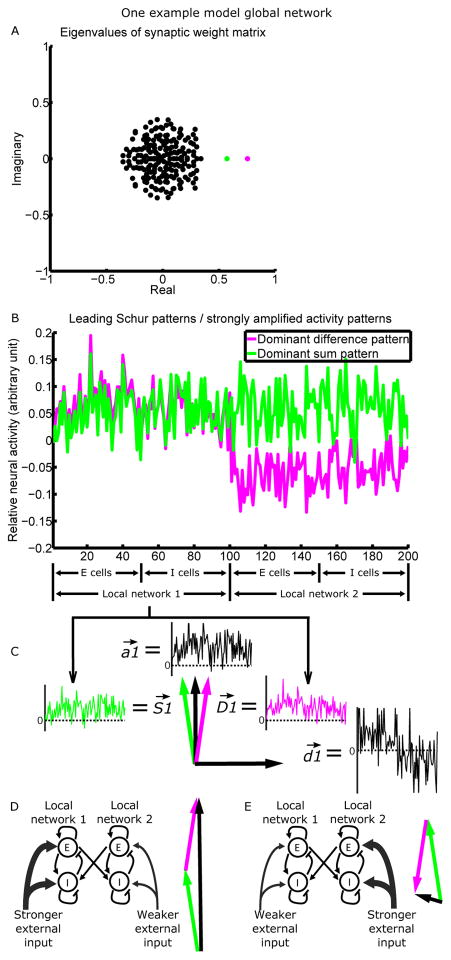
Figure 3.
Recurrent connectivity strongly amplifies two activity patterns.
(A) The eigenvalue spectrum of the connectivity matrix (matrix plotted in Fig. S4D), for a model network composed of two interconnected LNs of 100 neurons each. Each eigenvalue is associated with a Schur vector, representing a pattern of relative activation across neurons (see Results for details). The more positive the real part of an eigenvalue, the more strongly the network amplifies the corresponding Schur activity pattern. Two patterns (magenta and green) are more strongly amplified than others and are plotted in B.
(B) Relative activation across neurons in the dominant difference pattern (differential activation of the two LNs; magenta) and the dominant sum pattern (equal activation of the two LNs; green), or equivalently, the two leading Schur vectors of the connectivity matrix. The difference/sum pattern is driven by the difference/sum of the mean inputs to the two LNs. Note the similarity of the two patterns across cells of the same LN.
(C) The LN1 portion of the sum ( ) and difference ( ) patterns can be represented as vectors in the two-dimensional space they define. We can take the axes of the 2D space to be , a vector proportional to the average of and , and , a vector proportional to their difference.
(D and E) When LN1 receives stronger (D)/weaker (E) mean external input than LN2, is activated positively, and is activated positively (D)/negatively (E). Thus, the components of and add (D)/cancel (E), while the components of and cancel (D)/add (E). The actual activity vectors (black) thus point in very different directions in D and E.
See Fig. S4 for analysis of the feedforward connections between the Schur patterns, and Fig. S5A for comparisons of the directions of dominant activity patterns.

