

Summary
Transient receptor potential melastatin subfamily 3 (TRPM3) ion channels play a role in calcium (Ca2+) cell signalling. Reduced TRPM3 protein expression has been identified in chronic fatigue syndrome/myalgic encephalomyelitis (CFS/ME) patients. However, the significance of TRPM3 and association with intracellular Ca2+ mobilization has yet to be determined. Fifteen CFS/ME patients (mean age 48·82 ± 9·83 years) and 25 healthy controls (mean age 39·2 ± 12·12 years) were examined. Isolated natural killer (NK) cells were labelled with fluorescent antibodies to determine TRPM3, CD107a and CD69 receptors on CD56dimCD16+NK cells and CD56brightCD16dim/– NK cells. Ca2+ flux and NK cytotoxicity activity was measured under various stimulants, including pregnenolone sulphate (PregS), thapsigargin (TG), 2‐aminoethoxydiphenyl borate (2APB) and ionomycin. Unstimulated CD56brightCD16dim/– NK cells showed significantly reduced TRPM3 receptors in CFS/ME compared with healthy controls (HC). Ca2+ flux showed no significant difference between groups. Moreover, PregS‐stimulated CD56brightCD16dim/–NK cells showed a significant increase in Ca2+ flux in CFS/ME patients compared with HC. By comparison, unstimulated CD56dimCD16+ NK cells showed no significant difference in both Ca2+ flux and TRPM3 expression. PregS‐stimulated CD56dimCD16+ NK cells increased TRPM3 expression significantly in CFS/ME, but this was not associated with a significant increase in Ca2+ flux. Furthermore, TG‐stimulated CD56dimCD16+ NK cells increased K562 cell lysis prior to PregS stimulation in CFS/ME patients compared with HC. Differential expression of TRPM3 and Ca2+ flux between NK cell subtypes may provide evidence for their role in the pathomechanism involving NK cell cytotoxicity activity in CFS/ME.
Keywords: cell surface molecules, inhibitory/activating receptors, natural killer cells
Introduction
Chronic fatigue syndrome/myalgic encephalomyelitis (CFS/ME) is a complex illness presenting with debilitating post‐exertional malaise accompanied by other neurological, immunological, autonomic and ion transport impairments 1, 2. The most consistent biological evidence reported in CFS/ME has been reduced natural killer (NK) cell cytotoxicity (reviewed by Stayer et al. 3).
NK cells belong to the innate immune system and are distinguished into two main subsets known as CD56brightCD16dim/– NK cells and CD56dimCD16+ NK cells. CD56brightCD16dim/– NK cells are predominately immunosurveillance cells with potent cytokine production, whereas CD56dimCD16+ NK cells are cytotoxic and kill infected, tumour or ‘missing self’ cells 4.
Activated NK cells increase CD69 receptors and may be modulated by protein kinase C (PKC) and protein tyrosine kinases 5. NK cells from CFS/ME patients have been reported to have a significant reduction in CD69 receptors after stimulation 6. When NK cells come into contact with virus‐infected or tumour cells, an immune synapse is formed and degranulation is activated. Degranulation is detected when NK cells increase the lysosome‐associated membrane protein‐1 (LAMP‐1, CD107a) receptor 7. NK cells require Ca2+ to regulate cellular functions, which play a major role in signalling pathways that are essential for development of immune synapse formation, cytokine production and cytotoxic activity 8.
Transient receptor potential (TRP) ion channels modulate ion entry in the cell plasma membrane, and are expressed differentially on tissues throughout the body. Their dysfunction has been associated with several diseases, such as cancer, glomerulosclerosis and polycystic kidney disease 9. Transient receptor potential melastatin 3 ion channels (TRPM3) are transmembrane ion channels belonging to the melastatin subfamily of TRP cation ion channels 10, 11. There are seven isotypes identified in the human TRPM3 gene; in particular, the TRPM3α2 isotype has been characterized as having a Ca2+ and Mg2+ ion‐conducting pore 12, 13. TRPM3 ion channels are expressed in various tissues, predominantly in sensory neurones, kidney, brain, pituitary gland and pancreas. While expressed ubiquitously in mammalian cells, the roles and functions of TRPM3 have yet to be determined in immune cells 10. TRPM3 ion channels are activated selectively by a potent neurosteroid, pregnenolone sulphate (PregS) 14. Pregnenolone is synthesized from cholesterol by many tissues, including adrenal glands, brain and skin. These tissues have been reported to express TRPM3 10. Physiologically, PregS plays a role in both the central nervous system and immune system, which include improvement of memory and cognitive function, enhanced neuronal myelination, activation of neurotransmitter‐gated channels, modulation of glutamate–nitric oxide–guanosine 3′,5′‐(cyclic) phosphate pathways, regulation of insulin secretion and the management of noxious pain 14, 15.
Recently, TRPM3 ion channels were identified on NK cells and B cells from CFS/ME patients 16, and these cells were shown to have significantly reduced expression of the TRPM3 receptor on the cell surface compared with healthy controls (HC) 17. However, the role of TRPM3 in terms of receptor number and Ca2+ mobilization following stimulants, such as PregS on NK cell function, has not been investigated in CFS/ME patients. Therefore, the objective of this study was to determine the effects of PregS on TRPM3, including CD69 and CD107a receptor expression in NK cells. Additionally, we investigated intracellular Ca2+ mobilization and cytotoxic activity of NK cells after PregS treatment in HC and CFS/ME patients.
Materials and methods
Participants
CFS/ME patients meeting the Fukuda definition were included into the study, along with HC 2. All participants were recruited between the ages of 18 and 65 years, with no previous history of smoking or chronic disease (autoimmune diseases, cardiac diseases and primary psychological disorders). Participants were further excluded if pregnant, breast feeding or taking hormone therapy and pharmaceutical immunoregulatory medications. Alternatively, participants on immunoregulatory medications were included into the study if medications were discontinued 2 weeks prior to their blood collection.
Participants living in the South East Queensland region of Australia donated 80 ml of blood between 8:00 a.m. and 10:30 a.m. Seventy ml of blood was used to isolate NK cells for further study, while the remaining 10 ml was used for routine pathology screening to help determine any underlying illness. Pathology results included a full blood cell count, electrolytes, erythrocyte sedimentation rate, C‐reactive protein, dehydroepiandrosterone, adrenocorticotrophic hormone and cortisol. All participants completed a self‐reported questionnaire on their current symptoms, which also included the Short‐Form Health Survey (SF‐36) and WHO Disability Assessment Schedule 2.9 (WHO DAS 20.0) to assess participants' physical health.
Drugs and antibodies
In‐vitro assays consisted of using the following drugs at a final concentration of 1 μM ionomycin, 50 μM 2‐aminoethoxydiphenyl borate (2‐APB), 1·42 μM thapsigargin (TG) and 1·35 μM PregS. All drugs were purchased from Bio‐Techne (Tocris Bioscience, Sussex, UK) except ionomycin, which was purchased from Sigma (Mansfield, Victoria, Australia). Antibodies CD3, CD56, CD16, CD69 and CD107a were purchased from Beckon Dickinson Bioscience (Miami, FL, USA). TRPM3 primary and secondary antibody was purchased from Santa Cruz Biotechnology (Dallas, TX, USA). Isotypes were used to determine negative cell populations. TRPM3 primary antibody was blocked by peptide amino acids that bind to the 816‐897aa of TRPM3 of human origin (Accession number Q9HCF6) and binds to the extracellular domain to determine non‐specific binding.
NK cells
Peripheral blood mononuclear cells (PBMCs) were isolated from ethylenediamine tetraacetic acid (EDTA) whole blood by centrifugation over a density gradient medium (Ficoll; GE Healthcare, Pittsburgh, PA, USA), followed by magnetic isolation for unlabelled NK cells using EasySep, as described by the manufacturer's instructions. Isolated NK cells from PBMCs were determined to be 90·4% ± 3·82 purity for CFS/ME patients and 91·6% ± 5·61 for HC. Isolated NK cells were identified as CD56brightCD16–/dim and CD56dimCD16+ NK cells.
TRPM3, CD69 and CD107a surface expression on NK cells
TRPM3 expression on resting NK cell subsets was identified as described previously 16. Briefly, NK cells were labelled with CD3, CD56, CD16 and primary TRPM3 antibodies for 30 min at room temperature. NK cells were washed and stained with TRPM3 secondary antibody for 30 min. Stimulated NK cells were assessed further in the presence of PregS, ionomycin, 2APB + PregS and TG + PregS for 4 h at 37˚C. Cells were stained with CD69, CD107a and TRPM3 primary antibody for 30 min to determine CD69, CD107a and TRPM3 receptor expression on CD56brightCD16dim/– NK cells and CD56dimCD16+ NK cell subpopulations. True cell counting beads were used to calculate NK cell concentration as well as absolute cell counts and was determined using the manufacturer's instructions outlined in the following formula:
Cytoplasmic Ca2+ in NK cells
Ca2+ flux was performed as described previously 16. Briefly, Ca2+ mobilization in NK cells was measured in the presence of ionomycin, 2‐APB and TG. Ionomycin is an ionopore that raises cytoplasmic Ca2+ levels independently of activated receptors, whereas 2‐APB and TG inhibit Ca2+‐dependent receptors on the endoplasmic reticulum (ER). 2‐APB prevent the release of intracellular Ca2+ stores compared to TG, which inhibit the replenishment of the Ca2+ into intracellular stores (Fig. 1). Furthermore, assessment of Ca2+ influx‐dependent TRPM3 receptors was determined using PregS. Isolated NK phenotypes were stimulated with PregS. Following this, NK cells were preincubated with either TG or 2APB prior to PregS stimulation. Cells were stimulated for 5 min and recorded in real time on flow cytometry.
Figure 1.
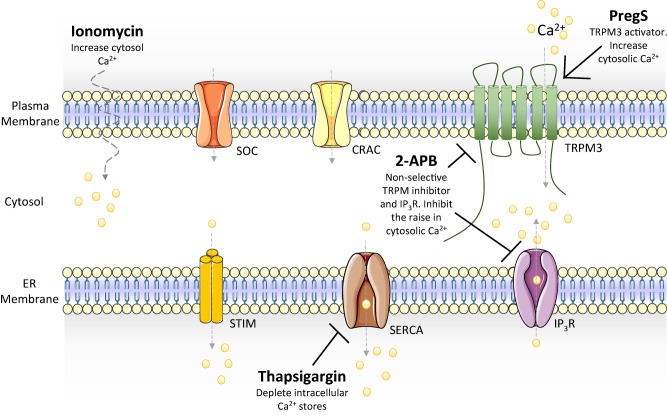
Systematic representation of calcium ions mobilization. Ionomycin is an ionopore that allows extracellular calcium ion into the cytosol. 2‐APB is a non‐selective TRPM and IP3R receptor, whereas thapsigargin inhibits intracellular calcium stores replenishment. ER = endoplasmic reticulum; SOC = store‐operated calcium channel; CRAC = calcium release activated channel; TRPM3 = transient receptor potential melastatin subfamily 3; STIM = stromal interaction molecule; SERCA = sarco/endoplasmic reticulum Ca2+‐ATPase; IP3R = inositol trisphosphate receptor; PregS = pregnenolone sulphate; 2‐APB = 2‐aminoethoxydiphenyl borate; Ca2+ = calcium.
NK cytotoxic activity
NK cell cytotoxicity baseline measurements were performed using 25 : 1, 12 : 1, 6 : 1 and 1 : 1 effector to target ratios, as described previously 18. NK cell cytotoxicity activity was measured indirectly through the percentage of apoptotic K562 cells. The NK cells were stimulated for 20 min in the presence of ionomycin, TG, 2APB and PregS or a combination of TG + PregS and 2APB + PregS. Cells were washed and plated with K562 cells at a 1 : 1 ratio, followed by incubation for 4 h at 37˚C. K562 cells were stained with annexin V and 7‐amino‐actinomycin D (7‐AAD) to determine K562 cell viability. K562 cell viability was determined into four stages; live/viable K562 cells (annexin V– 7AAD–), K562 cells undergoing early stage apoptosis (annexin V+ 7AAD–), late stage apoptosis (annexin V+ 7AAD+) and dead K562 cells (annexin V– 7AAD+). K562 cell death was calculated as described previously 18 and outlined below.
Data and statistical analyses
Data were exported from FacDiva version 8.1 and analysed using FlowJo software version 10 (TreeStar, Inc., Ashland, OR, USA). Data were quantified using spss version 22.2 software (IBM Corp., Armonk, NY, USA). Multivariate analysis of variance (manova) was performed to determine TRPM3 receptor expression in various stimulation conditions between HC and CFS/ME groups, as well as within each group. The Mann–Whitney statistical U‐test was used to determine the specific relationship effects between each stimulant (PregS, TG + PregS and 2APB + PregS) on TRPM3, CD69 and CD107a surface expression on NK cell subsets from CFS/ME patients and HC. The Gaussian smoothing method was applied on the Ca2+ flux response curve, prior to analyses of area under the curve (AUC), time of peak and slope. NK cell cytotoxic activity was measured by the percentage of K562 cell deaths as described by Aubry et al. 18. Statistical significance was reported at P < 0·05.
Results
Participants
A total of 40 participants were included in this investigation, 25 of which were HC and 15 were CFS/ME. The participants' demographic and standard serological results were recorded (Table 1). There were no significant differences in gender, body mass index (BMI), full blood counts, electrolytes, stress hormones or inflammatory markers between HC and CFS/ME. There was a significant between‐group difference for age, as CFS/ME patients were significantly older than HC.
Table 1.
Participants' demographic and serological results
| Category | Item | HC | CFS | P‐value |
|---|---|---|---|---|
| General demographics | n | 25 | 15 | |
| Gender | ||||
| Female (%, n) | 68% (17) | 70·6% (12) | ||
| Male (%, n) | 32% (8) | 29·4% (5) | ||
| Age (years) | 39·20 ± 12·124 | 48·824 ± 9·838 | 0·01 | |
| BMI (kg/m2) | 25·387 ± 4·383 | 25·602 ± 4·945 | 0·894 | |
| Illness demographics | SF‐36 score | |||
| Physical functioning (%) | 100 ± 0·000 | 59·166 ± 27·289 | 0·016 | |
| Role limitations due to physical health (%) | 97·5 ± 7·905 | 2·083 ± 7·216 | 0·000 | |
| Role limitations due to emotional problems (%) | 96·66 ± 10·540 | 50 ± 46·056 | 0·000 | |
| Energy/fatigue (%) | 73 ± 12·292 | 20·833 ± 16·899 | 0·000 | |
| Emotional well‐being (%) | 83·2 ± 7·495 | 63 ± 10·531 | 0·000 | |
| Social functioning (%) | 94·75 ± 11·453 | 28·125 ± 25·497 | 0·000 | |
| Pain (%) | 97·5 ± 5·270 | 43·75 ± 29·435 | 0·000 | |
| General health (%) | 81·5 ± 12·258 | 34·166 ± 15·930 | 0·000 | |
| WHO DAS 2.0 (%) | 0·069 ± 0·218 | 41·078 ± 16·216 | 0·000 | |
| Serology report | Full blood count | |||
| WBC (×109/l) | 5·736 ± 1·241 | 6·212 ± 1·162 | 0·218 | |
| Lymphocytes (×109/l) | 1·865 ± 0·604 | 1·967 ± 0·468 | 0·560 | |
| Monocytes (×109/l) | 0·314 ± 0·097 | 0·332 ± 0·090 | 0·547 | |
| Neutrophils (×109/l) | 3·363 ± 0·831 | 3·708 ± 0·961 | 0·222 | |
| Eosinophils (×109/l) | 0·160 ± 0·088 | 0·182 ± 0·128 | 0·517 | |
| Basophils (×109/l) | 0·029 ± 0·019 | 0·027 ± 0·014 | 0·609 | |
| Platelets (×109/l) | 263·000 ± 68·512 | 244·588 ± 78·167 | 0·424 | |
| Haemoglobin (g/l) | 138·000 ± 11·384 | 142·941 ± 10·556 | 0·163 | |
| Haematocrit (%) | 0·413 ± 0·031 | 0·428 ± 0·029 | 0·134 | |
| RBC (×1012/l) | 4·670 ± 0·368 | 4·769 ± 0·371 | 0·395 | |
| MCV (fL) | 88·560 ± 3·927 | 89·588 ± 3·355 | 0·383 | |
| Electrolytes | ||||
| Sodium (mmol/l) | 136·600 ± 2·345 | 129·325 ± 33·152 | 0·278 | |
| Potassium (mmol/l) | 4·116 ± 0·405 | 4·125 ± 0·218 | 0·935 | |
| Chloride (mmol/l) | 102·560 ± 1·960 | 102·313 ± 2·089 | 0·703 | |
| Bicarbonate (mmol/l) | 26·280 ± 2·011 | 27·563 ± 2·097 | 0·057 | |
| Anion gap (mmol/l) | 7·800 ± 1·893 | 7·750 ± 2·352 | 0·941 | |
| Inflammatory markers | ||||
| ESR (mm/h) | 13·240 ± 9·854 | 12·882 ± 8·950 | 0·905 | |
| CRP (mg/l) | 1·973 ± 2·165 | 2·417 ± 3·620 | 0·633 | |
| Stress hormones | ||||
| DHEA sulphate (μmol/l) | 4·132 ± 2·129 | 3·733 ± 2·230 | 0·576 | |
| ACTH (ng/l) | 17·880 ± 8·303 | 15·625 ± 6·386 | 0·361 | |
| Cortisol (nmol/l) | 358·640 ± 132·282 | 286·067 ± 89·850 | 0·068 |
Data shown are mean ± standard deviation. HC = healthy controls; CFS = chronic fatigue syndrome; BMI = body mass index; WBC = white blood cell; RBC = red blood cell; MCV = mean corpuscular volume; ESR = erythrocyte sedimentation rate; CRP = C‐reactive protein; DHEA = dehydroepiandrosterone; ACTH = adrenocorticotrophic hormone. WHO DAS = World Health Organization Disability Assessment Schedule; SF‐26 = Short‐Form Health Survey. Bold type indicates statistical significance (P < 0·05).
CFS/ME patients reported greater impairment compared with HC in all SF‐36 subscales (lower scores indicate greater impairment; P < 0·05) and WHO DAS 2.0 subscales (higher scores indicate greater impairment; P < 0·05), as shown in Table 1. Significantly reduced SF‐36 scores and elevated WHO DAS 2.0 scores have been observed previously in other CFS/ME studies 19, 20, 21.
TRPM3 expressed on CD56brightCD16–/dim NK cells
CFS/ME had significantly reduced expression for TRPM3 receptors without stimulation in CD56brightCD16–/dim NK cells compared with HC (Fig. 2a–c) Similarly, TG‐stimulated CD56brightCD16–/dim NK cells had depleted intracellular Ca2+ stores and significantly reduced TRPM3 receptor expression in CFS/ME compared with HC (Fig. 2b). Overall, CD56brightCD16–/dim NK cells from both groups (CFS/ME and HC) had increased TRPM3 receptors after depletion of intracellular Ca2+ stores with TG and/or in combination with activating TRPM3 receptor with PregS, when compared without stimulation (Fig. 2b). Furthermore, inhibiting inositol trisphosphate receptor (IP3R) with 2APB and/or in combination with activating the TRPM3 receptor with PregS in CD56brightCD16–/dimTRPM3+ NK cells was not significantly different between or within each HC and CFS group (Fig. 2c).
Figure 2.
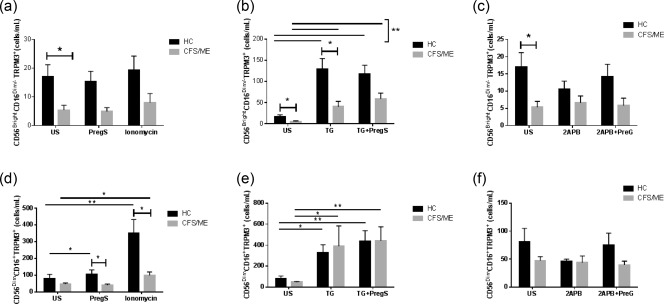
Natural killer (NK) cell TRPM3 expression in HC and CFS/ME patients. CD56brightCD16dim/– NK cells expressed TRPM3 as cells/ml under various conditions. (a) Unstimulated PregS and ionomycin. (b) TG and TG + PregS. (c) 2APB and 2APB + PregS. CD56dimCD16+ NK cells expressed TRPM3 as cells/ml under various conditions. (d) PregS and ionomycin. (e) TG and TG + PregS. (f) 2APB and 2APB + PregS. Data are represented as mean ± standard error of the mean. Asterisks (*) and (**) represent statistical significance at P < 0·05 and P < 0·01, respectively. US = unstimulated; PregS = pregnenolone sulphate; TG = thapsigargin; HC = healthy controls; 2‐APB = 2‐aminoethoxydiphenyl borate; CFS/ME = chronic fatigue syndrome/myalgic encephalomyelitis. [Colour figure can be viewed at wileyonlinelibrary.com]
TRPM3 expressed on CD56dimCD16+ NK cells
There was no significant between‐group difference in TRPM3 expression without stimulation of CD56dimCD16+ NK cells. However, there was a significant between‐group difference (CFS/ME and HC) in TRPM3 expression following PregS stimulation (Fig. 2d). Interestingly, within the HC group there was a significant increase in TRPM3 ion channels on PregS‐stimulated CD56dimCD16+ NK cells compared without stimulation. The CFS/ME group showed no significant difference in TRPM3 ion channel numbers in CD56dimCD16+ NK cells after PregS stimulation. In addition, ionomycin‐ stimulated CD56dimCD16+ NK cells within HC and CFS/ME groups demonstrated a significant increase in TRPM3 ion channels (Fig. 2d). Similarly, CD56dimCD16+TRPM3+ NK cells within both groups increased TRPM3 receptors with TG + PregS, TG and ionomycin when compared without stimulation. By comparison, no significant difference was observed after 2APB or 2APB + PregS stimulation between or within each of the groups (HC and CFS/ME) (Fig. 2f).
Activation markers on NK cell subsets
There was no significant difference in either CD56brightCD16–/dim or CD56dimCD16+ NK cells in CD107a and CD69 receptors between groups (data not shown). However, both NK cell subsets within groups showed no significant difference in CD69 receptor numbers between unstimulation and PregS. There was a significant reduction of CD69 receptor after TG and TG + PregS stimulations (Fig. S1). CD56dimCD16+ NK cells within groups showed a further reduction of CD69 receptor after 2APB and ionomycin compared without stimulation.
Ca2+ mobilization in NK cell subsets was determined using FlowJo, as shown in Fig. 3. Each subset Ca2+ response curve was reported as peak time (peak t) to determine the time for a reaction to reach its maximum. Slope is determined as follows: a positive slope implies that the y‐axis value is increasing over the time‐period, while a negative value implies that it is decreasing. The AUC is calculated to determine the duration and magnitude of Ca2+ flux, which is represented as a single number.
Figure 3.
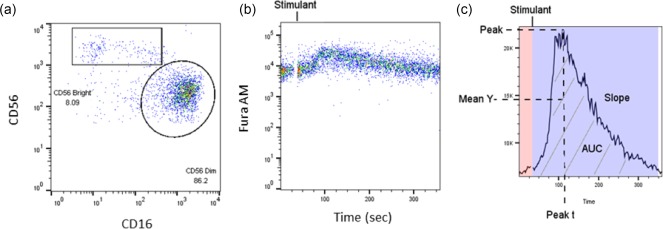
FlowJo analysis of Ca2+ mobilization response in isolated natural killer (NK) cells. (a) Gating strategies for CD56brightCD16dim/– NK cells and CD56dimCD16+ NK cells are shown as a pseudocolour dot‐plot. (b) NK cell Ca2+ flux is response over time, and displayed as a pseudocolour dot‐plot. (c) Summary of the kinetic analysis of the Ca2+ flux in NK cells. Peak t is the time that the maximum y‐axis value occurred for the specific time range noted. Peak is the magnitude of the y‐axis value at its maximum for the specific time range noted. The mean of the y‐axis (mean Y) value is for the time range noted. The slope is the gain or loss of intensity over the duration of the time range for the calculated linear regression line of the data in this range. The area under the curve (AUC) is indicated by the grey stripes. Background of the calcium curve is shaded in pink. Post‐stimulant calcium response curve is shaded in purple.
Intracellular Ca2+ mobilization
CD56bright CD16dim/– NK cell Ca2+ flux showed significantly increased AUC in CFS/ME compared with controls after PregS (Fig. 4a). There was no significant difference in the AUC in CD56dimCD16+TRPM3+ NK cells (Fig. 4b). Overall, within both groups there was an increase in AUC after PregS stimulation compared with no stimulation.
Figure 4.
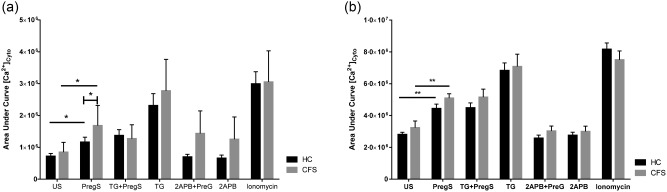
Cytoplasmic calcium in natural killer (NK) cells from HC and CFS/ME patients. (a) CD56bright CD16dim/– NK cell calcium flux response area under the curve. (b) CD56dimCD16+TRPM3+ NK cell calcium flux response area under the curve. Data are represented as mean ± standard error of the mean. Asterisks (*) and (**) represent statistical significance at P < 0·05 and P < 0·01, respectively. Abbreviations: US = unstimulated; PregS = pregnenolone sulphate; TG = thapsigargin; HC = healthy controls; CFS/ME = chronic fatigue syndrome/myalgic encephalomyelitis.
NK cytotoxic activity
NK cells demonstrated significantly increased cytotoxic activity when stimulated with TG + PregS in CFS/ME compared with the HC group. No significant between‐group differences were seen with PregS, ionomycin and 2APB (Fig. 5).
Figure 5.
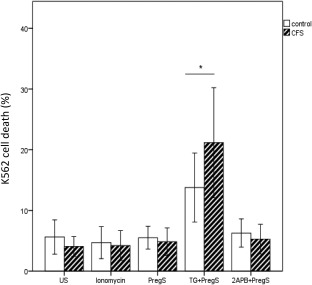
Natural killer (NK) cell cytotoxic activity after incubation with ionomycin, PregS, TG + PregS and 2APB + PregS in HC and CFS/ME. Note significant elevation of K562 cell death in CFS/ME following TG + PregS. Data are represented as mean ± standard error of the mean. Asterisk (*) represents statistical significance at P < 0·05. PregS = pregnenolone sulphate; 2‐APB = 2‐aminoethoxydiphenyl borate; TG = thapsigargin; CFS/ME = chronic fatigue syndrome/myalgic encephalomyelitis.
Discussion
Previous investigations have reported significant reductions in NK cell cytotoxic activity in CFS/ME patients, and the current investigation supports those findings 16. The current investigation also confirms our previous results of significantly reduced TRPM3 receptors on NK cells as well as significantly reduced intracellular Ca2+ mobilization in isolated NK cells 16. The current investigation showed inhibition of the ER Ca2+/ATPase pump and depletion of intracellular Ca2+ stores followed by PregS‐activated TRPM3 increased cytotoxic activity in NK cells from CFS/ME patients (Fig. 6).
Figure 6.
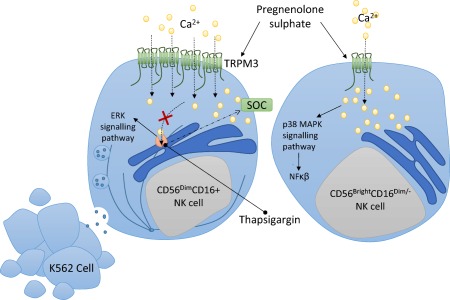
A conceptual natural killer (NK) model for chronic fatigue syndrome/myalgic encephalomyelitis (CFS/ME) patients. Pregnenolone sulphate (PregS) is a potent steroid that activated transient receptor potential melastatin 3 ion channels (TRPM3) on NK cell subsets. PregS in combination with thapsigargin elevated cytoplasmic calcium and is suggested to phosphorylate extracellular‐regulated kinase (ERK) 1/2 and polarization of secretory granules for degranulation in CD56dimCD16+ NK cells, resulting in target K562 cell death, whereas PregS‐stimulated CD56brightCD16dim/– NK cells may activate p38 MAPK signalling pathways involved in the nuclear factor kappa B (NF‐κβ) inflammatory immune response.
TRPM3 receptors are constitutively open 10, 12, 22 and are activated by steroids 15, hypotonic cell swelling and Ca2+ store depletion 10, but these findings are inconsistent 22. Our results support increased TRPM3 surface protein expression when intracellular Ca2+ stores are depleted through inhibition of the ER Ca2+/ATPase pump when activated by PregS.
Under no stimulation, CD56brightCD16dim/–TRPM3+ NK cells from CFS/ME demonstrated significantly lower TRPM3 surface expression compared with HC, which is consistent with previous findings 16. TRPM3 can be activated by PregS concentration in the range of 0·1–5 μM, corresponding to physiological PregS serum concentrations 23, 24. At 1·35 μM PregS (within physiological range), CD56brightCD16dim/–TRPM3+ NK cells did not change between groups. However, these cells increased intracellular Ca2+ significantly compared with HC. In comparison, PregS‐stimulated CD56dimCD16+ NK cells increased TRPM3 receptor expression significantly and may not be associated with Ca2+ flux in CFS/ME patients. This is based on the assumption that an increase in TRPM3 receptor should result in an increase in cytoplasmic Ca2+ levels. A possible rationale for this finding may be that TRPM3 ion channels expressed on CD56dimCD16+ NK cells have impaired Ca2+ flux function, which is compensated by increasing their surface expression. Moreover, it may be suggested that single nucleotide polymorphisms (SNPs) identified in TRPM3 genomic DNA from PBMCs and NK cells in CFS/ME patients result in impaired protein expression and reduced TRPM3 Ca2+ function 17. Importantly, when Ca2+ influx is prevented or reduced, an immunological synapse is not formed, preventing the formation of mitotic spindles for cytoskeleton movement to facilitate the secretory vesicles leading to abnormal lysis of target cells 25. The deficits identified above may thus contribute to impaired lysis of CFS/ME NK cells.
Interestingly, our study supports the finding that ionomycin alone does not improve NK cytotoxic activity, but it elevates TRPM3 expression on CD56dimCD16+ NK cells compared with HC. TRPM3 expression is increased when ionomycin raises cytosolic Ca2+ through phospholipase C‐dependent mobilization of Ca2+ stores 26. Prolonged treatment with ionomycin has been reported previously to render NK cells hyporesponsive, and hence these cells probably require a higher signal intensity to mount an effective response 27.
CFS/ME patients have significantly decreased extracellular‐regulated kinase (ERK) 1/2 in CD56dimCD16+ NK cells and significantly increased mitogen‐activated protein kinase kinase (MEK) 1/2 and p38 in CD56brightCD16dim/– NK cells following incubation with K562 cells 28. ERK 1/2 is activated in a P13K‐dependent manner that may also be associated with cytoplasmic Ca2+ ion levels through activation of TRPM3 10. In the absence of phosphatidylinositol biphosphate TRPM3 is not activated, resulting in reduced cytosolic Ca2+ 29. Stimulating CD56dimCD16+ NK cells with TG prior to PregS resulted in a significant elevation in cytotoxic activity. These findings are noteworthy, as it has been reported that depleting intracellular stores with TG increases activity of ERK. Phosphorylation of ERK 1/2 allows polarization of secretory granules for degranulation and therefore increased NK cell lysis in CFS patients 30, 31, 32.
CFS/ME patients have been reported to have a significant reduction in CD69 expression on T cells and NK cells upon stimulation, which may correspond to impaired initial cell activation through a PKC‐dependent signalling pathway 6. However, this current investigation found no significant difference between groups. In vitro, degranulation is activated in NK cells when an immunosynapse is formed between NK cells and K562 tumour cells 7, 33. During degranulation, cytolytic granules containing lytic proteins are released and CD107a receptors are expressed on the NK cell surface. In the current investigation CD107a was not significantly different between groups, and this finding is supported by others 28. PKC is activated by elevated intracellular Ca2+ concentration, which activates ERK signalling pathways and transcription factors 32, 34, 35. Inhibition of PKC has been shown to impaired signaling pathways that activate TRPM3‐induced transcription factor activator protein‐1 (AP‐1) 35. Our results also show that CD69 is reduced when NK cells are stimulated with TG. However, in combination with PregS stimulation, which facilitates an increase in cytoplasmic Ca2+ and activates PKC and ERK signalling pathways, NK cell cytotoxic activity in CFS/ME patients increased.
The current investigation confirms our previous reports of significant changes in TRPM3 receptor numbers in NK cells in CFS/ME. Following PregS stimulation, however, there was no significant increase in Ca2+ mobilization in CD56dimCD16+ NK cells from CFS/ME patients. These novel findings suggest that TRPM3 receptor function is impaired, resulting in impaired Ca2+ mobilization with adverse consequences for homeostasis. As TRPM3 receptors are expressed throughout the human body, the current findings suggest that impaired TRPM3 function may play a significant role in the multisystemic pathomechanism of CFS/ME. Other TRP receptors, such as TRPM1, may possibly have a similar role in CFS/ME pathomechanism due to its sequence homology with TRPM3; however, further investigation is warranted 36. We have previously identified genomic changes in other TRPs and autonomic receptors, which should be investigated further 17, 37, 38.
The results of this study are considered preliminary, and are limited by our small sample size. Accordingly, we found that our CFS/ME patients were older compared with HC; however, routine pathological screening showed no difference between groups. As CFS/ME is a heterogeneous condition, future directions aim to optimize these findings in a larger cohort. In this pilot study, we characterized our CFS/ME patients by reduced NK cytotoxic activity compared with HC. We further aimed to capture those with significant functional impairment according to SF‐36 and WHO DAS 2.0 disability scores. To define further the role of TRPM3 and Ca2+, future study will examine findings in distinct clinical phenotypes of CFS/ME to elucidate the distinct physiological effects of this mechanism.
Conclusions
TRPM3 activity and function in NK cells in CFS/ME patients is impaired, resulting in changes in Ca2+ ion concentration in the cytosol and intracellular stores which may, in turn, change the NK cells' activation threshold. Cytotoxic NK cells from CFS/ME patients may attempt to compensate for impaired TRPM3 receptors by increasing intracellular Ca2+ for sufficient NK cell activity. Increasing Ca2+ concentrations to activate the ERK signalling pathway may help to improve NK cell cytotoxicity in CFS/ME. Improvement of Ca2+‐dependent NK activity may help to improve the immune system in CFS/ME patients to facilitate a quicker response to eliminate pathogens. Moreover, improvement of cell‐to‐cell interaction could improve the development of antigen‐specific memory cells. This investigation may inform the pathomechanism of reduced NK cell cytotoxicity in CFS/ME patients.
Disclosure
The authors declare that they have no disclosures.
Supporting information
Additional supporting information may be found in the online version of this article at the publisher's web‐site
Fig. S1. NK cell CD69 expression in HC and CFS/ME patients. A. CD56BrightCD16Dim/− NK cells expressed CD69 as cells/ml under various conditions including PregS, TG, 2APB and ionomycin. B. CD56DimCD16+ NK cell expressed TRPM3 as cells/ml under various conditions including PregS, TG, 2APB and ionomycin. Data are represented as Mean with SEM. Asterisk (*) represents statistical significance at P < (0.05). Abbreviations: US: Unstimulated, PregS: Pregnenolone sulphate, TG: Thapsigargin, HC: Healthy controls, CFS/ME: Chronic Fatigue Syndrome/Myalgic Encephalomyelitis.
Acknowledgements
This study was supported by funding from the Stafford Fox Medical Research Foundation, Change for ME Charity, Alison Hunter Memorial Foundation, Mason Foundation and Queensland Co‐Investment Program.
References
- 1. Carruthers BM, van de Sande MI, De Meirleir KL et al Myalgic encephalomyelitis: international consensus criteria. J Intern Med 2011; 270:327–38. [DOI] [PMC free article] [PubMed] [Google Scholar]
- 2. Fukuda K, Straus SE, Hickie I, Sharpe MC, Dobbins JG, Komaroff A. The chronic fatigue syndrome: a comprehensive approach to its definition and study. International Chronic Fatigue Syndrome Study Group. Ann Intern Med 1994; 121:953–9. [DOI] [PubMed] [Google Scholar]
- 3. Stayer D, Scott V, Carter W. Low NK cell activity in chronic fatigue syndrome (CFS) and relationship to symptom severity. J Clin Cell Immunol 2015; 6:348. [Google Scholar]
- 4. Draghi M, Yawata N, Gleimer M, Yawata M, Valiante NM, Parham P. Single‐cell analysis of the human NK cell response to missing self and its inhibition by HLA class I. Blood 2005; 105:2028–35. [DOI] [PubMed] [Google Scholar]
- 5. Borrego F, Pena J, Solana R. Regulation of CD69 expression on human natural killer cells: differential involvement of protein kinase C and protein tyrosine kinases. Eur J Immunol 1993; 23:1039–43. [DOI] [PubMed] [Google Scholar]
- 6. Mihaylova I, DeRuyter M, Rummens JL, Bosmans E, Maes M. Decreased expression of CD69 in chronic fatigue syndrome in relation to inflammatory markers: evidence for a severe disorder in the early activation of T lymphocytes and natural killer cells. Neuro Endocrinol Lett 2007; 28:477–83. [PubMed] [Google Scholar]
- 7. Alter G, Malenfant JM, Altfeld M. CD107a as a functional marker for the identification of natural killer cell activity. J Immunol Methods 2004; 294:15–22. [DOI] [PubMed] [Google Scholar]
- 8. Schwarz EC, Qu B, Hoth M. Calcium, cancer and killing: the role of calcium in killing cancer cells by cytotoxic T lymphocytes and natural killer cells. Biochim Biophys Acta 2013; 1833:1603–11. [DOI] [PubMed] [Google Scholar]
- 9. Nilius B. TRP channels in disease. Biochim Biophys Acta 2007; 1772:805–12. [DOI] [PubMed] [Google Scholar]
- 10. Lee N, Chen J, Sun L et al Expression and characterization of human transient receptor potential melastatin 3 (hTRPM3). J Biol Chem 2003; 278:20890–7. [DOI] [PubMed] [Google Scholar]
- 11. Oberwinkler J, Philipp SE. TRPM3. Handbook of experimental pharmacology 2014; 222:427–59. [DOI] [PubMed] [Google Scholar]
- 12. Oberwinkler J, Lis A, Giehl KM, Flockerzi V, Philipp SE. Alternative splicing switches the divalent cation selectivity of TRPM3 channels. J Biol Chem 2005; 280:22540–8. [DOI] [PubMed] [Google Scholar]
- 13. Fruhwald J, Camacho Londono J, Dembla S et al Alternative splicing of a protein domain indispensable for function of transient receptor potential melastatin 3 (TRPM3) ion channels. J Biol Chem 2012; 287:36663–72. [DOI] [PMC free article] [PubMed] [Google Scholar]
- 14. Nilius B, Voets T. A TRP channel‐steroid marriage. Nat Cell Biol 2008; 10:1383–4. [DOI] [PubMed] [Google Scholar]
- 15. Harteneck C. Pregnenolone sulfate: from steroid metabolite to TRP channel ligand. Molecules 2013; 18:12012–28. [DOI] [PMC free article] [PubMed] [Google Scholar]
- 16. Nguyen T, Staines D, Nilius B, Smith P, Marshall‐Gradisnik S. Novel identification and characterisation of transient receptor potential melastatin 3 ion channels on natural killer cells and B lymphocytes: effects on cell signalling in chronic fatigue syndrome/myalgic encephalomyelitis patients. Biol Res 2016; 49:27. [DOI] [PMC free article] [PubMed] [Google Scholar]
- 17. Marshall‐Gradisnik S, Huth T, Chacko A, Johnston S, Smith P, Staines D. Natural killer cells and single nucleotide polymorphisms of specific ion channels and receptor genes in myalgic encephalomyelitis/chronic fatigue syndrome. Appl Clin Genet 2016; 9:39–47. [DOI] [PMC free article] [PubMed] [Google Scholar]
- 18. Aubry JP, Blaecke H, Lecoanet‐Henchoz S et al Annexin V used for measuring apoptosis in the early events of cellular cytotoxicity. Cytometry 1999; 37:197–204. [DOI] [PubMed] [Google Scholar]
- 19. Johnston SC, Brenu EW, Hardcastle SL et al. A comparison of health status in patients meeting alternative definitions for chronic fatigue syndrome/myalgic encephalomyelitis. Health Qual Life out 2014; 12:64. [DOI] [PMC free article] [PubMed] [Google Scholar]
- 20. Jason LA, Evans M, Brown M et al Fatigue scales and chronic fatigue syndrome: issues of sensitivity and specificity. Disabil Stud Q 2011; 31:1375. [PMC free article] [PubMed] [Google Scholar]
- 21. Reeves WC, Jones JF, Maloney E et al Prevalence of chronic fatigue syndrome in metropolitan, urban, and rural Georgia. Popul Health Metr 2007; 5:5. [DOI] [PMC free article] [PubMed] [Google Scholar]
- 22. Grimm C, Kraft R, Sauerbruch S, Schultz G, Harteneck C. Molecular and functional characterization of the melastatin‐related cation channel TRPM3. J Biol Chem 2003; 278:21493–501. [DOI] [PubMed] [Google Scholar]
- 23. Vriens J, Owsianik G, Hofmann T et al TRPM3 is a nociceptor channel involved in the detection of noxious heat. Neuron 2011; 70:482–94. [DOI] [PubMed] [Google Scholar]
- 24. Majeed Y, Agarwal AK, Naylor J et al Cis‐isomerism and other chemical requirements of steroidal agonists and partial agonists acting at TRPM3 channels. Br J Pharmacol 2010; 161:430–41. [DOI] [PMC free article] [PubMed] [Google Scholar]
- 25. Mace EM, Dongre P, Hsu HT et al Cell biological steps and checkpoints in accessing NK cell cytotoxicity. Immunol Cell Biol 2014; 92:245–55. [DOI] [PMC free article] [PubMed] [Google Scholar]
- 26. Dedkova EN, Sigova AA, Zinchenko VP. Mechanism of action of calcium ionophores on intact cells: ionophore‐resistant cells. Membr Cell Biol 2000; 13:357–68. [PubMed] [Google Scholar]
- 27. Romera‐Cardenas G, Thomas LM, Lopez‐Cobo S, Garcia‐Cuesta EM, Long EO, Reyburn HT. Ionomycin treatment renders NK cells hyporesponsive. PLOS ONE 2016; 11:e0150998. [DOI] [PMC free article] [PubMed] [Google Scholar]
- 28. Huth TK, Staines D, Marshall‐Gradisnik S. ERK1/2, MEK1/2 and p38 downstream signalling molecules impaired in CD56 dim CD16+ and CD56 bright CD16 dim/– natural killer cells in chronic fatigue syndrome/myalgic encephalomyelitis patients. J Transl Med 2016; 14:97. [DOI] [PMC free article] [PubMed] [Google Scholar]
- 29. Toth BI, Oberwinkler J, Voets T. Phosphoinositide regulation of TRPM channels – TRPM3 joins the club! Channels (Austin) 2016; 10:83–5. [DOI] [PMC free article] [PubMed] [Google Scholar]
- 30. Wei S, Gamero AM, Liu JH et al Control of lytic function by mitogen‐activated protein kinase/extracellular regulatory kinase 2 (ERK2) in a human natural killer cell line: identification of perforin and granzyme B mobilization by functional ERK2. J Exp Med 1998; 187:1753–65. [DOI] [PMC free article] [PubMed] [Google Scholar]
- 31. Chen X, Trivedi PP, Ge B, Krzewski K, Strominger JL. Many NK cell receptors activate ERK2 and JNK1 to trigger microtubule organizing center and granule polarization and cytotoxicity. Proc Natl Acad Sci USA 2007; 104:6329–34. [DOI] [PMC free article] [PubMed] [Google Scholar]
- 32. Maloney JA, Tsygankova OM, Yang L et al Activation of ERK by Ca2+ store depletion in rat liver epithelial cells. Am J Physiol 1999; 276:C221–30. [DOI] [PubMed] [Google Scholar]
- 33. Shabrish S, Gupta M, Madkaikar M. A modified NK cell degranulation assay applicable for routine evaluation of NK cell function. J Immunol Res 2016; 2016:3769590. [DOI] [PMC free article] [PubMed] [Google Scholar]
- 34. Rubil S, Rossler OG, Thiel G. CREB, AP‐1, ternary complex factors and MAP kinases connect transient receptor potential melastatin‐3 (TRPM3) channel stimulation with increased c‐Fos expression. Br J Pharmacol 2016; 173:305–18. [DOI] [PMC free article] [PubMed] [Google Scholar]
- 35. Lesch A, Hui X, Lipp P, Thiel G. Transient receptor potential melastatin‐3 (TRPM3)‐induced activation of AP‐1 requires Ca2+ ions and the transcription factors c‐Jun, ATF2, and ternary complex factor. Mol Pharmacol 2015; 87:617–28. [DOI] [PubMed] [Google Scholar]
- 36. Lambert S, Drews A, Rizun O et al Transient receptor potential melastatin 1 (TRPM1) is an ion‐conducting plasma membrane channel inhibited by zinc ions. J Biol Chem 2011; 286:12221–33. [DOI] [PMC free article] [PubMed] [Google Scholar]
- 37. Marshall‐Gradisnik S, Huth T, Chacko A, Johnston S, Smith P, Staines D. Natural killer cells and single nucleotide polymorphisms of specific ion channels and receptor genes in myalgic encephalomyelitis/chronic fatigue syndrome. Appl Clin Genet 2016; 9:39–47. [DOI] [PMC free article] [PubMed] [Google Scholar]
- 38. Marshall‐Gradisnik SM, Smith P, Brenu EW, Nilius B, Ramos SB, Staines DR. Examination of single nucleotide polymorphisms (SNPs) in transient receptor potential (TRP) ion channels in chronic fatigue syndrome patients. Immunol Immunogenet Insights 2015; 7: 1–6. [Google Scholar]
Associated Data
This section collects any data citations, data availability statements, or supplementary materials included in this article.
Supplementary Materials
Additional supporting information may be found in the online version of this article at the publisher's web‐site
Fig. S1. NK cell CD69 expression in HC and CFS/ME patients. A. CD56BrightCD16Dim/− NK cells expressed CD69 as cells/ml under various conditions including PregS, TG, 2APB and ionomycin. B. CD56DimCD16+ NK cell expressed TRPM3 as cells/ml under various conditions including PregS, TG, 2APB and ionomycin. Data are represented as Mean with SEM. Asterisk (*) represents statistical significance at P < (0.05). Abbreviations: US: Unstimulated, PregS: Pregnenolone sulphate, TG: Thapsigargin, HC: Healthy controls, CFS/ME: Chronic Fatigue Syndrome/Myalgic Encephalomyelitis.