

Summary
Various complement‐mediated renal disorders are treated currently with the complement inhibitor eculizumab. By blocking the cleavage of C5, this monoclonal antibody prevents cell damage caused by complement‐mediated inflammation. We included 23 patients with atypical haemolytic uraemic syndrome (aHUS, n = 12), C3 glomerulopathies (C3G, n = 9) and acute antibody‐mediated renal graft rejection (AMR, n = 2), treated with eculizumab in 12 hospitals in Germany. We explored the course of complement activation biomarkers and the benefit of therapeutic drug monitoring of eculizumab. Complement activation was assessed by analysing the haemolytic complement function of the classical (CH50) and the alternative pathway (APH50), C3 and the activation products C3d, C5a and sC5b‐9 prior to, 3 and 6 months after eculizumab treatment. Eculizumab concentrations were determined by a newly established specific enzyme‐linked immunosorbent assay (ELISA). Serum eculizumab concentrations up to 1082 μg/ml point to drug accumulation, especially in paediatric patients. Loss of the therapeutic antibody via urine with concentrations up to 56 μg/ml correlated with proteinuria. In aHUS patients, effective complement inhibition was demonstrated by significant reductions of CH50, APH50, C3d and sC5b‐9 levels, whereas C5a levels were only reduced significantly after 6 months' treatment. C3G patients presented increased C3d and consistently low C3 levels, reflecting ongoing complement activation and consumption at the C3 level, despite eculizumab treatment. A comprehensive complement analysis together with drug monitoring is required to distinguish mode of complement activation and efficacy of eculizumab treatment in distinct renal disorders. Accumulation of the anti‐C5 antibody points to the need for a patient‐orientated tailored therapy.
Keywords: biomarker, complement, drug monitoring, eculizumab, renal disease
Introduction
Atypical haemolytic uraemic syndrome (aHUS), C3 glomerulopathies (C3G) and antibody‐mediated renal graft rejection (AMR) are distinct entities within a wide spectrum of complement‐mediated renal disorders 1, 2. Complement activation may be the consequence of local [e.g. atypical haemolytic uraemic syndrome (aHUS)] or systemic dysregulation of the alternative complement pathway, as in C3 glomerulopathy (C3G)/dense deposit disease (DDD), and can often be attributed to either mutations of complement components and regulators or the presence of autoantibodies (e.g. anti‐factor H, C3 nephritic factor). The lack of effective alternative treatment has paved the way for the development of a specific complement targeting therapy 3, 4.
Eculizumab is a recombinant, monoclonal humanized immunoglobulin IgG4 antibody that targets the complement component C5 and inhibits the cleavage of C5, thereby preventing the generation of the anaphylatoxin C5a and the assembly of the terminal membrane attack complex C5b‐9 5, 6.
Treatment with eculizumab of paroxysmal nocturnal haemoglobulinuria (PNH) and aHUS has been approved by the Food and Drug Administration (FDA) and European Medicines Agency (EMA), but the use for other complement‐mediated renal disorders is still matter of ongoing research and clinical trials 5, 7, 8, 9. Long‐term results for up to 8 years, available for the treatment of PNH, indicate safety and efficacy 10, 11. Over time it has become possible to relate subpopulations of clinical non‐responders to eculizumab treatment to CR1 (CD35) gene polymorphism 12, C5 mutation 13 or haematological disorders such as bone marrow failure and underlying inflammatory condition 14. Variable responses to eculizumab therapy have also been reported for C3G 15 and AMR 16. Documented cases of recurrence of aHUS after discontinuation of eculizumab administration 5, 17, 18 reflect the unclear situation concerning the duration of treatment with eculizumab.
Laboratory monitoring of patients aiming to control the beneficial effect of eculizumab occurs usually with more traditional parameters, such as lactate dehydrogenase (LDH), haemoglobin (Hb), haptoglobin, platelet count and serum creatinine (sCr) 19.
Here we present an in‐depth complement activation analysis, including global functional assays such as CH50 and APH50 and C3, as well as activation products C3d, C5a and sC5b‐9 in a cohort of 23 patients with aHUS, C3G or AMR. In addition, we present data on eculizumab blood and urine concentrations in these patients measured by a newly established specific enzyme‐linked immunosorbent assay (ELISA), where we assessed the drug's inhibitory capacity by haemolytic assays and a functional ELISA (Wieslab®; Euro Diagnostica AB, Malmö, Sweden).
Material and methods
Patients and samples
Venous blood was drawn from patients for complement analysis prior (T0), 3 (T1) and 6 (T2) months ± 4 weeks post‐eculizumab treatment to obtain serum and ethylenediamine tetraacetic acid (EDTA)‐plasma, centrifuged at 4°C, aliquoted, frozen and stored at −70°C. In addition, urine samples from seven patients were obtained at various time‐points, including pre‐ and post‐dose. For dose inhibition analysis pooled normal human serum (NHS) of 10 healthy donors was used. The study was approved by the local ethics committee (approval number: S‐361/2013) and informed written consent was obtained from all patients or parents of paediatric patients. Samples were taken in accordance with the Declaration of Helsinki.
Laboratory analysis
Determination of the haemolytic activity of the classical pathway (CH50) and the alternative pathway (APH50) was performed according to described procedures by Mayer 20 and Joiner et al. 21, where defined sample dilutions are exposed to antibody‐sensitized sheep erythrocytes (shEA) or chicken erythrocytes, respectively. Results were expressed in reference to a pool of NHS as standard (100%). C5 titration was performed using C5‐depleted serum (Complement Technology, Inc., Tyler, TX, USA) and shEA. Haemolysis was measured by optical density (OD) at λ = 412 nm.
A modified CH50 was performed to assess the inhibitory activity of patients' urine. In brief, NHS was diluted 1 : 4 in urine samples followed by a second dilution of 1 : 10 in gelatin veronal‐buffered saline (GVBS++) containing 0·15 mM Ca2+ and 1 mM Mg2+, allowing complement activation of the classical pathway after adding shEA sensitized with amboceptor 6000 (ORLC25; Dade Behring, Marburg, Germany). Dilutions were prepared on ice followed by incubation for 60 min at 37°C in a shaking waterbath. Supernatant was obtained after 5 min centrifugation at 2012 g and the degree of haemolysis was measured with an ELISA reader by OD at λ = 412 nm.
To compare commonly used global complement assays, dose‐dependent inhibition of complement by eculizumab was also assessed by a functional complement ELISA (Wieslab® Complement system Screen COMPL 300; Euro Diagnostica AB), following the manufacturer's instructions.
C3 concentrations were determined by nephelometry (The Binding Site, Birmingham, UK). C3d levels were measured by double‐decker rocket immunoelectrophoresis assay, described by Brandslund et al. 22. C3 nephritic factor (C3nef) was determined in a functional assay applying patients' serum and measuring haemolysis of shEA by OD at λ = 412 nm according to the procedures described by Rother et al. 23. sC5b‐9 was assessed by ELISA using a monoclonal antibody against a neoepitope 24, as described previously 25.
C5a measurements were performed by Dr Riedemann (InflaRx GmbH, Jena, Germany), using an in‐house‐validated C5a ELISA. If not stated otherwise, reagents were purchased from Sigma (Taufkirchen, Germany). Purified anti‐human C5a antibodies were generated by InflaRx GmbH and coated at 0·5 µg/ml in carbonate buffer (pH 9·6) overnight at 4°C to a high binding polystyrene microtitre plate. After a washing step using 1 × phosphate‐buffered saline (PBS) containing 0·05% Tween 80, blocking buffer [2% heat‐inactivated fetal bovine serum (FBS) in 1 × PBS containing 0·05% Tween 80] was applied and incubated for 120 min at room temperature (RT). After the washing step, calibration samples (recombinant human C5a) and plasma samples were added and incubated for 90 min at RT. Two µg/ml of primary non‐labelled detection antibody (monoclonal mouse anti‐human C5/C5a antibody, clone 561; Hycult Biotech, Uden, the Netherlands) was applied subsequently for 60‐min incubation at RT. After the washing step, the secondary horseradish peroxidase (HRP)‐labelled antibody (goat anti‐mouse IgG2a polyclonal antibody; SouthernBioTech, Birmingham, AL, USA) was added and incubated for 30 min at RT. The plate was washed thereafter and incubated shielded from light with tetramethylbenzidine (TMB) substrate solution (Biozol, Eching, Germany) for 10 min at RT, and the colour reaction was stopped by 3·7 N sulphuric acid. The colour intensity was analysed at 450 nm with Tecan Infinite M200 reader using Magellan™ version 6.5 software. C5a contents in samples were quantitated after blank reduction using a non‐linear curve fit [four‐parameter Marquardt curve, log(x)/log(y)] for the results from the calibration samples.
Eculizumab measurements were performed by ELISA, for which polystyrene microtitre plates (Nunc, Roskilde, Denmark) were coated with 10 μg/ml purified human C5 (Complement Technology, Inc.) in carbonate buffer (pH 9·6) overnight at 4°C; 1% bovine serum albumin (BSA) in PBS was used to prevent unspecific binding. Serum, plasma and urine were added in appropriate dilutions using a buffer containing PBS, 0·1% Tween 20 (Serva, Heidelberg, Germany) and 10 mM EDTA (PBS‐Tween‐EDTA). Eculizumab, diluted in PBS‐Tween‐EDTA buffer, was taken as standard. A monoclonal mouse anti‐human IgG4 HRP‐conjugated detection antibody (A‐10654; Life Technologies, Darmstadt, Germany) was used (1 : 2000). Each incubation step was performed for 60 min at RT, after which the microtitre plate was washed three times with PBS containing 0·1% Tween 20 (PBS‐Tween). Incubation for 10 min at RT with o‐phenylenediamine (OPD) (Dakopatts, Glostrup, Denmark) and H2O2 30% (OPD/H2O2) as substrate was followed by adding 0·5 M H2SO4 to stop the reaction. The OD was read at λ = 492/690 nm.
The laboratory routine parameters platelet count, LDH, sCr and proteinuria were provided by the respective local departments of laboratory medicine. Individual genetic analysis was performed on request by the responsible physician according to the clinical condition and investigator's choice.
Statistical analysis
Calculation of eculizumab and sC5b‐9 concentrations were performed by using a Tecan Sunsrise™ ELISA reader and Magellan™ as data analysis software. GraphPad Prism version 5 software was used for statistical analysis. Student's t‐test was applied for validation of the eculizumab ELISA and inhibitory dose 50 (ID50) curves for unpaired values, and for complement activation biomarkers for paired (individual groups) and unpaired values (comparison between aHUS and C3G patients). Differences were considered to be significant for P < 0·05.
Results
Characterization of patients
The study included a total of 23 patients consisting of 12 aHUS [eight males, four females; median age 11 years (range = 1–21 years)], nine C3G [five males, four females; median age 21 years (range = 11–46 years)] and two AMR (one male, one female; aged 49 and 59 years) patients. Samples and data were collected from patients treated in various German hospitals from 2010 to 2014. Patient characteristics are described in Table 1. Patients 1–12 received eculizumab for treatment of aHUS. In this cohort, the most frequent mutation with a total of 42% occurred in fH or complement factor H‐related (CFHR) genes. Mutations of the membrane co‐factor protein (MCP) and C3 were detected in 17 and 8% of the aHUS patients, respectively; 33% had no known mutation. Patients 13–21 received eculizumab for treatment of C3G. Here, the predominant mutations (22%) affected the gene encoding C3. One patient presented with a combined mutation of fH and MCP, while in 56% of the C3G cohort, no known mutation could be determined and one patient did not undergo genetic work‐up. Patients 22 and 23 treated for AMR showed no mutation of complement genes.
Table 1.
Characterization of patients
| Patient no. | Age (years) | Sex | Diagnosis | Mutation/autoantibody | Age at Dx (years) | Range of eculizumab (mg/kg) | Current eculizumab treatment | CKD Stage | Kidney Tx | Current dialysis (D)/ plasma therapy (P) | Current clinical status |
|---|---|---|---|---|---|---|---|---|---|---|---|
| 1 | 21 | F | aHUS | None | 20 | 7–19 | No | 2 | 0 | No | Remission |
| 2 | 6 | M | aHUS | CFH: E 1198 stop/ a‐FH neg | < 1 | 16–17 | Yes | 5 | 1 | No | Remission |
| 3 | 1 | M | aHUS | CFH: p.Ala943HisfsX17/ a‐FH neg | < 1 | 55–61 | Yes | 2 | 0 | No | Remission |
| 4 | 17 | M | aHUS | None/ a‐FH neg | 14 | 22–23 | Yes | 2 | 1 | No | Remission |
| 5 | 20 | M | aHUS | C3: S179P, Exon 5/ a‐FH neg | 4 | 20 | Yes | 2 | 3 | D | Remission |
| 6 | 8 | M | aHUS | MCP: Exon 2 Codon 96c.286 + 2T>G (IVS2 + 2T>G)heterozygot/ a‐FH neg | 7 | 23–25 | Yes | 1 | 0 | No | Remission |
| 7 | 8 | F | aHUS | CFHR3/ a‐FH pos | 6 | 13–14 | No | 1 | 1 | No | Remission |
| 8 | 13 | M | aHUS | None/ a‐FH neg | 12 | 27 | Yes | 2 | 0 | No | Remission |
| 9 | 16 | F | aHUS | none/ a‐FH neg | 15 | 25 | Yes | 2 | 0 | No | Remission |
| 10 | 11 | M | aHUS | CFH: T2770A; Y899Stop/ a‐FH pos | < 1 | 20–27 | Yes | 1 | 0 | No | Remission |
| 11 | 10 | M | aHUS | MCP: c.1094C>T (p.Pro365Leu)/ a‐FH n.d. | 10 | 29 | No | 5 | 0 | No | Remission |
| 12 | 4 | F | aHUS | CFHR1/3 deletion/ a‐FH pos | 4 | 16 | Yes | 1 | 0 | No | Remission |
| 13 | 21 | M | C3GN; MPGN I | None/ C3nef neg | 19 | 11–12 | No | 1 | 0 | No | Partial remission |
| 14 | 13 | M | C3GN; MPGN I | None/ C3nef +/‐ | 10 | 24 | No | 1 | 0 | No | Relapse |
| 15 | 11 | F | DDD; MPGN II | None/ C3nef pos | 7 | 22–23 | No | 0 | 0 | No | Remission |
| 16 | 20 | M | DDD; MPGN II | Not tested/ C3nef pos | 20 | 17–23 | No | 3 | 1 | No | Relapse |
| 17 | 30 | M | C3GN; MPGN I | C3: c.2531A>G p.Gln844Arg/ C3nef neg | 24 | 15 | No | 3 | 0 | No | Relapse |
| 18 | 17 | F | C3GN; MPGN I | None/ C3nef pos | 15 | 18–19 | Yes | 1 | 0 | No | Partial remission |
| 19 | 46 | F | C3GN; MPGN I | C3: c.2770 G>T (p.Gly924Cys)/ C3nef neg | 18 | 16 | Yes | 3 | 1 | No | Remission |
| 20 | 15 | F | DDD; MPGN II | None/ C3nef neg | 14 | 22 | Yes | 4 | 0 | No | Remission |
| 21 | 13 | M | C3GN; MPGN I | CFH‐H1; MCP‐H1/ C3nef pos | 12 | 21 | Yes | 1 | 0 | No | Partial remission |
| 22 | 59 | F | AMR | None/ C3nef n.d. | 58 | 14 | Yes | 3 | 1 | No | Remission |
| 23 | 48 | M | AMR | None/ C3nef neg | 48 | 10–13 | Yes | 2 | 2 | No | Remission |
CKD stage = chronic kidney disease stages 1–‐5 according to the National Kidney Foundation; aHUS = atypical haemolytic uraemic syndrome; C3GN = C3 glomerulonephritis; MPGN = membrano‐proliferative glomerulonephritis; DDD = dense deposit disease; C3nef = C3 nephritis factor; a‐FH = autoantibody against fH; AMR = antibody‐mediated rejection; n.d.=not done; Tx = transplantation; CFH =complement factor H; MCP = membrane co‐factor protein; M = male; F = female.
Establishment of the eculizumab ELISA
Intra‐ and interassay coefficients of variability of the eculizumab ELISA were 5·2 and 13·3% for 12 and 30 repetitions, respectively. Recovery analysis was performed by spiking eculizumab at different concentrations into NHS or buffer with rates of 87·2 ± 9·8% [mean ± standard deviation (s.d.)] for titration into NHS and of 104·8 ± 16·6% into buffer (Fig. 1a). The lower recovery rate in NHS compared to buffer, indicating the measurement of free eculizumab, can be explained partially by eculizumab binding to C5, for which a concentration of approximately 70 μg/ml in human plasma has been reported 5. For a selected group of patients, eculizumab levels were determined in serum and plasma with no significant difference in concentration (data not shown). Hence, whenever possible, serum eculizumab levels were determined and only in those cases with a restricted amount of serum was plasma used. In a second recovery assay, the binding of eculizumab not only to C5 but also to sC5b‐9 could be demonstrated. At the molar ratios of 1 : 2 and 1 : 4, a significant lower recovery of free eculizumab in the presence of C5 indicates a stronger interaction between C5 than that of sC5b‐9 with eculizumab (Fig. 1b).
Figure 1.
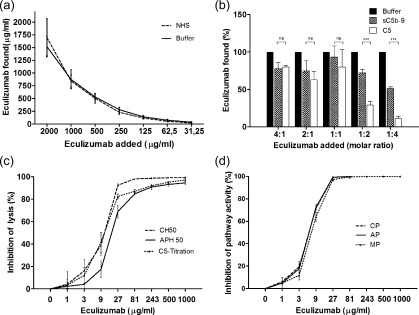
Validation of enzyme‐linked immunosorbent assay (ELISA) for measurement of eculizumab in serum and inhibitory dose curves. Eculizumab was spiked into normal human serum (NHS) or buffer at different concentrations and mean recovery rates of 87·2 ± 9·8% for NHS and 104·8 ± 16·6% for buffer were determined by ELISA (n = 3; a). Concentration of free eculizumab is reduced by titrating eculizumab into purified 5 nM C5 or sC5b‐9 solutions (n = 3; b). At the molar ratios of 1 : 2 and 1 : 4 a significant lower recovery of free eculizumab in the presence of C5 compared to sC5b‐9 could be shown. Inhibitory dose 50 (ID50) was assessed employing tests for the haemolytic activity of the classical pathway (CH50; 10·1 ± 1·7 μg/ml), the alternative pathway (APH50; 18·5 ± 2·9 μg/ml) and of C5 (10·7 ± 1·4 μg/ml) (n = 3; c). ID50 values are also shown for the functional ELISA assessing activity of the classical (CP; 5·9 ± 0·4 μg/ml), the alternative (AP; 5·9 ± 0·3 μg/ml) and the lectin pathway (MP; 7·1 ± 0·5 μg/ml) (n = 3; d). Statistical analysis was performed by Student's t‐test for unpaired values using Prism version 5 software; *P < 0·05; **P < 0·01.
Dose inhibition analysis of complement activation pathways
Dose inhibition analysis was performed to determine the dose‐dependent decrease of haemolytic activity of NHS by eculizumab (Fig. 1c). ID50 values were found to be 10·1 ± 1·7 μg/ml (mean ± s.d.) and 18·5 ± 2·9 μg/ml for the haemolytic assays CH50 and APH50, respectively. ID50 for C5 haemolytic function was found to be 10·7 ± 1·4 μg/ml, comparable to the value of CH50. Applying the functional complement ELISA (Wieslab assay), ID50 values for all three complement pathways were lower and comparable for the classical pathway (5·9 ± 0·4 μg/ml), for the alternative pathway (5·9 ± 0·3 μg/ml) and for the lectin pathway (7·1 ± 0·5 μg/ml; Fig. 1d).
Complement activation biomarkers in the course of eculizumab treatment
Comparing pretreatment complement activation biomarkers in aHUS and C3G patients to those in samples drawn 3 (T1) and 6 (T2) months after initiation of eculizumab therapy revealed a significant complement inhibition. At T1, in aHUS patients low to non‐detectable haemolytic activity of the classical (CH50, P = 0·001, Fig. 2a) and the alternative pathways (APH50, P = 0·002, Fig. 2b) indicated sufficient inhibitory capacity of eculizumab in the circulation, whereas the in‐vivo effect was reflected by a decrease of the plasma activation products C3d (P = 0·005, Fig. 2d) and sC5b‐9 (P = 0·02, Fig. 2e). During the same period, C3 remained stable in the aHUS cohort (Fig. 2c). Comparable results of complement activation biomarkers with successful inhibition of complement function in the haemolytic assays CH50 and APH50, stabilizing C3 levels and of decreasing sC5b‐9 levels as eculizumab levels increase were observed in patients treated for AMR (Fig. 3g–i). In C3G patients at T1, a significant reduction of CH50 (P = 0·03) and sC5b‐9 (P = 0·006) was observed, accompanied, however, by a significant increase of C3d over time (P = 0·008, Fig. 2a,d,e). Continuously low C3 while increasing C3d levels over the observation period reflect ongoing activation on the C3 level in the C3G cohort (Fig. 2c,d).
Figure 2.
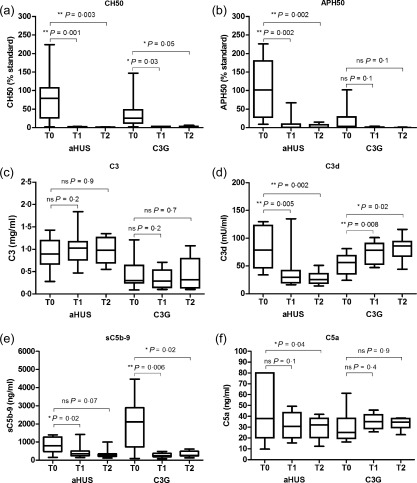
Comparison of complement activation parameters before (T0), after 3 (T1) and 6 (T2) months ± 4 weeks of eculizumab treatment of atypical haemolytic uraemic syndrome (aHUS) and C3 glomerulopathies (C3G) patients. Haemolytic activity compared to the haemolytic activity of standard normal human serum (NHS) of the classical (CH50; a) and the alternative pathway (APH50; b), and C3 (c), C3d (d), sC5b‐9 (e) and C5a (f) are demonstrated in 12 aHUS and nine C3G patients. Comparing pre‐ and under eculizumab treatment complement activation biomarkers significant decrease can be shown on the basis of CH50, APH50, C3d and sC5b‐9 for aHUS. In C3G patients, significant reduction of CH50 and sC5b‐9 while significant increase of C3d over time can be demonstrated. Contrasting pretreatment complement activation parameters in the groups of aHUS and C3G, significant differences can be shown for APH50 (P = 0·007), C3 (P = 0·01), C3d (P = 0·05) and sC5b‐9 (P = 0·02), indicating stronger complement consumption in C3G patients. Continuously low C3 while increasing C3d levels reflect ongoing activation on the C3 level in C3G. Statistical analysis was performed by Student's t‐test for paired (individual groups) and unpaired values (comparison aHUS to C3G patients) using Prism version 5 software; *P < 0·05; **P < 0·01.
Figure 3.
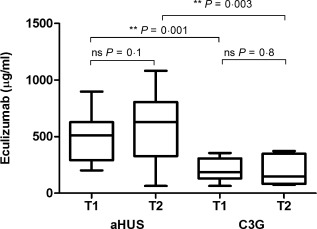
Detection of eculizumab in serum from 12 atypical haemolytic uraemic syndrome (aHUS) and nine C3 glomerulopathies (C3G) patients after 3 (T1) and 6 (T2) months. Eculizumab serum concentrations were significantly higher in the aHUS compared to C3G at T1 (P = 0·001) and at T2 (P = 0·003). Statistical analysis was performed by Student's t‐test for paired (individual) groups and unpaired groups (comparison of aHUS and C3G) using Prism version 5 software; *P < 0·05; **P < 0·01.
In contrast to aHUS, pretreatment APH50 values were significantly lower in C3G patients prior to eculizumab treatment, indicating continuous complement consumption (P = 0·007, Fig. 2b). In those patients, C3 levels were also significantly lower (P = 0·01, Fig. 2c). C3d levels decreased under treatment for aHUS, but remained elevated for C3G (Fig. 2d). Before initiation of eculizumab therapy C3G patients showed significantly higher levels of sC5b‐9 than aHUS patients (P = 0·02, Fig. 2e). Most patients responded with a significant decrease of sC5b‐9 levels post‐treatment, although in a few aHUS patients elevated or even increasing sC5b‐9 levels were seen (e.g. patients 2 and 3). Despite a remarkable reduction of sC5b‐9 levels, three of nine C3G patients experienced a clinical relapse of the disease (patients 14, 16 and 17) and another three of nine remained in partial remission (patients 13, 18 and 21). In most patients, low C3 and elevated C3d levels indicated ongoing complement activation. Five patients in the C3G cohort were tested positive or borderline positive for C3nef, while four patients were negative.
In aHUS patients, a significant decrease of C5a was observed after 6 months of eculizumab treatment (P = 0·04, Fig. 2f) but not after 3 months, and C5a levels stayed within or above the normal range of healthy controls despite a complete inhibition of C5b‐9 formation, as indicated by the strongly reduced CH50 and APH50 levels. Surprisingly, despite the high levels of sC5b‐9, C5a in the C3G cohort was not elevated prior to initiation of eculizumab and there was no significant change under treatment (Fig. 2f). There was no correlation of C5a to sC5b‐9 in aHUS patients (P = 0·06, r = 0·36) or in C3G patients (P = 0·46, r = −0·17). Interference between eculizumab and the established and validated C5a‐ELISA was analysed and could be ruled out (data not shown).
Laboratory routine parameters
In aHUS patients at T1, a significant decline of sCr (P = 0·03) and an increase of platelet count (P = 0·003) were observed. Although in aHUS patients LDH levels showed a strong tendency to decrease at T1 (P = 0.05), a significant reduction was achieved only at T2 (P = 0·02). In the C3G cohort, sCr improved significantly (P = 0.049), whereas no significant change of proteinuria, platelet count or LDH could be observed (Supporting information, Fig. S1).
Urinary analysis
Pre‐ and post‐dose urine samples were available from seven of the 23 patients. Here, eculizumab concentration ranged from 0·01 to 56·0 μg/ml. No correlation was found between the respective blood and urine drug concentrations (Supporting information, Fig. S2a,b), but urine eculizumab levels correlated with the degree of proteinuria (P = 0·002, r = 0·88; Supporting information, Fig. S2d). We therefore extended the analysis to 10 patients treated with eculizumab, including three individuals not discussed otherwise in this cohort of 23 patients. Inhibition of haemolytic activity by urinary eculizumab was dose‐dependent (P = 0·005, r = 0·73; Supporting information, Fig. S2c).
Drug monitoring of eculizumab
Eculizumab serum concentrations were significantly higher in the aHUS group (mean ± s.d., T1: 508 ± 64 µg/ml; T2: 609 ± 98 µg/ml) compared to C3G (T1: 206 ± 33 µg/ml; T2: 200 ± 47 µg/ml), reflecting the higher body weight dosage in aHUS patients (aHUS: 24·0 ± 11·9 mg/kg; C3G: 16·3 ± 6·7 mg/kg; Fig. 3, Table 1). Drug levels ranged from 64 to 1082 μg/ml, and paediatric aHUS patients in particular showed a tendency for drug accumulation.
Follow‐up of individual patients
Patients 6, 13 and 23 are presented in more detail as examples for each clinical entity of aHUS, C3G and AMR, reflecting typical complement biomarker and eculizumab drug monitoring profiles observed in the majority of all patients presented.
In the 8‐year‐old patient 6, HUS manifested at the age of 5 years coincident with a rotavirus gastroenteritis, but resolved with symptomatic therapy. A second bout started with bloody diarrhoea at the age of 7, followed by acute renal failure requiring haemodialysis. Because of low C3 levels and normal ADAMTS13 activity, therapy was initiated with 600 mg eculizumab per week for the first 3 weeks, followed by 900 mg every 2 weeks for the next 5 months. Beginning with week 22, treatment was reduced to 600 mg for 2 weeks, followed by 900 mg every 3 weeks. Monitoring of eculizumab in serum showed a clear correlation to the therapy regimen, indicating accumulation of trough levels above 900 μg/ml until week 22. Drug levels returned to approximately 400 μg/ml after interval extension to once every 3 and later once every 4 weeks which could be performed safely (Fig. 4a–c). After an initial drastic increase of sC5b‐9, this parameter normalized as eculizumab therapy was continued and correlated inversely with eculizumab serum concentrations (Fig. 4a). While the haemolytic activity of the classical pathway was constantly undetectable under treatment, a remaining haemolytic activity of the alternative pathway was observed, with APH50 values up to 20% (Fig. 4b). C3 levels rose and C3d decreased continuously as eculizumab was applied (Fig. 4c). The patient currently remains in remission under 1200 mg eculizumab once every 4 weeks.
Figure 4.
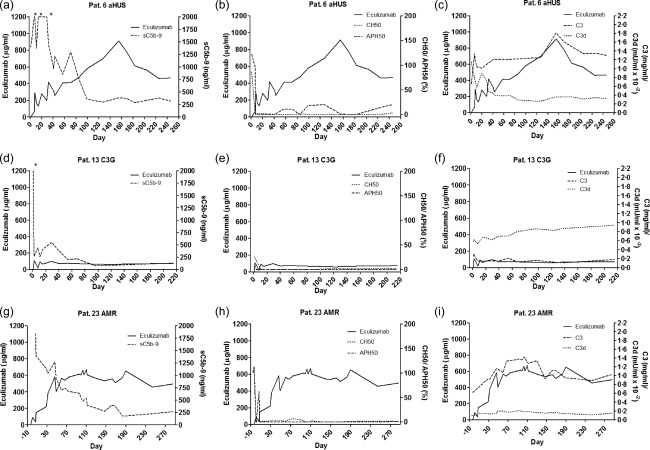
Follow‐up of individual atypical haemolytic uraemic syndrome (aHUS), C3 glomerulopathies (C3G) and antibody‐mediated renal graft rejection (AMR) patients. (a–c) The course of an aHUS patient (patient 6). sC5b‐9 (a), CH50 and APH50 (b) values decrease under eculizumab treatment, whereas C3 improves and C3d levels decrease (c). After 160 days, trough levels accumulate above 900 µg/ml and intervals are spread from 2 to 3 weeks. (d–f) The course of a C3G patient (patient 13). sC5b‐9 (d), CH50 and APH50 (f) values decrease immediately under eculizumab treatment, whereas C3 remains low and C3d increases (f). Throughout 220 days, trough levels remain around 80 µg/ml. (g–i) The course of a patient treated for AMR (patient 23). sC5b‐9 (g), CH50 and APH50 (h) values decrease under eculizumab treatment, whereas C3 and C3d levels remains stable (i). Comparable to the course of the aHUS patient, it takes several weeks for sC5b‐9 to fall below the reference level. After 70 days, trough levels accumulate above 500–600 µg/ml.
Patient 13 is a 21‐year‐old male, who was diagnosed with C3nef‐negative C3 glomerulonephritis (C3GN) [membranoproliferative glomerulonephritis (MPGN type I)] at the age of 17. Induction phase was performed with 600 mg eculizumab per week for the first 4 weeks, followed by 900 mg every 2 weeks. Throughout treatment, eculizumab serum trough levels stayed at approximately 80 μg/ml (Fig. 4d–f). As soon as eculizumab was applied, sC5b‐9 levels dropped and were below the reference value 2 months after the first eculizumab dose. Starting from low haemolytic activity (CH50, APH50) and C3 values before eculizumab initiation, indicating disease‐associated complement consumption, haemolytic activity of both the classical and the alternative pathways was abolished throughout the whole course of treatment (Fig. 4e). Despite a strong decrease of sC5b‐9, C3 levels remained very low whereas C3d increased, revealing continuous complement activation upstream of C5 (Fig. 4f). After 1 year of treatment this patient developed a relapse of disease, with extensive proteinuria, post‐dose eculizumab urine levels up to 56 µg/ml, serum trough levels below 10 µg/ml and increasing sC5b‐9 plasma levels. Therefore, eculizumab infusions were stopped and conventional immunosuppressive therapy was restarted with moderate clinical benefit.
Patient 23 is a 48‐year‐old male with suspected chronic glomerulonephritis (no biopsy performed; genetic complement disorders largely ruled out) who received a second renal transplant. The pretransplant IgG donor‐specific antibody (DSA) against human leucocyte antigen (HLA)‐DQ7 rose steadily despite rabbit anti‐thymocyte globulin (rATG) induction therapy, tacrolimus/mycophenolate mofetil/steroid maintenance treatment and prophylactic immunoadsorption. Transplant glomerulitis on day 18 post‐transplant was treated successfully with steroid pulses, intensified immunoadsorption, immunoglobulins and rituximab. However, even after bortezomib treatment, the mean fluorescence intensity of the anti‐HLA‐DQ7 DSA did not decline and eculizumab treatment was initiated successfully 6 weeks post‐kidney transplantation upon rATG‐resistant biopsy‐proven AMR with 900 mg/week for the first 4 weeks. Because of recurrent acute AMR on day 80 post‐transplant, an increased dose of 1200 mg/week was administered successfully for the next 5 months. After application of 900 mg/week for 2 months, treatment has been tapered further to currently once every 12 days with ongoing long‐term stable graft function. Figure 4g draws a clear picture showing how sC5b‐9 levels decreased continuously as eculizumab was administered, remaining below the reference value after a period of 6 months. Haemolytic activity of both pathways was blocked completely at most time‐points and C3 levels remained normal throughout the course with no elevation of C3d (Fig. 4h,i).
Discussion
While the application of eculizumab is expanding constantly as a valuable treatment option for complement‐mediated disorders, a comprehensive analysis of its inhibitory effect on complement is performed rarely due to the common restrictions of studying a population of orphan diseases with low prevalence, which also certainly limits our findings.
In 18 aHUS patients, safe eculizumab interval extension up to once every 4 weeks under monitoring of activity of the classical and alternative pathway without recurrence of disease has been reported recently 26. In contrast, relapse occurred in three of 10 aHUS patients upon eculizumab discontinuation, followed only by urinary dipstick measurements at home requiring restart of eculizumab treatment 18. In certain cases, which still need to be defined, discontinuation of eculizumab therapy appears possible if regular monitoring and careful education of patients ensures immediate re‐initiation of therapy in case of relapse 27.
Volokhina et al. observed normal complement activation patterns in aHUS patients in remission 28. In contrast, Noris et al. found elevated sC5b‐9 levels to be independent from disease activity, and proposed an endothelial cell‐based C5b‐9 deposition assay to monitor aHUS patients' complement activity more accurately 29.
In most of our 23 cases of aHUS, C3G and AMR patients, where samples were collected prior (T0), 3 (T1) and 6 (T2) months ± 4 weeks post‐eculizumab treatment, sC5b‐9 concentration decreased as eculizumab was applied and a significant reduction can be demonstrated comparing total pre‐ to 3 months post‐treatment samples. However, some patients showed fluctuating or even persistently elevated sC5b‐9 levels (e.g. patients 2, 3, 14, 17 and 18), and in most of these patients sC5b‐9 levels, despite eculizumab treatment, correlated with deterioration of proteinuria (patients 3, 14, 17 and 18). Unstable clinical conditions have been reported by clinicians; for example, patient 3 (discussed in detail by Schalk et al. 30). The immediate drop of sC5b‐9 plasma concentrations upon eculizumab treatment without recovery of C3 levels appears to be characteristic in our cohort of C3G patients (seven of nine). A similar complement profile with little effect of the anti‐C5 antibody on C3 levels, remaining below the reference range in five of six C3G patients, has been shown previously 31. In our C3G patients under eculizumab therapy, C3d was elevated at all sampling time‐points (17 of 17). In contrast, only four of 22 of the samples collected from aHUS patients in the same observation period showed elevated C3d levels, emphasizing pathophysiological differences between the two disease entities. aHUS differs from the much more heterogeneous C3G with respect to the primary site of excessive complement activation either at the level of the endothelial cell membrane (aHUS) or in the fluid phase (C3G). In addition, a diversity of fluid phase complement dysregulation in C3G has been observed with respect to the involvement of C5 convertase with subsequent terminal pathway activation 32. This may explain differences in the response to anti‐C5 therapy 32, 33. Analysis of complement activation at different levels of the cascade reaction is therefore suggested to identify C3G patients where lack of significant terminal pathway activation may shift meaningful complement blockade towards C3 inhibition 34.
In 10 of 22 samples from aHUS patients elevated sC5b‐9 levels were found despite eculizumab treatment, which is consistent with the findings of an abnormal complement profile of 47–64% of aHUS patients in remission, as described by Noris et al. 29. In contrast, sC5b‐9 levels were elevated in only four of 17 samples collected from C3G patients after treatment. High sC5b‐9 levels, even under sufficient eculizumab exposure, may also indicate alternative C5 cleavage by non‐convertase enzymes. Interestingly, C5a levels have been described recently to be increased in contrast to reduced sC5b‐9 levels after initiation of eculizumab treatment in a case of the haemolysis, elevated liver enzymes and low platelets (HELLP) syndrome 35. However, in a response to this report, results were claimed to be false‐positive, due to either cross‐reactivity to other epitopes or to C5–eculizumab complexes recognized particularly in the applied ELISA 36, 37. Whereas a significant decrease of C5a in our aHUS cohort could be demonstrated, this was not the case for C3G patients despite the high pretreatment levels of sC5b‐9. The discrepancy between sC5b‐9 and C5a levels can be explained partially by the short half‐life of approximately 1 min of the anaphylatoxin C5a due to binding to leucocyte receptors and decay by carboxypeptidases compared to the 60 times longer half‐life of sC5b‐9 37. However, at all measured time‐points in both patient groups, C5a levels were in the normal or above‐normal range of the measurements for healthy human volunteers within the ELISA, and did not correlate with inhibition of complement function (CH50, APH50) upon eculizumab treatment. Given the abundance of C5aR and C5L2, thus the large sink for C5a, these measured C5a levels in patients under eculizumab treatment suggest that the C5a axis is probably not silenced completely through eculizumab treatment, unlike as perceived commonly. Thus, it might be hypothesized that alternative cleaving events could occur in the presence of eculizumab aside from the known complement convertases. Further investigations should therefore take into consideration the interactions between the complement cascade and the clotting system as a possible explanation for generation of the activation products C5a and sC5b‐9 38, 39. Reduction of the coagulation biomarkers prothrombin fragment F1 + 2 and D‐dimer with eculizumab treatment in aHUS patients supports the involvement of the clotting system 40. In this context, thrombin has been shown to cleave C5 and generate C5a, especially in the absence of C3 41. Besides thrombin, the coagulation factors IXa, Xa and XIa, as well as plasmin, have also been shown to cleave C3 and C5 effectively and generate the split products C3a and C5a 38. However, it remains unclear to what extent eculizumab is mechanistically able to inhibit the cleavage of C5 mediated by coagulation enzymes in comparison to the C5 convertases, where the anti‐C5 antibody has been proposed to prevent the entry of the substrate molecule C5 into the convertase 5.
Persisting alternative pathway activation in aHUS patients with high levels of Ba despite terminal complement inhibition by eculizumab has been published recently 40. While in most aHUS cases presented here the function of the classical and alternative pathway was inhibited completely, in some patients (e.g. aHUS patients 3 and 6 at T1) the alternative pathway in particular showed remaining haemolytic activity up to 67%, despite high concentrations of eculizumab. Interestingly, the ID50 of the alternative pathway in the haemolytic assay appears to be 1·8‐fold higher than that for the classical pathway, pointing to an assay‐dependent discrepancy in the inhibitory capacity of the anti‐C5 antibody. Here, probably a higher resistance to haemolysis for the nucleated chicken erythrocytes used in the APH50 compared to the sheep erythrocytes in the CH50 may explain the differences in efficacy to inhibit the terminal pathway. However, a similar difference has also been described for a non‐therapeutic anti‐human C5 monoclonal antibody (Quidel Corp., San Diego, CA, USA) applying the functional complement ELISA (Wieslab assay) 42. Here we observed lower but identical ID50 values for the classical and alternative pathways. This can be explained by the identical readout of the C5b‐9 formation in this assay for the two pathways in contrast to the two distinct haemolytic assays. This raises the principle question of which complement assay reflects the true inhibitory capacity of a complement‐targeting drug.
More importantly, further research needs to address the clinical relevance of a remaining complement activity (especially of the alternative pathway) which we observed even at five to 10‐fold trough levels of eculizumab, considering novel drug approaches which target the alternative pathway specifically 42. Whether the binding of eculizumab to sC5b‐9 (Fig. 1b) contributes to a slow plasma clearance 29 needs to be evaluated further. In the context of determining residual complement activity despite eculizumab treatment, measurement of the capacity in plasma of aHUS patients to generate sC5b‐9 upon activation may offer some advantages here 43.
As demonstrated recently in 26 cases of renal transplants, prophylactic eculizumab treatment reduces the incidence of early acute AMR successfully 44. All patients had therapeutic drug levels during the first 4 weeks of treatment, showing a similar pharmacokinetic profile and similar functional complement inhibition as our patients. However, no data were provided on the long‐term effect of eculizumab treatment and whether the drug continued to accumulate, as seen in our patients.
It appears that especially patients with an altered therapy regimen and children have a tendency to accumulate eculizumab towards trough levels partially exceeding 1000 μg/ml 30, 45. Levels above 500 µg/ml were confirmed recently in a case of long‐term application of eculizumab in aHUS 46, and pharmacokinetic modelling correlated drug accumulation to low body weight 47. A trough level is recommended which should not undercut 50–100 μg/ml 48. It can currently not be ruled out that in patients with extensive renal impairment higher eculizumab levels are required to control complement activation and severe inflammation. However, with respect to the financial burden of eculizumab treatment, the cost‐effectiveness ratio at such high drug concentrations needs to be considered to avoid drug over‐exposure 29. In addition, it is not known if possible side effects such as meningococcal infections, despite vaccination 49 or hepatotoxicity 50, are related to eculizumab drug overdoses.
With the detection of functionally active eculizumab in urine, an alternative way of drug elimination to the clearance in the reticuloendothelial system needs to be considered. This, however, appears to apply only to patients with a high degree of proteinuria, and may lead to loss of efficacy of eculizumab treatment due to low serum trough levels (e.g. patient 13). Interestingly, in a recent report by Volokhina et al., the larger C5–eculizumab complex could not be detected in urine samples of aHUS patients despite the presence of the larger sC5b‐9 complex 51. Based on our findings of eculizumab accumulation, we propose to re‐evaluate the use and dosage of eculizumab with respect to the heterogeneous group of complement‐mediated renal diseases 52, 53. Treatment with eculizumab should be performed according to the official body weight‐adjusted regimen. Whenever the therapy is altered, trough levels should be analysed to avoid under‐dosing, which has been reported to occur in 10–16% of PNH patients 54. Conversely, it appears that shorter intervals, higher eculizumab doses and especially the treatment of young children may lead to accumulation of eculizumab in serum reflecting variable capacity for drug elimination, an effect which was not so prominent in adult PNH patients receiving 900 mg eculizumab every 2 weeks 54. In contrast, a break‐through in a complicated case of aHUS was achieved with eculizumab levels exceeding 1000 µg/ml 30. Whether accumulation of eculizumab is associated with a gain of therapeutic efficacy or increased risk for side effects needs to be clarified. This, however, requires optimal monitoring of complement biomarkers, routine laboratory parameters and eculizumab trough levels comparing continuous to disease‐driven intermittent treatment 55 to resolve the uncertainty in finding an optimal, tailored eculizumab dosage for the individual patient.
Disclosure
M. K. received fees for invited lectures and advisory board meetings from Alexion and as consultant and for lectures from Euro Diagnostica. K. K., M. W. and M. B. received honoraria for invited lectures from Alexion. B. H. received fees for lectures, advisory boards and congress travel support from Alexion. B. T. received travel support from Alexion. R. W. has received reimbursement for attending a scientific congress and funds for organizing a renal transplant symposium from Alexion Pharma. B. H. has a consultant contract with Alexion Pharma, Germany GmbH. O. A. left University Hospital Tübingen after contributing to this paper and has been uncontactable; he was, therefore, not able to disclose information relating to competing interests. The remaining authors declare no competing financial interests.
Author contributions
C. W. and M. K. designed the study, interpreted the data and wrote the manuscript; C. W. performed the laboratory analysis of complement and eculizumab; O. A., M. B., B. H., K. K., G. S., R. W., M. W., B. H., B. T., R. B., H. F. and Ö. G. provided patients' clinical and laboratory data (beyond complement), and contributed their clinical interpretation to the final manuscript.
Supporting information
Additional Supporting information may be found in the online version of this article at the publisher's web‐site:
Fig. S1. Laboratory routine parameters before (T0), after 3 (T1) and 6 (T2) months of eculizumab treatment of atypical haemolytic uraemic syndrome (aHUS) and C3 glomerulopathies (C3G) patients. In 12 aHUS and nine C3G patients' parameters of haemolysis, platelet counts (Fig. S1a) and lactate dehydrogenase (LDH; Fig. S1b), and of kidney function, serum creatinine (sCr; Fig. S1c) and proteinuria (Fig. S1d) were assessed. For aHUS patients, significant increase of platelet counts and significant reduction of LDH and sCr can be demonstrated, whereas for C3G patients significant improvement of sCr can be shown. Statistical analysis was performed by Student's t‐test for paired (individual groups) using Prism version 5 software; *P < 0·05; **P < 0·01.
Fig. S2. Analysis of urinary eculizumab excretion. Detection of eculizumab in urine and serum from patient 1 (Fig. S2a). Urinary eculizumab excretion for patient 1 does not correlate with concentration in serum (Fig. S2b; P = 0·47, r = 0·22). Urinary eculizumab excretion for patient 1 correlates with inhibition of normal human serum (NHS)‐mediated haemolysis (Fig. S2c; P = 0·005, r = 0·.73). The mean urinary eculizumab excretion from patients (n = 10) treated with eculizumab correlates with the mean urinary protein concentration (Fig. S2d; P = 0·008, r = 0·88). Spearman's correlation analysis was performed using Prism version 5 software; *P < 0·05; **P < 0·01.
Table S1. Laboratory measurements
Acknowledgements
Wieslab® Complement system Screen COMPL 300 kits were kindly provided by Euro Diagnostica AB, Malmö, Sweden. The authors appreciate the excellent laboratory assistance of Mrs A. Fertig, Mrs R. Rutz and Mr D. Fischer, and thank Mr M. Zorn from the clinical chemistry department at the University Hospital of Heidelberg for analysing urinary protein. C5a analysis was kindly provided by Professor Dr N. Riedemann, InflaRx GmbH, Jena, Germany.
References
- 1. Noris M, Remuzzi G. Glomerular diseases dependent on complement activation, including atypical hemolytic uremic syndrome, membranoproliferative glomerulonephritis, and C3 glomerulopathy: core curriculum 2015. Am J Kidney Dis 2015; 66:359–75. [DOI] [PMC free article] [PubMed] [Google Scholar]
- 2. Zipfel PF, Skerka C, Chen Q et al The role of complement in C3 glomerulopathy. Mol Immunol 2015; 67:21–30. [DOI] [PubMed] [Google Scholar]
- 3. Nester CM, Brophy PD. Eculizumab in the treatment of atypical haemolytic uraemic syndrome and other complement‐mediated renal diseases. Curr Opin Pediatr 2013; 25:225–31. [DOI] [PubMed] [Google Scholar]
- 4. Salvadori M, Rosso G, Bertoni E. Complement involvement in kidney diseases: from physiopathology to therapeutical targeting. World J Nephrol 2015; 4:169–84. [DOI] [PMC free article] [PubMed] [Google Scholar]
- 5. Zuber J, Fakhouri F, Roumenina LT, Loirat C, Fremeaux‐Bacchi V. Use of eculizumab for atypical haemolytic uraemic syndrome and C3 glomerulopathies. Nat Rev Nephrol 2012; 8:643–57. [DOI] [PubMed] [Google Scholar]
- 6. Wong EK, Goodship TH, Kavanagh D. Complement therapy in atypical haemolytic uraemic syndrome (aHUS). Mol Immunol 2013; 56:199–212. [DOI] [PMC free article] [PubMed] [Google Scholar]
- 7. Barnett AN, Asgari E, Chowdhury P, Sacks SH, Dorling A, Mamode N. The use of eculizumab in renal transplantation. Clin Transplant 2013; 27:E216–29. [DOI] [PubMed] [Google Scholar]
- 8. Barilla‐Labarca ML, Toder K, Furie R. Targeting the complement system in systemic lupus erythematosus and other diseases. Clin Immunol 2013; 148:313–21. [DOI] [PubMed] [Google Scholar]
- 9. Pickering MC, Ismajli M, Condon MB et al Eculizumab as rescue therapy in severe resistant lupus nephritis. Rheumatology 2015; 54:2286–8. [DOI] [PMC free article] [PubMed] [Google Scholar]
- 10. Kelly RJ, Hill A, Arnold LM et al Long‐term treatment with eculizumab in paroxysmal nocturnal hemoglobinuria: sustained efficacy and improved survival. Blood 2011; 117:6786–92. [DOI] [PubMed] [Google Scholar]
- 11. Loschi M, Porcher R, Barraco F et al Impact of eculizumab treatment on paroxysmal nocturnal hemoglobinuria: a treatment versus no‐treatment study. Am J Hematol 2016; 91:366–70. [DOI] [PubMed] [Google Scholar]
- 12. Rondelli T, Risitano AM, Peffault de Latour R et al Polymorphism of the complement receptor 1 gene correlates with the hematologic response to eculizumab in patients with paroxysmal nocturnal hemoglobinuria. Haematologica 2014; 99:262–6. [DOI] [PMC free article] [PubMed] [Google Scholar]
- 13. Nishimura J, Yamamoto M, Hayashi S et al Genetic variants in C5 and poor response to eculizumab. N Engl J Med 2014; 370:632–9. [DOI] [PubMed] [Google Scholar]
- 14. DeZern AE, Dorr D, Brodsky RA. Predictors of hemoglobin response to eculizumab therapy in paroxysmal nocturnal hemoglobinuria. Eur J Haematol 2013; 90:16–24. [DOI] [PMC free article] [PubMed] [Google Scholar]
- 15. Herlitz LC, Bomback AS, Markowitz GS et al Pathology after eculizumab in dense deposit disease and C3 GN. J Am Soc Nephrol 2012; 23:1229–37. [DOI] [PMC free article] [PubMed] [Google Scholar]
- 16. Kocak B, Arpali E, Demiralp E et al Eculizumab for salvage treatment of refractory antibody‐mediated rejection in kidney transplant patients: case reports. Transplant Proc 2013; 45:1022–5. [DOI] [PubMed] [Google Scholar]
- 17. Carr R, Cataland SR. Relapse of aHUS after discontinuation of therapy with eculizumab in a patient with aHUS and factor H mutation. Ann Hematol 2013; 92:845–6. [DOI] [PubMed] [Google Scholar]
- 18. Ardissino G, Testa S, Possenti I et al Discontinuation of eculizumab maintenance treatment for atypical hemolytic uremic syndrome: a report of 10 cases. Am J Kidney Dis 2014; 64:633–7. [DOI] [PubMed] [Google Scholar]
- 19. Nester C, Stewart Z, Myers D et al Pre‐emptive eculizumab and plasmapheresis for renal transplant in atypical hemolytic uremic syndrome. Clin J Am Soc Nephrol 2011; 6:1488–94. [DOI] [PMC free article] [PubMed] [Google Scholar]
- 20. Mayer MM. Complement and complement fixation In: Kabat E, Mayer M, eds. Experimental immunochemistry. Springfield, IL: Charles C. Thomas, 1961:133–240. [Google Scholar]
- 21. Joiner KA, Hawiger A, Gelfand JA. A study of optimal reaction conditions for an assay of the human alternative complement pathway. Am J Clin Pathol 1983; 79:65–72. [DOI] [PubMed] [Google Scholar]
- 22. Brandslund I, Siersted HC, Svehag SE, Teisner B. Double‐decker rocket immunoelectrophoresis for direct quantitation of complement C3 split products with C3d specificities in plasma. J Immunol Methods 1981; 44:63–71. [DOI] [PubMed] [Google Scholar]
- 23. Rother U. A new screening test for C3 nephritis factor based on a stable cell bound convertase on sheep erythrocytes. J Immunol Methods 1982; 51:101–7. [DOI] [PubMed] [Google Scholar]
- 24. Mollnes TE, Lea T, Froland SS, Harboe M. Quantification of the terminal complement complex in human plasma by an enzyme‐linked immunosorbent assay based on monoclonal antibodies against a neoantigen of the complex. Scand J Immunol 1985; 22:197–202. [DOI] [PubMed] [Google Scholar]
- 25. Messias‐Reason IJ, Hayashi SY, Nisihara RM, Kirschfink M. Complement activation in infective endocarditis: correlation with extracardiac manifestations and prognosis. Clin Exp Immunol 2002; 127:310–5. [DOI] [PMC free article] [PubMed] [Google Scholar]
- 26. Cugno M, Gualtierotti R, Possenti I et al Complement functional tests for monitoring eculizumab treatment in patients with atypical hemolytic uremic syndrome. J Thromb Haemost 2014; 12:1440–8. [DOI] [PubMed] [Google Scholar]
- 27. Habbig S, Bergmann C, Weber LT. Discontinuation of eculizumab in a patient with atypical hemolytic uremic syndrome due to a mutation in CFH. Am J Kidney Dis 2016; 67:532–3. [DOI] [PubMed] [Google Scholar]
- 28. Volokhina EB, Westra D, van der Velden TJ, van de Kar NC, Mollnes TE, van den Heuvel LP. Complement activation patterns in atypical haemolytic uraemic syndrome during acute phase and in remission. Clin Exp Immunol 2015; 181:306–13. [DOI] [PMC free article] [PubMed] [Google Scholar]
- 29. Noris M, Galbusera M, Gastoldi S et al Dynamics of complement activation in aHUS and how to monitor eculizumab therapy. Blood 2014; 124:1715–26. [DOI] [PMC free article] [PubMed] [Google Scholar]
- 30. Schalk G, Kirschfink M, Wehling C et al A complicated case of atypical hemolytic uremic syndrome with frequent relapses under eculizumab. Pediatr Nephrol 2015; 30:1039–42. [DOI] [PubMed] [Google Scholar]
- 31. Bomback AS, Smith RJ, Barile GR et al Eculizumab for dense deposit disease and C3 glomerulonephritis. Clin J Am Soc Nephrol 2012; 7:748–56. [DOI] [PMC free article] [PubMed] [Google Scholar]
- 32. Bomback AS. Eculizumab in the treatment of membranoproliferative glomerulonephritis. Nephron Clin Pract 2014; 128:270–6. [DOI] [PubMed] [Google Scholar]
- 33. Gurkan S, Fyfe B, Weiss L, Xiao X, Zhang Y, Smith RJ. Eculizumab and recurrent C3 glomerulonephritis. Pediatr Nephrol 2013; 28:1975–81. [DOI] [PMC free article] [PubMed] [Google Scholar]
- 34. Reis ES, Mastellos DC, Yancopoulou D, Risitano AM, Ricklin D, Lambris JD. Applying complement therapeutics to rare diseases. Clin Immunol 2015; 161:225–40. [DOI] [PMC free article] [PubMed] [Google Scholar]
- 35. Burwick RM, Burwick NR, Feinberg BB. Eculizumab fails to inhibit generation of C5a in vivo. Blood 2014; 124:3502–3. [DOI] [PubMed] [Google Scholar]
- 36. Burwick RM, Burwick N, Feinberg BB. Response: maternal and cord C5a in response to eculizumab. Blood 2015; 126:279–80. [DOI] [PubMed] [Google Scholar]
- 37. Volokhina EB, Bergseth G, van de Kar NC, van den Heuvel LP, Mollnes TE. Eculizumab treatment efficiently prevents C5 cleavage without C5a generation in vivo . Blood 2015; 126:278–9. [DOI] [PMC free article] [PubMed] [Google Scholar]
- 38. Amara U, Flierl MA, Rittirsch D et al Molecular intercommunication between the complement and coagulation systems. J Immunol 2010; 185:5628–36. [DOI] [PMC free article] [PubMed] [Google Scholar]
- 39. Krisinger MJ, Goebeler V, Lu Z et al Thrombin generates previously unidentified C5 products that support the terminal complement activation pathway. Blood 2012; 120:1717–25. [DOI] [PubMed] [Google Scholar]
- 40. Cofiell R, Kukreja A, Bedard K et al Eculizumab reduces complement activation, inflammation, endothelial damage, thrombosis, and renal injury markers in aHUS. Blood 2015; 125:3253–62. [DOI] [PMC free article] [PubMed] [Google Scholar]
- 41. Huber‐Lang M, Sarma JV, Zetoune FS et al Generation of C5a in the absence of C3: a new complement activation pathway. Nat Med 2006; 12:682–7. [DOI] [PubMed] [Google Scholar]
- 42. Fridkis‐Hareli M, Storek M, Mazsaroff I et al Design and development of TT30, a novel C3d‐targeted C3/C5 convertase inhibitor for treatment of human complement alternative pathway‐mediated diseases. Blood 2011; 118:4705–13. [DOI] [PMC free article] [PubMed] [Google Scholar]
- 43. Riedl M, Hofer J, Giner T et al Novel biomarker and easy to perform ELISA for monitoring complement inhibition in patients with atypical hemolytic uremic syndrome treated with eculizumab. J Immunol Methods 2016; 435:60–7. [DOI] [PMC free article] [PubMed] [Google Scholar]
- 44. Bentall A, Tyan DB, Sequeira F et al Antibody‐mediated rejection despite inhibition of terminal complement. Transpl Int 2014; 27:1235–43. [DOI] [PubMed] [Google Scholar]
- 45. Wehling C, Kirschfink M. Tailored eculizumab regimen for patients with atypical hemolytic uremic syndrome: requirement for comprehensive complement analysis. J Thromb Haemost 2014; 12:1437–9. [DOI] [PubMed] [Google Scholar]
- 46. Cullinan N, Gorman KM, Riordan M, Waldron M, Goodship TH, Awan A. Case report: benefits and challenges of long‐term eculizumab in atypical hemolytic uremic syndrome. Pediatrics 2015; 135:e1506–9. [DOI] [PubMed] [Google Scholar]
- 47. Gatault P, Brachet G, Ternant D et al Therapeutic drug monitoring of eculizumab: rationale for an individualized dosing schedule. MAbs 2015; 7:1205–11. [DOI] [PMC free article] [PubMed] [Google Scholar]
- 48. Fakhouri F, Fremeaux‐Bacchi V, Loirat C. Atypical hemolytic uremic syndrome: from the rediscovery of complement to targeted therapy. Eur J Intern Med 2013; 24:492–5. [DOI] [PubMed] [Google Scholar]
- 49. Loirat C, Fakhouri F, Ariceta G et al An international consensus approach to the management of atypical hemolytic uremic syndrome in children. Pediatr Nephrol 2016; 31:15–39. [DOI] [PubMed] [Google Scholar]
- 50. Hayes W, Tschumi S, Ling SC, Feber J, Kirschfink M, Licht C. Eculizumab hepatotoxicity in pediatric aHUS. Pediatr Nephrol 2015; 30:775–81. [DOI] [PubMed] [Google Scholar]
- 51. Volokhina EB, van de Kar NC, Bergseth G et al Sensitive, reliable and easy‐performed laboratory monitoring of eculizumab therapy in atypical hemolytic uremic syndrome. Clin Immunol 2015; 160:237–43. [DOI] [PubMed] [Google Scholar]
- 52. Ruebner RL, Kaplan BS, Copelovitch L. A time for reappraisal of ‘atypical’ hemolytic uremic syndrome: should all patients be treated the same? Eur J Pediatr 2012; 171:1519–25. [DOI] [PubMed] [Google Scholar]
- 53. Xie L, Nester CM, Reed AI, Zhang Y, Smith RJ, Thomas CP. Tailored eculizumab therapy in the management of complement factor H‐mediated atypical hemolytic uremic syndrome in an adult kidney transplant recipient: a case report. Transplant Proc 2012; 44:3037–40. [DOI] [PubMed] [Google Scholar]
- 54. Peffault de Latour R, Fremeaux‐Bacchi V, Porcher R et al Assessing complement blockade in patients with paroxysmal nocturnal hemoglobinuria receiving eculizumab. Blood 2015; 125:775–83. [DOI] [PubMed] [Google Scholar]
- 55. Sheerin NS, Kavanagh D, Goodship TH, Johnson S. A national specialized service in England for atypical haemolytic uraemic syndrome‐the first year's experience. QJM 2016; 109:27–33. [DOI] [PubMed] [Google Scholar]
Associated Data
This section collects any data citations, data availability statements, or supplementary materials included in this article.
Supplementary Materials
Additional Supporting information may be found in the online version of this article at the publisher's web‐site:
Fig. S1. Laboratory routine parameters before (T0), after 3 (T1) and 6 (T2) months of eculizumab treatment of atypical haemolytic uraemic syndrome (aHUS) and C3 glomerulopathies (C3G) patients. In 12 aHUS and nine C3G patients' parameters of haemolysis, platelet counts (Fig. S1a) and lactate dehydrogenase (LDH; Fig. S1b), and of kidney function, serum creatinine (sCr; Fig. S1c) and proteinuria (Fig. S1d) were assessed. For aHUS patients, significant increase of platelet counts and significant reduction of LDH and sCr can be demonstrated, whereas for C3G patients significant improvement of sCr can be shown. Statistical analysis was performed by Student's t‐test for paired (individual groups) using Prism version 5 software; *P < 0·05; **P < 0·01.
Fig. S2. Analysis of urinary eculizumab excretion. Detection of eculizumab in urine and serum from patient 1 (Fig. S2a). Urinary eculizumab excretion for patient 1 does not correlate with concentration in serum (Fig. S2b; P = 0·47, r = 0·22). Urinary eculizumab excretion for patient 1 correlates with inhibition of normal human serum (NHS)‐mediated haemolysis (Fig. S2c; P = 0·005, r = 0·.73). The mean urinary eculizumab excretion from patients (n = 10) treated with eculizumab correlates with the mean urinary protein concentration (Fig. S2d; P = 0·008, r = 0·88). Spearman's correlation analysis was performed using Prism version 5 software; *P < 0·05; **P < 0·01.
Table S1. Laboratory measurements