

Abstract
Diabetic kidney disease (DKD) represents a major component of the health burden associated with type 1 and type 2 diabetes. Recent advances have produced an explosion of ‘novel’ assay‐based risk markers for DKD, though clinical use remains restricted. Although many patients with progressive DKD follow a classical albuminuria‐based pathway, non‐albuminuric DKD progression is now well recognized. In general, the following clinical and biochemical characteristics have been associated with progressive DKD in both type 1 and type 2 diabetes: increased hemoglobin A1c, systolic blood pressure, albuminuria grade, early glomerular filtration rate decline, duration of diabetes, age (including pubertal onset) and serum uric acid; the presence of concomitant microvascular complications; and positive family history. The same is true in type 2 diabetes for male sex category, in patients following an albuminuric pathway to DKD, and also true for the presence of increased pulse wave velocity. The following baseline clinical characteristics have been proposed as risk factors for DKD progression, but with further research required to assess the nature of any relationship: dyslipidemia (including low‐density lipoprotein, total and high‐density lipoprotein cholesterol); elevated body mass index; smoking status; hyperfiltration; decreases in vitamin D, hemoglobin and uric acid excretion (all known consequences of advanced DKD); and patient test result visit‐to‐visit variability (hemoglobin A1c, blood pressure and high‐density lipoprotein cholesterol). The development of multifactorial ‘renal risk equations’ for type 2 diabetes has the potential to simplify the task of DKD prognostication; however, there are currently none for type 1 diabetes‐specific populations. Significant progress has been made in the prediction of DKD progression using readily available clinical data, though further work is required to elicit the role of several variables, and to consolidate data to facilitate clinical implementation.
Keywords: Diabetic kidney disease, Diabetic nephropathy, Risk factors
Introduction
The prediction of kidney disease progression in patients with type 1 and type 2 diabetes mellitus represents an important clinical and public policy challenge. In many regions, diabetes is now the leading cause of end‐stage renal disease (ESRD)1, 2. Conversely, between a one‐quarter and half of patients diagnosed with diabetes might develop chronic kidney disease (CKD)3, 4, 5. Diabetic kidney disease (DKD) contributes significantly to the excess mortality6, 7, 8 and healthcare cost9 associated with diabetes. Indeed, much of the cardiovascular death in diabetes appears to be related to the development of CKD10, 11, 12.
In developing individualized glycemic targets, clinicians are in need of information to help balance the risks of prolonged hyperglycemia and its associated complications, such as DKD, with the risk of hypoglycemia13. A strong association has been shown between intensive glycemic control in type 1 diabetes mellitus and a slower rate of decline in kidney function, as measured by eGFR decline14. Similarly, patients with type 2 diabetes mellitus and intensive glycemic control in the Action in Diabetes and Vascular Disease: Preterax and Diamicron MR Controlled Evaluation trial had a lower incidence of ESRD15. From a public policy perspective, prediction of those most at risk of renal impairment might better inform the allocation of health resources. For example, referral to specialist nephrology clinics could result in significantly lower rates of undertreatment16 and decrease the risk of ESRD/mortality17, but at increased cost to either the patient or health system. Despite the apparent need, the ability to predict the progression of DKD using classically described risk markers remains relatively poor18.
Although rates of classical ‘nephropathy’ development might be similar, a smaller proportion of those with type 2 diabetes mellitus will progress to ESRD than with type 1 diabetes mellitus19, 20. This difference in course might be at least in part accounted for by differing baseline characteristics21, including age and relative lead‐time to other causes of death, such as cardiovascular disease. The overall higher burden of type 2 diabetes mellitus means that despite this apparently lower rate, a much greater proportion of those with ESRD have type 2 diabetes mellitus than type 1 diabetes mellitus20.
The remainder of the present article will focus on known risk factors for the progression of DKD in both type 1 diabetes mellitus and type 2 diabetes mellitus, with a special focus on clinical variables available to the practicing clinician. The emphasis will be on changes in GFR rather than albuminuria status. Where available, studies with direct measurement of GFR have been used. It should be noted that the demonstration of predictive utility does not necessarily imply a direct mechanistic role in the pathogenesis of DKD.
Materials and Methods
An Ovid‐Medline search was carried out in 2015 dating back to 1990 combining the following subject headings:
Diabetes Mellitus
Diabetic Nephropathies
Humans
Disease Progression OR Risk Factors.
This retrieved a total of 286 results. Articles were selected based on their clinical relevance for the prognostication of DKD in both type 1 diabetes mellitus and type 2 diabetes mellitus. Other literature was sourced through PubMed or an exploration of references in previously sourced articles.
Results
Study approaches
The approach of many studies into DKD risk prognostication has been to collect a range of baseline patient data, and then to assess for a relationship with a chosen outcome measure. Alternative approaches have involved analysis of longitudinal test results, or sometimes proposed aggregate ‘renal risk scores.’ Novel biomarkers might improve predictive ability above routine clinical information alone22; nevertheless, barriers to clinical implementation remain significant23. An exhaustive discussion of experimental biomarkers is outside the scope of the present review.
Three broad study outcome measures have been assessed24: hard renal end‐points (e.g., death, ESRD, CKD); albuminuria status; and the rate of GFR/eGFR decline. While studies attempting to use hard renal end‐points require large sample sizes to reach statistical significance, questions remain surrounding the other two aforementioned outcome measures.
Changes in albuminuria as a surrogate marker have become more controversial, as it has become clearer that not all patients with diabetes who develop renal function decline experience significant albuminuria25, 26, 27, 28. This limits the generalizability of findings from studies using established albuminuria as an inclusion criterion. Knowledge of non‐albuminuric renal disease has prompted a trend in nomenclature away from ‘diabetic nephropathy’ (implying albuminuria) toward the more inclusive term, DKD24. This shift should not undermine the association between cardiovascular death and higher‐grade albumin excretion29.
The majority of studies cited in the present review assessing glomerular function used eGFR rather then measured GFR (mGFR). mGFR is determined by renal clearance of exogenous tracers (e.g., inulin), which undergo glomerular filtration, but no further tubular processing (neither secretion nor absorption)30. Creatinine levels and derived estimates of GFR are less precise, but more commonly carried out than mGFR31. Both CKD‐EPI and MDRD formulas for eGFR have been criticized for being even less accurate in diabetic patients than in the general population32, 33, 34, 35. These formulas might underestimate the rate of mGFR decline in patients with diabetes35, 36. Nevertheless, early decline in eGFR (defined as >3.5 mL/min/1.73 m2/year) has been positively correlated with ESRD in type 1 diabetes mellitus37.
Finally, it should be noted that none of the aforementioned outcome measures confirm the true histopathological pattern of renal injury. ‘Non‐diabetic renal disease (NDRD)’ (renal disease confirmed by biopsy as more consistent with a classically ‘non‐diabetic’ pathology occurring in a patient with diabetes) might be common in some populations with type 2 diabetes mellitus38, 39, 40, and could be associated with lower rates of albuminuria41; however, the reported proportions have varied wildly between investigators and study populations42. Careful exclusion of patients with known NDRD is important to avoid confounding. We have previously shown that typical renal structural changes of diabetic nephropathy were observed in patients with type 2 diabetes and elevated albuminuria. By contrast, in normoalbuminuric renal insufficiency, these changes were seen less frequently, likely reflecting greater contributions from aging, hypertension and arteriosclerosis41.
Clinical Predictive Factors in Diabetic Kidney Disease Progression
Studies in patients with type 2 diabetes mellitus
Several large cohort studies examining the risk of progression to ‘hard renal end‐points’ have been published in patients with baseline eGFR around 75 mL/min/1.73 m2.
Elley et al.43 describe a retrospective analysis of members of the large multicenter New Zealand Diabetes Cohort Study, assessing for 5‐year risk of ESRD. Baseline median eGFR was 75 mL/min/1.73 m2. Using baseline patient data, they produced a multivariable ‘renal risk score’ predictive equation. Direct statistical analysis of the individual candidate risk factors was not presented. Nevertheless, weighted models incorporating albuminuria, serum creatinine, ethnicity, previous cardiovascular disease, glycemic control and systolic blood pressure (SBP) were shown to have statistically significant associations with development of ESRD.
Jardine et al.44 released their own renal risk score based on results from the Action in Diabetes and Vascular Disease: Preterax and Diamicron MR Controlled Evaluation study, following 11 #bib140 participants with type 2 diabetes mellitus for 5 years. Mean eGFR was 74.6 mL/min/1.73 m2. The most important mediating factors identified were eGFR, urinary albumin:creatinine ratio, SBP, hemoglobin A1c (HbA1c), the presence of diabetic retinopathy, male sex and educational attainment.
Studies examining eGFR decline in patients with type 2 diabetes mellitus have used smaller sample sizes.
In one prospective observational cohort study, Zoppini et al.45 followed 1 #bib682 participants with eGFR ≥60 mL/min/1.73 m2. They identified baseline hypertension, HbA1c, diabetes duration, obesity, insulin treatment and micro/macroalbuminuria as significant risk factors. In a smaller study population, Altemtam46 reviewed medical records of 270 Saudi Arabian patients with type 2 diabetes mellitus and established CKD, arriving at similar conclusions; baseline SBP, HbA1c and proteinuria, but also serum uric acid and vascular comorbidities were strongly and independently associated (by multivariate analysis) with eGFR decline. Again, in a cohort of 729 Japanese patients with type 2 diabetes mellitus and normoalbuminuria, Yokoyama et al.47 reported baseline HbA1c, eGFR, SBP and low plasma total protein as predictive of subsequent eGFR decline.
Rossing et al.48 carried out a retrospective analysis of 366 Caucasian patients with type 2 diabetes mellitus. Only patients with persistent macroalbuminuria were enrolled. Nevertheless, they assessed for decline in measured GFR over 3 years. Multivariate regression analysis showed baseline risk factors for mGFR deterioration included albuminuria, SBP, HbA1c, GFR, age and degree of diabetic retinopathy. On follow up, the rate of change in albuminuria, SBP, HbA1c and lower hemoglobin, heavy smoking, and progression of diabetic retinopathy were also associated with lower mGFR. That study included two alternative outcome measures: all cause mortality (associated with higher baseline albuminuria, HbA1c, SBP and age) and ‘doubling of serum creatinine or ESRD’ (associated with higher baseline albuminuria, HbA1c and SBP, together with lower GFR and hemoglobin).
Studies in patients with type 1 diabetes mellitus
Studies in patients with type 1 diabetes mellitus are both fewer and smaller in participant size, but follow similar study design.
Skupien et al.37 examined the occurrence of ESRD in 161 type 1 diabetes mellitus patients with ‘normal’ renal function (eGFR ≥60 mL/min) and macroalbuminuria at baseline. Although they were able to determine that baseline HbA1c and urinary albumin:creatinine ratio, and early eGFR slope predicted the risk of ESRD, statistical significance was not achieved for SBP, body mass index (BMI) or smoking.
In a smaller 5‐year prospective study involving 72 type 1 diabetes mellitus patients of ‘low socioeconomic level’ in Saudi Arabia, Bentata et al.49 found elevated diastolic BP and lower hemoglobin to be associated with progression to ESRD on multivariate analysis. That study was in the setting of advanced baseline diabetic complications and limited medical access.
In the study by Molitch et al.50 1 #bib439 patients with type 1 diabetes mellitus in the multicenter Diabetes Control and Complications Trial and the Epidemiology of Diabetes Interventions and Complications study had normal baseline eGFR, and were assessed for progression to eGFR <60 mL/min/1.73 m2. That study stressed the importance of macroalbuminuria as a strong indicator, but also noted that screening for this alone would have missed many patients who went on to develop eGFR <60 mL/min/1.73 m2.
Hovind et al.51 were able to measure changes in mGFR in patients with type 1 diabetes mellitus. All participants had baseline albuminuria and diabetic retinopathy on enrolment52. With 301 participants, baseline blood pressure, albuminuria, HbA1c and serum cholesterol were shown to be independent predictors of a further decrease in mGFR.
Examples of studies in type 1 diabetes mellitus have struggled more with sample size, and often included patients with lower baseline kidney function than in type 2 diabetes mellitus.
Discussion
Recent large‐scale studies have explored risk factors for progression toward ESRD in type 2 diabetes mellitus. Similar studies in populations with type 1 diabetes mellitus have generally been somewhat limited by sample size, follow‐up time or have followed patients from relatively advanced baseline kidney disease. Studies examining surrogate outcome measures have sometimes restricted themselves to populations with pre‐existing albuminuria.
A range of other potential risk‐markers have either incomplete or conflicting results based on the aforementioned studies, and are discussed below in detail. Irrespective of association with DKD, many of the proposed clinical variables (e.g., dyslipidemia and smoking) have a strong association with overall cardiovascular risk, making the control of such variables extremely important for patients with diabetes.
Evaluation of baseline clinical characteristics as renal risk markers
HbA1c, BP, albumin excretion rate, eGFR, microvascular complications and duration of diabetes
Evidence from a range of studies in both type 1 diabetes mellitus and type 2 diabetes mellitus patients (as above) highlight the utility of the following clinical findings in the prediction of DKD progression: elevated baseline HbA1c, elevated BP (systolic or mean arterial, but not diastolic), elevated albumin excretion rate (AER), decreased pre‐existing renal function (eGFR/mGFR), the presence and severity of concomitant microvascular complications (most especially retinopathy, but also peripheral/autonomic neuropathy, as has been corroborated by biopsy findings showing a link between retinopathy and renal structural changes53), and duration of diabetes. Individual discussion of these risk markers and progressive DKD have been extensively reviewed previously24, 54. Below, we review the evidence for other candidate clinical risk markers for progressive DKD.
Age
Previous studies have generally favored older age as a risk factor for DKD progression – independent of diabetes duration. An independent association between higher age and increased risk of DKD progression have been reported by most43, 45, 48, but not all46 of the aforementioned studies in type 2 diabetes mellitus patients; these studies assessed for changes in eGFR/mGFR amongst predominantly adult patients. This is in keeping with a slow progressive eGFR decline seen in the general population after approximately age 40 years55. However, several studies of type 1 diabetes mellitus have suggested that diagnosis significantly before puberty is protective for DKD development56, 57, 58, 59 (although this finding has not been universal60, 61). Emerging evidence suggests that those patients with youth‐onset type 2 diabetes mellitus might also be at increased risk of DKD62. Poor glycemic control as a result of changes in both hormonal and social factors occurring around puberty might drive this apparent risk window56, 63.
Sex category
The sex category is better examined in studies of patients with type 2 diabetes mellitus than those with type 1 diabetes mellitus. Male sex was reported as a risk factor for DKD progression by two of the aforementioned studies examining hard renal end‐points in type 2 diabetes mellitus43, 44. However, the sex category was found to be insignificant in other studies examining either eGFR or mGFR decline in patients with type 2 diabetes mellitus45, 46, 48, and was unreported in most studies retrieved for patients with type 1 diabetes mellitus37, 49, 50, 51. It is now appreciated that different risk factors are associated with patients following albuminuric and non albuminuric pathway to renal impairment with more females following the non‐albuminuric pathway26.
BMI
Elevated BMI has been reported as a significant risk factor for DKD progression in some, but not all studies. This is despite the established obesity‐related complication of focal segmental glomerulosclerosis64, 65, 66. In their prospective observational study, Zoppini et al. found BMI was not associated with a more rapid eGFR decline unless adjusted for age45. Insignificant findings were reported by a range of other studies into type 2 diabetes mellitus46, 48, including one large‐scale epidemiological review based on the Coronary Risk of Insulin Sensitivity in Indian Subjects study. Huang et al.67 even reported high BMI to be associated with slower eGFR decline in a 24‐month prospective study of 105 patients with type 2 diabetes mellitus and CKD. Available studies in patients with type 1 diabetes mellitus did not report an analysis on BMI as a candidate DKD risk factor37, 49, 50, 51.
Smoking status
Elley et al.43 presented current smoking status, but not past smoking status as a predictor of ESRD in patients with type 2 diabetes mellitus. Similarly, Rossing et al.48 reported an association between ‘heavy’ smoking and mGFR decline over the course of follow up, but not at baseline in type 2 diabetes mellitus. Several studies of patients with type 2 diabetes mellitus have presented a positive association between eGFR decline and either current or former smoking status45, 46. Meanwhile, studies into the rate of eGFR/mGFR decline in type 1 diabetes mellitus have reported a mixture of statistically significant68, 69 and insignificant37, 51 results. Nevertheless, ongoing basic and animal research continues to elicit potential mechanisms for tobacco being associated with structural renal damage in diabetics70, 71. It is possible that baseline reported smoking status has been a poor predictor of ongoing exposure in certain study populations.
Lipid profile
Aspects of the lipid profile and their relationship with DKD have often either not been presented37, 43, 44, 50, have been found to be insignificant45, 48 or reported to have a complex relationship. In patients with type 2 diabetes mellitus, Altemtam et al.46 reported that high serum triglycerides are associated with eGFR decline; however, despite collecting a full lipid profile, the present study did not report on any other aspects of the lipid profile46. Meanwhile in patients with type 1 diabetes mellitus, Hovind et al.51 reported higher total serum cholesterol as significantly predicting greater mGFR decline. Chang et al.72 have reported an association between higher triglycerides and lower high‐density lipoprotein cholesterol (HDL‐C), but not with higher low‐density lipoprotein cholesterol (LDL‐C) and the development of albuminuria end‐points. Using a mixed set of albuminuric/creatinine‐based outcome measures in type 1 diabetes mellitus, Thomas et al.73 reported a significance of association with LDL‐C only.
Aside from standard methodological limitations (e.g., sample size, incomplete presentation of results), some of the existing confusion with regard to the role of the lipid profile might relate to inherent limitations of available assays. For example, HDL‐C, although usually considered as vascular‐protective, might be altered and instead cause endothelial dysfunction in patients with CKD74. Emerging work points toward a more specific predictive utility of lipid subtype analysis75, 76. This field of ‘lipidomics’77 has already reported a cross‐sectional relationship between the lipid‐subtype ‘fingerprint’ and advanced kidney disease78.
Family history and ethnicity
While formal genetic profiling remains unavailable for the average practicing clinician, family history and ethnicity are readily available, and could assist in risk stratification for DKD79, 80. In a retrospective British study of 3,855 patients with type 1 diabetes mellitus/type 2 diabetes mellitus, a more rapid rate of GFR decline was reported in those of either black or South Asian ethnicity than those of Caucasian ethnicity81. Elley et al.43 (as aforementioned) presented those of Pacific Islander and Maori descent having higher rates of progression than those of ‘European’ descent, with those of East Asian and Indo‐Asian ethnicity having the lowest rates of decline of all. Indigenous peoples might experience a higher rate of disease progression, including Australian Aboriginal and Torres Strait Islander peoples82, 83. The relationship between ethnicity and outcomes is complicated greatly by an interplay of economic, social, and educational factors84.
Hemoglobin
In a relatively small study of 174 patients with type 1 diabetes mellitus and pre‐existing albuminuria, baseline hemoglobin concentration was shown by Conway et al.85 to be inversely proportional to the risk of the development of ESRD. Also, in patients with type 1 diabetes mellitus with advanced DKD, Bentata et al.49 found an independent association between lower baseline hemoglobin and ESRD. In patients with type 2 diabetes mellitus, Rossing et al.48 found low baseline hemoglobin was significantly associated with the composite end‐point risk of ‘doubling of serum creatinine or ESRD,’ and low ongoing (over course of follow up) hemoglobin concentration was significantly associated with the rate of decline in isotopic mGFR. With the exception of the aforementioned studies, many of the notable studies retrieved by the present literature review did not document an analysis of baseline hemoglobin37, 43, 44, 45, 46, 50, 51.
Anemia is a known sequelae of advanced DKD86, 87, resulting from tubulointerstitial damage88. Therapeutic use of erythropoietin analogs in diabetic CKD3/4 does not appear to slow the rate of progression to ESRD89. This suggests low hemoglobin is a marker of pre‐existing tubulointerstitial damage88, 90. Notwithstanding the need for replication in a broader population, correction for eGFR in the aforementioned studies does help to imply a potential role for baseline hemoglobin in the prognostication of DKD above existing risk factors.
Vitamin D
Baseline vitamin D can become similarly deficient in patients with advanced CKD, and has been proposed as a DKD risk factor. Fernandez‐Juarez et al.91 followed 133 patients with type 2 diabetes mellitus, in which all had established type 2 diabetes mellitus and pre‐existing albuminuric CKD. Using a composite end‐point (serum creatinine >50% increase, ESRD and mortality), these investigators reported low vitamin D as being independently associated with DKD progression. Though encouraging, these results require replication in order to be extrapolated to the broader type 2 diabetes mellitus population.
Uric acid
Elevations of uric acid are also known to occur in late‐stage DKD92, 93. However, unlike hemoglobin and vitamin D, high‐normal serum uric acid has been shown to be associated with the development of the risk of CKD3 in patients with type 2 diabetes mellitus94, 95, and eGFR decline in type 1 diabetes mellitus96, even with relatively preserved baseline eGFR. Though the results of large‐scale prospective trials are pending97, existing data suggest uric acid might play a mediating role in renal damage98, 99. Recently, decreased urinary uric acid excretion has been cross‐sectionally associated with the risk of development of DKD100.
Arterial pulse wave velocity
In a shift from the blood test dominated approach to risk stratification, Sheen et al.101 have recently advocated for clinical assessment of peripheral arterial stiffness. In their study of 577 patients with type 2 diabetes mellitus, higher brachial‐ankle pulse wave velocity was associated with a more rapid 1‐year decline in eGFR. Similar results were found by Bouchi et al.102 using carotid‐femoral pulse wave velocity in a cohort of Japanese patients with type 2 diabetes mellitus.
Hyperfiltration
Hyperfiltration has been proposed as an early step in the development of ‘diabetic nephropathy,’ with incompletely understood arteriolar/tubulo‐glomerular changes creating elevated mean glomerular hydrostatic pressures, glomerular damage and albuminuria103, 104. Hyperfiltration is defined as an elevated baseline GFR, but the exact study‐specific threshold used to define this phenomenon has varied between 90.7 and 175 mL/min/1.73 m2, 105.
A full review of the literature surrounding hyperfiltration is beyond the scope of the present review. Although more evidence exists for studies of patients with type 1 diabetes mellitus than those with type 2 diabetes mellitus, studies to date have relied on either rates of decline in (e)GFR106, 107, 108 or change in albumin excretion rate107, 109. Not all studies have reported a positive association110, 111, 112, 113, 114.
Significant methodological challenges exist for the field of hyperfiltration. A pathological decline in GFR might be indistinguishable from a ‘beneficial’ resolution of hyperfiltration over a short follow up. Additionally, given hyperfiltration is associated with poor glycemic control115, 116, 117, this phenomenon might simply imply worse glycemic control unless this is adjusted for. Ideally, adequate longitudinal data should allow for the development of hard renal end‐points, such as CKD or ESRD (Figure 1), with baseline variable adjustment118. The true clinical implications of hyperfiltration are currently unknown119.
Figure 1.
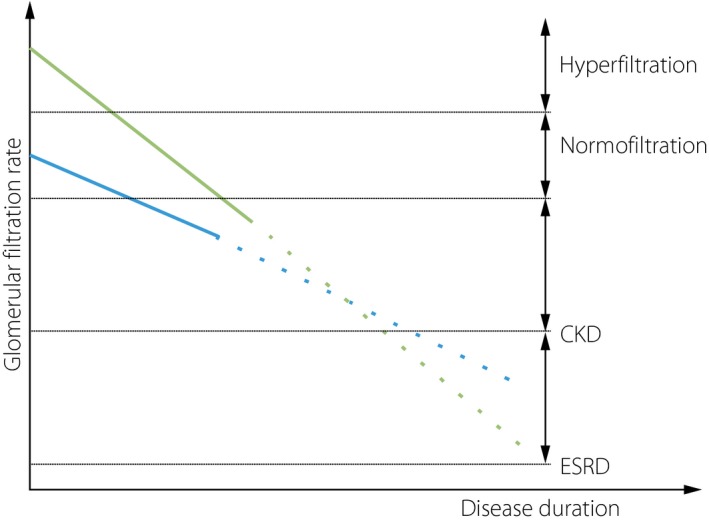
Graphic representation of proposed glomerular filtration rate decline in patients with either baseline hyperfiltration or ‘normofiltration.’ Current studies have sometimes suggested a more rapid rate of early glomerular filtration rate decline in those with hyperfiltration as compared with those with normofiltration (solid lines above). It is unknown whether this is associated with a more rapid onset of chronic kidney disease (CKD) or end‐stage renal disease (ESRD) (dashed lines).
Visit‐to‐visit variability of routine clinical measures
Several of the candidate baseline clinical predictors of DKD progression have been analyzed for the impact of visit‐to‐visit variability. These include BP, HbA1c and HDL‐C. Most studies in this area have used albuminuric end‐points.
Blood pressure variability
In a cohort of 354 patients with type 2 diabetes mellitus, Okada et al.120 compared the changes in albuminuria based on differences in the coefficient of variation of SBP. The average duration of albuminuria surveillance was 3.8 years, after a baseline 1‐year period of clinic‐BP collection (mean 7.19 readings over this time). Leaving aside the potential limits of an albuminuria‐based outcome measure, this study did suggest that clinicians might derive prognostic value by considering not only the baseline BP measure, but historical instability/variability. By contrast, in a much smaller study of patients with advanced DKD (69 patients, mixed type 1 diabetes mellitus/type 2 diabetes mellitus), Yokota121 found no effect of visit‐to‐visit variability in BP on eGFR. The median follow‐up period was 32 months. There is a growing consensus around the risk of diabetic microvascular complications in general from increased BP variability122, but its role in DKD progression remains to be confirmed.
HbA1c variability
Rodriguez et al.123 found that, even adjusting for a broad range of other clinical variables, there was a significantly higher risk of increased albumin excretion in patients with type 2 diabetes mellitus with greater HbA1c variability. That study followed 2 #bib103 patients for mean 6.6 years. Unlike the study by Okada et al. ‘variability’ was determined over the course of follow up; that is, they did not determine that historical variability determined future changes in albuminuria, but instead that ongoing HbA1c variability was correlated with ongoing albumin excretion changes. Similar findings based on concurrent follow up of HbA1c and AER have been reported by Hsu et al.124 and Wadén et al.125. A much larger (15 #bib773 patients, 19 centers) study by Penno et al.126 found that variability of three to five HbA1c measurements over 2 years of follow up was associated with not only albuminuria, but low eGFR amongst patients with type 2 diabetes mellitus. However, that study did not assess for longitudinal changes in either AER or eGFR. HbA1c variability was not shown to predict future changes for a given individual, but simply to correlate with high AER and low eGFR.
Mechanistically, Thomas127 has suggested that epigenetic programming and/or post‐translational modifications might underlie a relationship between HbA1c variability and diabetic complications. This could then be seen as analogous to the concept of ‘metabolic memory’ used to explain the renoprotection seen in glycemic intervention trials of early diabetes128, 129.
LDL‐C and HDL‐C variability
Finally, in the study by Chang et al.72, higher HDL‐C variation was associated with a higher risk of DKD progression in patients with type 2 diabetes mellitus. The outcome measure of that study was AER status. Again, measurements used to derive HDL‐C variability appear to have been taken throughout the period of AER follow up. Although that study found no link (despite assessment) between LDL‐C variability and DKD progression, LDL‐C variability has been linked with adverse cardiovascular outcomes130. Further studies into the area of cholesterol variability and DKD are warranted.
Early studies into the association between DKD progression and visit‐to‐visit variability of routine clinical variables are promising, but several methodological challenges in the existing literature warrant further research. Specifically, future studies could use a broader range of study endpoints, and aim to establish the role of baseline historical variability.
Novel biomarkers and progressive DKD
The present review has focused on clinically predictive factors for progressive DKD. Inflammatory mediators, tubular markers and microribonucleic acids (microRNAs) represent three broad families of biomarkers with strong potential for future clinical use and are reviewed below. A full discussion of ‘novel’ biomarkers is beyond the scope of the present article.
Of all the potential inflammatory markers, soluble tumor necrosis factor (TNF) receptors 1 and 2 (sTNFR1 and sTNFR2) might be the most promising, as a range of investigators have reported them to be independently associated with both eGFR decline and occurrence of either CKD3 or ESRD131. The predictive utility of these receptors might even be highest amongst the proteinuric subcohort of patients with type 2 diabetes mellitus132. In patients with type 1 diabetes mellitus, Gohda et al.133 followed 628 patients with baseline normal renal function and no proteinuria. sTNFR1 and sTNFR2 were strongly associated with time to CKD3 (eGFR <60 mL/min/1.73 m2). Meanwhile, Niewczas et al.132 followed 410 patients with type 2 diabetes mellitus for 12 years. Despite measuring a range of plasma markers known to be involved in systemic inflammation, endothelial dysfunction and the TNF pathway, only sTNFR1 and sTNFR2 were significantly associated with risk of ESRD. In a group of 193 American Pima Indians with type 2 diabetes mellitus (mean follow up 9.5 years), Pavkov et al.134 showed superior prediction of ESRD by incorporating sTNFR1 and sTNFR2 above clinical markers alone. While we are not aware of documented human renal histological damage correlating with either sTNFR1 or sTNFR2 in diabetes, such a relationship has been reported in immunoglobulin A nephropathy135.
Markers of tubular dysfunction might reflect the ongoing tubular damage in DKD136. Two examples are kidney injury molecule 1 and neutrophil gelatinase‐associated lipocalin. Kidney injury molecule 1 is associated with murine renal tubular damage137, and lower levels might be associated with regression of microalbuminuria in human type 1 diabetes mellitus138, 139. An association between kidney injury molecule 1 and progressive eGFR decline has been shown in both type 1 diabetes mellitus and type 2 diabetes mellitus, though significance of association might disappear with adjustment for clinical markers140, 141. Neutrophil gelatinase‐associated lipocalin is a recognized marker of acute renal injury142, 143, and has been reported to be cross‐sectionally elevated in both type 1 diabetes mellitus and type 2 diabetes mellitus with increasing levels of albuminuria144, 145. In a study by Nielsen et al.,141 despite a univariate association of neutrophil gelatinase‐associated lipocalin with eGFR decline, the association again became non‐significant with multivariable adjustment. Urinary liver‐type fatty acid‐binding protein has also recently been reported as being associated with progressive DKD in observational follow‐up studies; this association might be truly independent of AER. In a cohort of 1 #bib549 patients with type 1 diabetes mellitus, Panduru et al.146 showed that liver‐type fatty acid‐binding protein acted independently to AER, baseline eGFR and triglycerides as a predictor of ESRD. In a smaller cohort of 618 patients with type 2 diabetes mellitus, Araki et al.147 reported that the association between liver‐type fatty acid‐binding protein and the rate of eGFR decline remained significant even after adjustment for baseline SBP and AER.
MicroRNAs, non‐coding RNA involved in gene expression (epigenetic programming), have recently come under increasing attention as potential early markers of DKD148, 149, 150. Proposed microRNAs of interest might be involved in a range of biological pathways; one example is that of the transforming growth factor‐beta pathway, known to be involved in CKD progression151, 152. The field of microRNA holds much promise, though more work is required to elucidate their potential role as useful risk predictors.
Should they become more clinically available, a selection of currently proposed biomarkers might hold significant individual prognostic value. An alternative possible approach uses multimarker ‘risk panels’ in an attempt to deliver superior predictive utility22.
Accumulated risk factors and renal risk scores
As has been suggested above in the section ‘Visit‐to‐Visit Variability of Routine Clinical Measures,’ the progression of DKD might be affected not only by the magnitude of physiological derangement, but also the timing and duration. In terms of glycemic control, both the Diabetes Control and Complications Trial and UKPDS trials (in type 1 diabetes mellitus and type 2 diabetes mellitus, respectively) provided evidence for a strong ‘legacy effect’ from early and ‘tight’ glycemic control128, 129, 153. This strong relationship between early glycemic control and lower incidence of micro/macrovascular complications might be at least in part mediated by epigenetic changes154, 155. The evidence of a legacy effect should not undermine newer evidence (e.g., from the Action to Control Cardiovascular Risk in Diabetes study) supporting individualized glycemic targets156.
Although the variables above are discussed individually, accurate clinical prediction of DKD risk clearly requires a broad consideration of patient data, whether traditional clinical variables or novel biomarkers. Looker et al.22 compared the predictive utility of a fairly restricted set of five clinical variables (age, sex, HbA1c, eGFR and albuminuria) to a combination panel of these original five clinical variables plus 14 biomarkers; perhaps unsurprisingly, the receiver operating characteristic increased from 0.706 (clinical data alone) to 0.868 (additional biomarkers). Formalized ‘renal risk scores’ (e.g., of Elley et al.43 and Jardine et al.44 above), represent a possible standardized approach to multivariable risk stratification. Although the current tools are potentially useful for the type 2 diabetes mellitus‐specific populations from which they were developed, they might not be applicable to type 1 diabetes mellitus cohorts. For routine clinical practice, equations would most likely need to be ‘hidden behind clinical software’43. However, given the challenges of encouraging cardiovascular risk calculators in primary care settings157, 158, broad uptake of renal risk scores might be challenging.
Conclusion
Although much of the new research published in the area of DKD risk stratification involves novel markers requiring new and potentially expensive tests, research into the use of clinically accessible risk markers is ongoing.
While a true consensus has emerged for the role of several clinical risk factors, the role of several others requires further research (Figure 2). Proposals for ‘renal risk score equations,’ and assessment of historical trends (including visit‐to‐visit variability) further the opportunity for prognostication based on readily available patient information.
Figure 2.
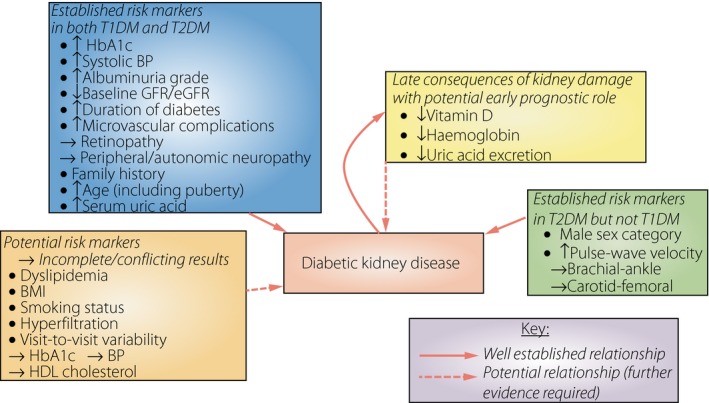
Summary of established and potential clinically applicable predictive factors in the progression of diabetic kidney disease. BP, blood pressure; eGFR, estimated glomerular filtration rate; HbA1c, hemoglobin A1c; HDL, high‐density lipoprotein; GFR, glomerular filtration rate; T1DM, type 1 diabetes mellitus; T2DM, type 2 diabetes mellitus.
Existing studies have used a range of outcome measures, over a varied duration of follow up, often with very different study populations and baseline kidney function. Some have used albuminuria grade as a selection criterion, which might limit applicability for patients with diabetes who are progressing down a non‐proteinuric DKD pathway. The majority (but not all) of studies have been carried out in developed countries, often in diabetic populations regularly attending tertiary referral centers, or involved in large‐scale clinical trials.
Future studies into the prognostication of DKD should aim to optimize outcome measures (by using either hard renal end‐points or decline in accurate measures of GFR) and inclusion criteria. Studies could stratify their analysis by baseline GFR; thereby confirming the relevance of potential risk factors for patients over the full range of existing kidney function. In addition, a focus on presenting the relative magnitudes of association (for example, by hazard ratio or area under the curve159) could better inform the field of what factors contribute to the risk of DKD to a clinically meaningful extent.
Disclosure
The authors declare no conflict of interest.
Acknowledgments
Nicholas Radcliffe was the primary author. Elif I Ekinci edited the manuscript. Jas‐mine Seah, Michele Clarke, Richard J MacIsaac and George Jerums reviewed the manuscript.
J Diabetes Investig 2017; 8: 6–18
References
- 1. Chadban SJ, Briganti EM, Kerr PG, et al Prevalence of kidney damage in Australian adults: the AusDiab kidney study. J Am Soc Nephrol 2003; 14: S131–S138. [DOI] [PubMed] [Google Scholar]
- 2. Reutens AT. Epidemiology of diabetic kidney disease. Med Clin North Am 2013; 97: 1–18. [DOI] [PubMed] [Google Scholar]
- 3. Thomas MC, Weekes AJ, Broadley OJ, et al The burden of chronic kidney disease in Australian patients with type 2 diabetes (the NEFRON study). Med J Aust 2006; 185: 140–144. [DOI] [PubMed] [Google Scholar]
- 4. Plantinga LC, Crews DC, Coresh J, et al Prevalence of chronic kidney disease in US adults with undiagnosed diabetes or prediabetes. Clin J Am Soc Nephrol 2010; 5: 673–682. [DOI] [PMC free article] [PubMed] [Google Scholar]
- 5. van der Meer V, Wielders HP, Grootendorst DC, et al Chronic kidney disease in patients with diabetes mellitus type 2 or hypertension in general practice. Br J Gen Pract 2010; 60: 884–890. [DOI] [PMC free article] [PubMed] [Google Scholar]
- 6. Pavkov ME, Bennett PH, Sievers ML, et al Predominant effect of kidney disease on mortality in Pima Indians with or without type 2 diabetes. Kidney Int 2005; 68: 1267–1274. [DOI] [PMC free article] [PubMed] [Google Scholar]
- 7. Groop PH, Thomas MC, Moran JL, et al The presence and severity of chronic kidney disease predicts all‐cause mortality in type 1 diabetes. Diabetes 2009; 58: 1651–1658. [DOI] [PMC free article] [PubMed] [Google Scholar]
- 8. Afkarian M, Sachs MC, Kestenbaum B, et al Kidney disease and increased mortality risk in type 2 diabetes. J Am Soc Nephrol 2013; 24: 302–308. [DOI] [PMC free article] [PubMed] [Google Scholar]
- 9. McBrien KA, Manns BJ, Chui B, et al Health care costs in people with diabetes and their association with glycemic control and kidney function. Diabetes Care 2013; 36: 1172–1180. [DOI] [PMC free article] [PubMed] [Google Scholar]
- 10. Nag S, Bilous R, Kelly W, et al All‐cause and cardiovascular mortality in diabetic subjects increases significantly with reduced estimated glomerular filtration rate (eGFR): 10 years’ data from the South Tees Diabetes Mortality study. Diabet Med 2007; 24: 10–17. [DOI] [PubMed] [Google Scholar]
- 11. Palsson R, Patel UD. Cardiovascular complications of diabetic kidney disease. Adv Chronic Kidney Dis 2014; 21: 273–280. [DOI] [PMC free article] [PubMed] [Google Scholar]
- 12. Cea Soriano L, Johansson S, Stefansson B, et al Cardiovascular events and all‐cause mortality in a cohort of 57 #bib946 patients with type 2 diabetes: associations with renal function and cardiovascular risk factors. Cardiovasc Diabetol 2015; 14: 38. [DOI] [PMC free article] [PubMed] [Google Scholar]
- 13. Ismail‐Beigi F, Moghissi E, Tiktin M, et al Individualizing glycemic targets in type 2 diabetes mellitus: implications of recent clinical trials. Ann Intern Med 2011; 154: 554–559. [DOI] [PubMed] [Google Scholar]
- 14. Group DER , deBoer IH , Sun W, et al Intensive diabetes therapy and glomerular filtration rate in type 1 diabetes. N Engl J Med 2011; 365: 2366–2376 [DOI] [PMC free article] [PubMed] [Google Scholar]
- 15. Perkovic V, Heerspink HL, Chalmers J, et al Intensive glucose control improves kidney outcomes in patients with type 2 diabetes. Kidney Int 2013; 83: 517–523. [DOI] [PubMed] [Google Scholar]
- 16. Menon R, Mohd Noor FS, Draman CR, et al A retrospective review of diabetic nephropathy patients during referral to the sub‐urban nephrology clinic. Saudi J Kidney Dis Transpl 2012; 23: 1109–1114. [DOI] [PubMed] [Google Scholar]
- 17. Black C, Sharma P, Scotland G, et al Early referral strategies for management of people with markers of renal disease: a systematic review of the evidence of clinical effectiveness, cost‐effectiveness and economic analysis. Health Technol Assess 2010; 14: 1–184. [DOI] [PubMed] [Google Scholar]
- 18. Dunkler D, Gao P, Lee SF, et al Risk prediction for early CKD in type 2 diabetes. Clin J Am Soc Nephrol 2015; 10: 1371–1379. [DOI] [PMC free article] [PubMed] [Google Scholar]
- 19. Ruggenenti P, Remuzzi G. Nephropathy of type 1 and type 2 diabetes: diverse pathophysiology, same treatment? Nephrol Dial Transplant 2000; 15: 1900–1902. [DOI] [PubMed] [Google Scholar]
- 20. Molitch ME, DeFronzo RA, Franz MJ, et al Nephropathy in diabetes. Diabetes Care 2004; 27(Suppl 1): S79–S83. [DOI] [PubMed] [Google Scholar]
- 21. Hadjadj S, Cariou B, Fumeron F, et al Death, end‐stage renal disease and renal function decline in patients with diabetic nephropathy in French cohorts of type 1 and type 2 diabetes. Diabetologia 2016; 59: 208–216. [DOI] [PubMed] [Google Scholar]
- 22. Looker HC, Colombo M, Hess S, et al Biomarkers of rapid chronic kidney disease progression in type 2 diabetes. Kidney Int 2015; 88: 888–896. [DOI] [PubMed] [Google Scholar]
- 23. Klein J. Biomarkers that predict diabetic nephropathy: the long road from finding targets to clinical use. Diabetes 2012; 61: 3072–3073. [DOI] [PMC free article] [PubMed] [Google Scholar]
- 24. Macisaac RJ, Ekinci EI, Jerums G. Markers of and risk factors for the development and progression of diabetic kidney disease. Am J Kidney Dis 2014; 63: S39–S62. [DOI] [PubMed] [Google Scholar]
- 25. Perkins BA, Ficociello LH, Silva KH, et al Regression of microalbuminuria in type 1 diabetes. N Engl J Med 2003; 348: 2285–2293. [DOI] [PubMed] [Google Scholar]
- 26. MacIsaac RJ, Tsalamandris C, Panagiotopoulos S, et al Nonalbuminuric renal insufficiency in type 2 diabetes. Diabetes Care 2004; 27: 195–200. [DOI] [PubMed] [Google Scholar]
- 27. Macisaac RJ, Jerums G. Diabetic kidney disease with and without albuminuria. Curr Opin Nephrol Hypertens 2011; 20: 246–257. [DOI] [PubMed] [Google Scholar]
- 28. Krolewski AS. Progressive renal decline: the new paradigm of diabetic nephropathy in type 1 diabetes. Diabetes Care 2015; 38: 954–962. [DOI] [PMC free article] [PubMed] [Google Scholar]
- 29. Adler AI, Stevens RJ, Manley SE, et al Development and progression of nephropathy in type 2 diabetes: the United Kingdom Prospective Diabetes Study (UKPDS 64). Kidney Int 2003; 63: 225–232. [DOI] [PubMed] [Google Scholar]
- 30. Soveri I, Berg UB, Bjork J, et al Measuring GFR: a systematic review. Am J Kidney Dis 2014; 64: 411–424. [DOI] [PubMed] [Google Scholar]
- 31. Schwartz GJ, Furth SL. Glomerular filtration rate measurement and estimation in chronic kidney disease. Pediatr Nephrol 2007; 22: 1839–1848. [DOI] [PubMed] [Google Scholar]
- 32. Camargo EG, Soares AA, Detanico AB, et al The Chronic Kidney Disease Epidemiology Collaboration (CKD‐EPI) equation is less accurate in patients with Type 2 diabetes when compared with healthy individuals. Diabet Med 2011; 28: 90–95. [DOI] [PubMed] [Google Scholar]
- 33. Gaspari F, Ruggenenti P, Porrini E, et al The GFR and GFR decline cannot be accurately estimated in type 2 diabetics. Kidney Int 2013; 84: 164–173. [DOI] [PubMed] [Google Scholar]
- 34. Maple‐Brown LJ, Ekinci EI, Hughes JT, et al Performance of formulas for estimating glomerular filtration rate in Indigenous Australians with and without Type 2 diabetes: the eGFR Study. Diabet Med 2014; 31: 829–838. [DOI] [PubMed] [Google Scholar]
- 35. Wood AJ, Churilov L, Perera N, et al Estimating glomerular filtration rate: performance of the CKD‐EPI equation over time in patients with type 2 diabetes. J Diabetes Complications 2016; 30: 49–54. [DOI] [PubMed] [Google Scholar]
- 36. MacIsaac RJ, Ekinci EI, Premaratne E, et al The Chronic Kidney Disease‐Epidemiology Collaboration (CKD‐EPI) equation does not improve the underestimation of Glomerular Filtration Rate (GFR) in people with diabetes and preserved renal function. BMC Nephrol 2015; 16: 198. [DOI] [PMC free article] [PubMed] [Google Scholar]
- 37. Skupien J, Warram JH, Smiles AM, et al The early decline in renal function in patients with type 1 diabetes and proteinuria predicts the risk of end‐stage renal disease. Kidney Int 2012; 82: 589–597. [DOI] [PMC free article] [PubMed] [Google Scholar]
- 38. Prakash J, Sen D, Usha, et al Non‐diabetic renal disease in patients with type 2 diabetes mellitus. J Assoc Physicians India 2001; 49: 415–420. [PubMed] [Google Scholar]
- 39. Lu B, Gong W, Yang Z, et al An evaluation of the diabetic kidney disease definition in chinese patients diagnosed with type 2 diabetes mellitus. J Int Med Res 2009; 37: 1493–1500. [DOI] [PubMed] [Google Scholar]
- 40. Byun JM, Lee CH, Lee SR, et al Renal outcomes and clinical course of nondiabetic renal diseases in patients with type 2 diabetes. Korean J Intern Med 2013; 28: 565–572. [DOI] [PMC free article] [PubMed] [Google Scholar]
- 41. Ekinci EI, Jerums G, Skene A, et al Renal structure in normoalbuminuric and albuminuric patients with type 2 diabetes and impaired renal function. Diabetes Care 2013; 36: 3620–3626. [DOI] [PMC free article] [PubMed] [Google Scholar]
- 42. Gonzalez Suarez ML, Thomas DB, Barisoni L, et al Diabetic nephropathy: is it time yet for routine kidney biopsy? World J Diabetes 2013; 4: 245–255. [DOI] [PMC free article] [PubMed] [Google Scholar]
- 43. Elley CR, Robinson T, Moyes SA, et al Derivation and validation of a renal risk score for people with type 2 diabetes. Diabetes Care 2013; 36: 3113–3120. [DOI] [PMC free article] [PubMed] [Google Scholar]
- 44. Jardine MJ, Hata J, Woodward M, et al Prediction of kidney‐related outcomes in patients with type 2 diabetes. Am J Kidney Dis 2012; 60: 770–778. [DOI] [PubMed] [Google Scholar]
- 45. Zoppini G, Targher G, Chonchol M, et al Predictors of estimated GFR decline in patients with type 2 diabetes and preserved kidney function. Clin J Am Soc Nephrol 2012; 7: 401–408. [DOI] [PubMed] [Google Scholar]
- 46. Altemtam N, Russell J, El Nahas M. A study of the natural history of diabetic kidney disease (DKD). Nephrol Dial Transplant 2012; 27: 1847–1854. [DOI] [PubMed] [Google Scholar]
- 47. Yokoyama H, Kanno S, Takahashi S, et al Determinants of decline in glomerular filtration rate in nonproteinuric subjects with or without diabetes and hypertension. Clin J Am Soc Nephrol 2009; 4: 1432–1440. [DOI] [PMC free article] [PubMed] [Google Scholar]
- 48. Rossing K, Christensen PK, Hovind P, et al Progression of nephropathy in type 2 diabetic patients. Kidney Int 2004; 66: 1596–1605. [DOI] [PubMed] [Google Scholar]
- 49. Bentata Y, Haddiya I, Latrech H, et al Progression of diabetic nephropathy, risk of end‐stage renal disease and mortality in patients with type‐1 diabetes. Saudi J Kidney Dis Transpl 2013; 24: 392–402. [DOI] [PubMed] [Google Scholar]
- 50. Molitch ME, Steffes M, Sun W, et al Development and progression of renal insufficiency with and without albuminuria in adults with type 1 diabetes in the diabetes control and complications trial and the epidemiology of diabetes interventions and complications study. Diabetes Care 2010; 33: 1536–1543. [DOI] [PMC free article] [PubMed] [Google Scholar]
- 51. Hovind P, Rossing P, Tarnow L, et al Smoking and progression of diabetic nephropathy in type 1 diabetes. Diabetes Care 2003; 26: 911–916. [DOI] [PubMed] [Google Scholar]
- 52. Hovind P, Rossing P, Tarnow L, et al Progression of diabetic nephropathy. Kidney Int 2001; 59: 702–709. [DOI] [PubMed] [Google Scholar]
- 53. Klein R, Zinman B, Gardiner R, et al The relationship of diabetic retinopathy to preclinical diabetic glomerulopathy lesions in type 1 diabetic patients: the Renin‐Angiotensin System Study. Diabetes 2005; 54: 527–533. [DOI] [PubMed] [Google Scholar]
- 54. Jerums G, Ekinci EI, Premaratne E, et al Diabetic nephropathy. In: International Textbook of Diabetes Mellitus. West Sussex: John Wiley & Sons, Ltd, 2015; 911–925. [Google Scholar]
- 55. Coresh J, Astor BC, Greene T, et al Prevalence of chronic kidney disease and decreased kidney function in the adult US population: Third National Health and Nutrition Examination Survey. Am J Kidney Dis 2003; 41: 1–12. [DOI] [PubMed] [Google Scholar]
- 56. Kostraba JN, Dorman JS, Orchard TJ, et al Contribution of diabetes duration before puberty to development of microvascular complications in IDDM subjects. Diabetes Care 1989; 12: 686–693. [DOI] [PubMed] [Google Scholar]
- 57. Svensson M, Eriksson JW, Dahlquist G. Early glycemic control, age at onset, and development of microvascular complications in childhood‐onset type 1 diabetes: a population‐based study in northern Sweden. Diabetes Care 2004; 27: 955–962. [DOI] [PubMed] [Google Scholar]
- 58. Svensson M, Nystrom L, Schon S, et al Age at onset of childhood‐onset type 1 diabetes and the development of end‐stage renal disease: a nationwide population‐based study. Diabetes Care 2006; 29: 538–542. [DOI] [PubMed] [Google Scholar]
- 59. Salardi S, Porta M, Maltoni G, et al Infant and toddler type 1 diabetes: complications after 20 years’ duration. Diabetes Care 2012; 35: 829–833. [DOI] [PMC free article] [PubMed] [Google Scholar]
- 60. Holl RW, Lang GE, Grabert M, et al Diabetic retinopathy in pediatric patients with type‐1 diabetes: effect of diabetes duration, prepubertal and pubertal onset of diabetes, and metabolic control. J Pediatr 1998; 132: 790–794. [DOI] [PubMed] [Google Scholar]
- 61. Olsen BS, Sjolie AK, Hougaard P, et al The significance of the prepubertal diabetes duration for the development of retinopathy and nephropathy in patients with type 1 diabetes. J Diabetes Complications 2004; 18: 160–164. [DOI] [PubMed] [Google Scholar]
- 62. Afkarian M. Diabetic kidney disease in children and adolescents. Pediatr Nephrol 2015; 30: 65–74. [DOI] [PMC free article] [PubMed] [Google Scholar]
- 63. Williamson JR, Rowold E, Chang K, et al Sex steroid dependency of diabetes‐induced changes in polyol metabolism, vascular permeability, and collagen cross‐linking. Diabetes 1986; 35: 20–27. [DOI] [PubMed] [Google Scholar]
- 64. Verani RR. Obesity‐associated focal segmental glomerulosclerosis: pathological features of the lesion and relationship with cardiomegaly and hyperlipidemia. Am J Kidney Dis 1992; 20: 629–634. [DOI] [PubMed] [Google Scholar]
- 65. Kambham N, Markowitz GS, Valeri AM, et al Obesity‐related glomerulopathy: an emerging epidemic. Kidney Int 2001; 59: 1498–1509. [DOI] [PubMed] [Google Scholar]
- 66. Darouich S, Goucha R, Jaafoura MH, et al Clinicopathological characteristics of obesity‐associated focal segmental glomerulosclerosis. Ultrastruct Pathol 2011; 35: 176–182. [DOI] [PubMed] [Google Scholar]
- 67. Huang WH, Chen CY, Lin JL, et al High body mass index reduces glomerular filtration rate decline in type II diabetes mellitus patients with stage 3 or 4 chronic kidney disease. Medicine (Baltimore) 2014; 93: e41. [DOI] [PMC free article] [PubMed] [Google Scholar]
- 68. Stegmayr B, Lithner F. Tobacco and end stage diabetic nephropathy. Br Med J (Clin Res Ed) 1987; 295: 581–582. [DOI] [PMC free article] [PubMed] [Google Scholar]
- 69. Sawicki PT, Didjurgeit U, Muhlhauser I, et al Smoking is associated with progression of diabetic nephropathy. Diabetes Care 1994; 17: 126–131. [DOI] [PubMed] [Google Scholar]
- 70. Obert DM, Hua P, Pilkerton ME, et al Environmental tobacco smoke furthers progression of diabetic nephropathy. Am J Med Sci 2011; 341: 126–130. [DOI] [PMC free article] [PubMed] [Google Scholar]
- 71. Chakkarwar VA. Smoking in diabetic nephropathy: sparks in the fuel tank? World J Diabetes 2012; 3: 186–195. [DOI] [PMC free article] [PubMed] [Google Scholar]
- 72. Chang YH, Chang DM, Lin KC, et al High‐density lipoprotein cholesterol and the risk of nephropathy in type 2 diabetic patients. Nutr Metab Cardiovasc Dis 2013; 23: 751–757. [DOI] [PubMed] [Google Scholar]
- 73. Thomas MC, Rosengard‐Barlund M, Mills V, et al Serum lipids and the progression of nephropathy in type 1 diabetes. Diabetes Care 2006; 29: 317–322. [DOI] [PubMed] [Google Scholar]
- 74. Moore KJ, Fisher EA. Dysfunctional HDL takes its toll in chronic kidney disease. Immunity 2013; 38: 628–630. [DOI] [PubMed] [Google Scholar]
- 75. Jenkins AJ, Lyons TJ, Zheng D, et al Lipoproteins in the DCCT/EDIC cohort: associations with diabetic nephropathy. Kidney Int 2003; 64: 817–828. [DOI] [PubMed] [Google Scholar]
- 76. Makinen VP, Soininen P, Kangas AJ, et al Triglyceride‐cholesterol imbalance across lipoprotein subclasses predicts diabetic kidney disease and mortality in type 1 diabetes: the FinnDiane Study. J Intern Med 2013; 273: 383–395. [DOI] [PubMed] [Google Scholar]
- 77. Meikle PJ, Wong G, Barlow CK, et al Lipidomics: potential role in risk prediction and therapeutic monitoring for diabetes and cardiovascular disease. Pharmacol Ther 2014; 143: 12–23. [DOI] [PubMed] [Google Scholar]
- 78. Reis A, Rudnitskaya A, Chariyavilaskul P, et al Top‐down lipidomics of low density lipoprotein reveal altered lipid profiles in advanced chronic kidney disease. J Lipid Res 2015; 56: 413–422. [DOI] [PMC free article] [PubMed] [Google Scholar]
- 79. Clustering of long‐term complications in families with diabetes in the diabetes control and complications trial. The Diabetes Control and Complications Trial Research Group. Diabetes 1997; 46: 1829–1839 [PubMed] [Google Scholar]
- 80. McKnight AJ, McKay GJ, Maxwell AP. Genetic and epigenetic risk factors for diabetic kidney disease. Adv Chronic Kidney Dis 2014; 21: 287–296. [DOI] [PubMed] [Google Scholar]
- 81. Dreyer G, Hull S, Mathur R, et al Progression of chronic kidney disease in a multi‐ethnic community cohort of patients with diabetes mellitus. Diabet Med 2013; 30: 956–963. [DOI] [PubMed] [Google Scholar]
- 82. Young BA, Maynard C, Boyko EJ. Racial differences in diabetic nephropathy, cardiovascular disease, and mortality in a national population of veterans. Diabetes Care 2003; 26: 2392–2399. [DOI] [PubMed] [Google Scholar]
- 83. Thomas M, Weekes AJ, Thomas MC. The management of diabetes in indigenous Australians from primary care. BMC Public Health 2007; 7: 303. [DOI] [PMC free article] [PubMed] [Google Scholar]
- 84. Lanting LC, Joung IM, Mackenbach JP, et al Ethnic differences in mortality, end‐stage complications, and quality of care among diabetic patients: a review. Diabetes Care 2005; 28: 2280–2288. [DOI] [PubMed] [Google Scholar]
- 85. Conway B, Fried L, Orchard T. Hemoglobin and overt nephropathy complications in type 1 diabetes. Ann Epidemiol 2008; 18: 147–155. [DOI] [PMC free article] [PubMed] [Google Scholar]
- 86. Li Vecchi M, Fuiano G, Francesco M, et al Prevalence and severity of anaemia in patients with type 2 diabetic nephropathy and different degrees of chronic renal insufficiency. Nephron Clin Pract 2007; 105: c62–c67. [DOI] [PubMed] [Google Scholar]
- 87. New JP, Aung T, Baker PG, et al The high prevalence of unrecognized anaemia in patients with diabetes and chronic kidney disease: a population‐based study. Diabet Med 2008; 25: 564–569. [DOI] [PubMed] [Google Scholar]
- 88. Thomas MC. Anemia in diabetes: marker or mediator of microvascular disease? Nat Clin Pract Nephrol 2007; 3: 20–30. [DOI] [PubMed] [Google Scholar]
- 89. Choukroun G, Renou M, Lecaque C, et al TREAT or not to treat: anemia in type 2 diabetes and chronic kidney disease at stages 3 and 4. Nephrol Ther 2011; 7: 2–9. [DOI] [PubMed] [Google Scholar]
- 90. Stevens PE. Anaemia, diabetes and chronic kidney disease: where are we now? J Ren Care 2012; 38(Suppl 1): 67–77. [DOI] [PubMed] [Google Scholar]
- 91. Fernandez‐Juarez G, Luno J, Barrio V, et al 25 (OH) vitamin D levels and renal disease progression in patients with type 2 diabetic nephropathy and blockade of the renin‐angiotensin system. Clin J Am Soc Nephrol 2013; 8: 1870–1876. [DOI] [PMC free article] [PubMed] [Google Scholar]
- 92. Rosolowsky ET, Ficociello LH, Maselli NJ, et al High‐normal serum uric acid is associated with impaired glomerular filtration rate in nonproteinuric patients with type 1 diabetes. Clin J Am Soc Nephrol 2008; 3: 706–713. [DOI] [PMC free article] [PubMed] [Google Scholar]
- 93. Yan D, Tu Y, Jiang F, et al Uric Acid is independently associated with diabetic kidney disease: a cross‐sectional study in a Chinese population. PLoS ONE 2015; 10: e0129797. [DOI] [PMC free article] [PubMed] [Google Scholar]
- 94. Zoppini G, Targher G, Chonchol M, et al Serum uric acid levels and incident chronic kidney disease in patients with type 2 diabetes and preserved kidney function. Diabetes Care 2012; 35: 99–104. [DOI] [PMC free article] [PubMed] [Google Scholar]
- 95. Kim WJ, Kim SS, Bae MJ, et al High‐normal serum uric acid predicts the development of chronic kidney disease in patients with type 2 diabetes mellitus and preserved kidney function. J Diabetes Complications 2014; 28: 130–134. [DOI] [PubMed] [Google Scholar]
- 96. Ficociello LH, Rosolowsky ET, Niewczas MA, et al High‐normal serum uric acid increases risk of early progressive renal function loss in type 1 diabetes: results of a 6‐year follow‐up. Diabetes Care 2010; 33: 1337–1343. [DOI] [PMC free article] [PubMed] [Google Scholar]
- 97. Maahs DM, Caramori ML, Cherney DZI, et al Uric acid lowering to prevent kidney function loss in diabetes: the preventing early renal function loss (PERL) allopurinol study. Curr Diab Rep 2013; 13: 550–559. [DOI] [PMC free article] [PubMed] [Google Scholar]
- 98. Goicoechea M, Garcia de Vinuesa S, Verdalles U, et al Allopurinol and progression of CKD and cardiovascular events: long‐term follow‐up of a randomized clinical trial. Am J Kidney Dis 2015; 65: 543–549. [DOI] [PubMed] [Google Scholar]
- 99. Kanji T, Gandhi M, Clase CM, et al Urate lowering therapy to improve renal outcomes in patients with chronic kidney disease: systematic review and meta‐analysis. BMC Nephrol 2015; 16: 58. [DOI] [PMC free article] [PubMed] [Google Scholar]
- 100. Li L‐X, Wang A‐P, Zhang R, et al Decreased urine uric acid excretion is an independent risk factor for chronic kidney disease but not for carotid atherosclerosis in hospital‐based patients with type 2 diabetes: a cross‐sectional study. Cardiovasc Diabetol 2015; 14: 36. [DOI] [PMC free article] [PubMed] [Google Scholar]
- 101. Sheen YJ, Lin JL, Li TC, et al Peripheral arterial stiffness is independently associated with a rapid decline in estimated glomerular filtration rate in patients with type 2 diabetes. Biomed Res Int 2013; 2013: 309294. [DOI] [PMC free article] [PubMed] [Google Scholar]
- 102. Bouchi R, Babazono T, Mugishima M, et al Arterial stiffness is associated with incident albuminuria and decreased glomerular filtration rate in type 2 diabetic patients. Diabetes Care 2011; 34: 2570–2575. [DOI] [PMC free article] [PubMed] [Google Scholar]
- 103. Brenner BM, Lawler EV, Mackenzie HS. The hyperfiltration theory: a paradigm shift in nephrology. Kidney Int 1996; 49: 1774–1777. [DOI] [PubMed] [Google Scholar]
- 104. Mogensen CE. Microalbuminuria, blood pressure and diabetic renal disease: origin and development of ideas. Diabetologia 1999; 42: 263–285. [DOI] [PubMed] [Google Scholar]
- 105. Cachat F, Combescure C, Cauderay M, et al A systematic review of glomerular hyperfiltration assessment and definition in the medical literature. Clin J Am Soc Nephrol 2015; 10: 382–389. [DOI] [PMC free article] [PubMed] [Google Scholar]
- 106. Rudberg S, Osterby R. Decreasing glomerular filtration rate–an indicator of more advanced diabetic glomerulopathy in the early course of microalbuminuria in IDDM adolescents? Nephrol Dial Transplant 1997; 12: 1149–1154. [DOI] [PubMed] [Google Scholar]
- 107. Magee GM, Bilous RW, Cardwell CR, et al Is hyperfiltration associated with the future risk of developing diabetic nephropathy? A meta‐analysis. Diabetologia 2009; 52: 691–697. [DOI] [PubMed] [Google Scholar]
- 108. Moriya T, Tsuchiya A, S‐i Okizaki, et al Glomerular hyperfiltration and increased glomerular filtration surface are associated with renal function decline in normo‐ and microalbuminuric type 2 diabetes. Kidney Int 2012; 81: 486–493. [DOI] [PubMed] [Google Scholar]
- 109. Amin R, Turner C, van Aken S, et al The relationship between microalbuminuria and glomerular filtration rate in young type 1 diabetic subjects: the Oxford Regional Prospective Study. Kidney Int 2005; 68: 1740–1749. [DOI] [PubMed] [Google Scholar]
- 110. Thomson HJ, Ekinci EI, Radcliffe NJ, et al Elevated baseline glomerular filtration rate (GFR) is independently associated with a more rapid decline in renal function of patients with type 1 diabetes. J Diabetes Complications 2016; 30: 256–261 [DOI] [PubMed] [Google Scholar]
- 111. Silveiro SP, Friedman R, de Azevedo MJ, et al Five‐year prospective study of glomerular filtration rate and albumin excretion rate in normofiltering and hyperfiltering normoalbuminuric NIDDM patients. Diabetes Care 1996; 19: 171–174. [DOI] [PubMed] [Google Scholar]
- 112. Chaiken RL, Eckert‐Norton M, Bard M, et al Hyperfiltration in African‐American patients with type 2 diabetes. Cross‐sectional and longitudinal data. Diabetes Care 1998; 21: 2129–2134. [DOI] [PubMed] [Google Scholar]
- 113. Zerbini G, Bonfanti R, Meschi F, et al Persistent renal hypertrophy and faster decline of glomerular filtration rate precede the development of microalbuminuria in type 1 diabetes. Diabetes 2006; 55: 2620–2625. [DOI] [PubMed] [Google Scholar]
- 114. Ficociello LH, Perkins BA, Roshan B, et al Renal hyperfiltration and the development of microalbuminuria in type 1 diabetes. Diabetes Care 2009; 32: 889–893. [DOI] [PMC free article] [PubMed] [Google Scholar]
- 115. Mogensen CE, Andersen MJF. Increased kidney size and glomerular filtration rate in untreated juvenile diabetes: normalization by insulin‐treatment. Diabetologia 1975; 11: 221–224. [DOI] [PubMed] [Google Scholar]
- 116. Woods LL, Mizelle HL, Hall JE. Control of renal hemodynamics in hyperglycemia: possible role of tubuloglomerular feedback. Am J Physiol 1987; 252: F65–F73. [DOI] [PubMed] [Google Scholar]
- 117. Cherney DZI, Sochett EB, Dekker MG, et al Ability of cystatin C to detect acute changes in glomerular filtration rate provoked by hyperglycaemia in uncomplicated Type 1 diabetes. Diabet Med 2010; 27: 1358–1365. [DOI] [PubMed] [Google Scholar]
- 118. Premaratne E, Verma S, Ekinci EI, et al The impact of hyperfiltration on the diabetic kidney. Diabetes Metab 2015; 41: 5–17. [DOI] [PubMed] [Google Scholar]
- 119. Ekinci EI, Hughes JT, Chatfield MD, et al Hyperfiltration in Indigenous Australians with and without diabetes. Nephrol Dial Transplant 2015; 30: 1877–1884. [DOI] [PubMed] [Google Scholar]
- 120. Okada H, Fukui M, Tanaka M, et al Visit‐to‐visit blood pressure variability is a novel risk factor for the development and progression of diabetic nephropathy in patients with type 2 diabetes. Diabetes Care 2013; 36: 1908–1912. [DOI] [PMC free article] [PubMed] [Google Scholar]
- 121. Yokota K, Fukuda M, Matsui Y, et al Visit‐to‐visit variability of blood pressure and renal function decline in patients with diabetic chronic kidney disease. J Clin Hypertens (Greenwich) 2014; 16: 362–366. [DOI] [PMC free article] [PubMed] [Google Scholar]
- 122. Solini A. Blood pressure variability: a new target to slow the progression of vascular damage in type 2 diabetes? J Diabetes Complications 2014; 28: 117–118. [DOI] [PubMed] [Google Scholar]
- 123. Rodriguez‐Segade S, Rodriguez J, Garcia Lopez JM, et al Intrapersonal HbA(1c) variability and the risk of progression of nephropathy in patients with type 2 diabetes. Diabet Med 2012; 29: 1562–1566. [DOI] [PubMed] [Google Scholar]
- 124. Hsu CC, Chang HY, Huang MC, et al HbA1c variability is associated with microalbuminuria development in type 2 diabetes: a 7‐year prospective cohort study. Diabetologia 2012; 55: 3163–3172. [DOI] [PubMed] [Google Scholar]
- 125. Wadén J, Forsblom C, Thorn LM, et al A1C variability predicts incident cardiovascular events, microalbuminuria, and overt diabetic nephropathy in patients with type 1 diabetes. Diabetes 2009; 58: 2649–2655. [DOI] [PMC free article] [PubMed] [Google Scholar]
- 126. Penno G, Solini A, Bonora E, et al HbA1c variability as an independent correlate of nephropathy, but not retinopathy, in patients with type 2 diabetes: the Renal Insufficiency And Cardiovascular Events (RIACE) Italian multicenter study. Diabetes Care 2013; 36: 2301–2310. [DOI] [PMC free article] [PubMed] [Google Scholar]
- 127. Thomas MC. Glycemic exposure, glycemic control, and metabolic karma in diabetic complications. Adv Chronic Kidney Dis 2014; 21: 311–317. [DOI] [PubMed] [Google Scholar]
- 128. Chalmers J, Cooper ME. UKPDS and the legacy effect. N Engl J Med 2008; 359: 1618–1620. [DOI] [PubMed] [Google Scholar]
- 129. Bianchi C, Del Prato S. Metabolic memory and individual treatment aims in type 2 diabetes–outcome‐lessons learned from large clinical trials. Rev Diabet Stud 2011; 8: 432–440. [DOI] [PMC free article] [PubMed] [Google Scholar]
- 130. Bangalore S, Breazna A, DeMicco DA, et al Visit‐to‐visit low‐density lipoprotein cholesterol variability and risk of cardiovascular outcomes: insights from the TNT trial. J Am Coll Cardiol 2015; 65: 1539–1548. [DOI] [PubMed] [Google Scholar]
- 131. Farag M, Theverkalam G, Ekinci EI, et al Soluble TNF receptors: a biomarker for diabetic kidney disease? JSciMedCentral 2015; 2. [Google Scholar]
- 132. Niewczas MA, Gohda T, Skupien J, et al Circulating TNF receptors 1 and 2 predict ESRD in type 2 diabetes. J Am Soc Nephrol 2012; 23: 507–515. [DOI] [PMC free article] [PubMed] [Google Scholar]
- 133. Gohda T, Niewczas MA, Ficociello LH, et al Circulating TNF receptors 1 and 2 predict stage 3 CKD in type 1 diabetes. J Am Soc Nephrol 2012; 23: 516–524. [DOI] [PMC free article] [PubMed] [Google Scholar]
- 134. Pavkov ME, Nelson RG, Knowler WC, et al Elevation of circulating TNF receptors 1 and 2 increases the risk of end‐stage renal disease in American Indians with type 2 diabetes. Kidney Int 2015; 87: 812–819. [DOI] [PMC free article] [PubMed] [Google Scholar]
- 135. Sonoda Y, Gohda T, Suzuki Y, et al Circulating TNF receptors 1 and 2 are associated with the severity of renal interstitial fibrosis in IgA nephropathy. PLoS ONE 2015; 10: e0122212. [DOI] [PMC free article] [PubMed] [Google Scholar]
- 136. Currie G, McKay G, Delles C. Biomarkers in diabetic nephropathy: present and future. World J Diabetes 2014; 5: 763–776. [DOI] [PMC free article] [PubMed] [Google Scholar]
- 137. Kuehn EW, Park KM, Somlo S, et al Kidney injury molecule‐1 expression in murine polycystic kidney disease. Am J Physiol Renal Physiol 2002; 283: F1326–F1336. [DOI] [PubMed] [Google Scholar]
- 138. van Timmeren MM, van den Heuvel MC, Bailly V, et al Tubular kidney injury molecule‐1 (KIM‐1) in human renal disease. J Pathol 2007; 212: 209–217. [DOI] [PubMed] [Google Scholar]
- 139. Vaidya VS, Niewczas MA, Ficociello LH, et al Regression of microalbuminuria in type 1 diabetes is associated with lower levels of urinary tubular injury biomarkers, kidney injury molecule‐1, and N‐acetyl‐beta‐D‐glucosaminidase. Kidney Int 2011; 79: 464–470. [DOI] [PMC free article] [PubMed] [Google Scholar]
- 140. Conway BR, Manoharan D, Manoharan D, et al Measuring urinary tubular biomarkers in type 2 diabetes does not add prognostic value beyond established risk factors. Kidney Int 2012; 82: 812–818. [DOI] [PubMed] [Google Scholar]
- 141. Nielsen SE, Reinhard H, Zdunek D, et al Tubular markers are associated with decline in kidney function in proteinuric type 2 diabetic patients. Diabetes Res Clin Pract 2012; 97: 71–76. [DOI] [PubMed] [Google Scholar]
- 142. Mishra J, Mori K, Ma Q, et al Neutrophil gelatinase‐associated lipocalin: a novel early urinary biomarker for cisplatin nephrotoxicity. Am J Nephrol 2004; 24: 307–315. [DOI] [PubMed] [Google Scholar]
- 143. Constantin JM, Futier E, Perbet S, et al Plasma neutrophil gelatinase‐associated lipocalin is an early marker of acute kidney injury in adult critically ill patients: a prospective study. J Crit Care 2010; 25: 176.e1–6. [DOI] [PubMed] [Google Scholar]
- 144. Bolignano D, Lacquaniti A, Coppolino G, et al Neutrophil gelatinase‐associated lipocalin as an early biomarker of nephropathy in diabetic patients. Kidney Blood Press Res 2009; 32: 91–98. [DOI] [PubMed] [Google Scholar]
- 145. Fu W‐J, Li B‐L, Wang S‐B, et al Changes of the tubular markers in type 2 diabetes mellitus with glomerular hyperfiltration. Diabetes Res Clin Pract 2012; 95: 105–109. [DOI] [PubMed] [Google Scholar]
- 146. Panduru NM, Forsblom C, Saraheimo M, et al Urinary liver‐type fatty acid‐binding protein and progression of diabetic nephropathy in type 1 diabetes. Diabetes Care 2013; 36: 2077–2083. [DOI] [PMC free article] [PubMed] [Google Scholar]
- 147. Araki S, Haneda M, Koya D, et al Predictive effects of urinary liver‐type fatty acid‐binding protein for deteriorating renal function and incidence of cardiovascular disease in type 2 diabetic patients without advanced nephropathy. Diabetes Care 2013; 36: 1248–1253. [DOI] [PMC free article] [PubMed] [Google Scholar]
- 148. Li R, Chung ACK, Yu X, et al MicroRNAs in diabetic kidney disease. Int J Endocrinol 2014; 2014: 593956. [DOI] [PMC free article] [PubMed] [Google Scholar]
- 149. McClelland AD, Kantharidis P. microRNA in the development of diabetic complications. Clin Sci (Lond) 2014; 126: 95–110. [DOI] [PubMed] [Google Scholar]
- 150. Kantharidis P, Hagiwara S, Brennan E, et al Study of microRNA in diabetic nephropathy: isolation, quantification and biological function. Nephrology 2015; 20: 132–139. [DOI] [PubMed] [Google Scholar]
- 151. Wang B, Jha JC, Hagiwara S, et al Transforming growth factor‐beta1‐mediated renal fibrosis is dependent on the regulation of transforming growth factor receptor 1 expression by let‐7b. Kidney Int 2014; 85: 352–361. [DOI] [PubMed] [Google Scholar]
- 152. Trionfini P, Benigni A, Remuzzi G. MicroRNAs in kidney physiology and disease. Nat Rev Nephrol 2015; 11: 23–33. [DOI] [PubMed] [Google Scholar]
- 153. Murray P, Chune GW, Raghavan VA. Legacy effects from DCCT and UKPDS: what they mean and implications for future diabetes trials. Curr Atheroscler Rep 2010; 12: 432–439. [DOI] [PubMed] [Google Scholar]
- 154. Aschner PJ, Ruiz AJ. Metabolic memory for vascular disease in diabetes. Diabetes Technol Ther 2012; 14(Suppl 1): S68–S74. [DOI] [PubMed] [Google Scholar]
- 155. Zhang L, Chen B, Tang L. Metabolic memory: mechanisms and implications for diabetic retinopathy. Diabetes Res Clin Pract 2012; 96: 286–293. [DOI] [PubMed] [Google Scholar]
- 156. Pozzilli P, Strollo R, Bonora E. One size does not fit all glycemic targets for type 2 diabetes. J Diabetes Investig 2014; 5: 134–141. [DOI] [PMC free article] [PubMed] [Google Scholar]
- 157. van Steenkiste B, van der Weijden T, Stoffers HE, et al Barriers to implementing cardiovascular risk tables in routine general practice. Scand J Prim Health Care 2004; 22: 32–37. [DOI] [PubMed] [Google Scholar]
- 158. Gupta R, Stocks NP, Broadbent J. Cardiovascular risk assessment in Australian general practice. Aust Fam Physician 2009; 38: 364–368. [PubMed] [Google Scholar]
- 159. Sullivan GM, Feinn R. Using effect size—or why the P value is not enough. J Grad Med Educ 2012; 4: 279–282. [DOI] [PMC free article] [PubMed] [Google Scholar]