

The mechanics of a lightweight three-dimensional graphene assembly, quantified by computational simulation and 3D printing, are discussed.
Keywords: Materials Design, multiscale, Graphene, Additive Manufacturing, Mechanical properties, hierarchical, porous materials
Abstract
Recent advances in three-dimensional (3D) graphene assembly have shown how we can make solid porous materials that are lighter than air. It is plausible that these solid materials can be mechanically strong enough for applications under extreme conditions, such as being a substitute for helium in filling up an unpowered flight balloon. However, knowledge of the elastic modulus and strength of the porous graphene assembly as functions of its structure has not been available, preventing evaluation of its feasibility. We combine bottom-up computational modeling with experiments based on 3D-printed models to investigate the mechanics of porous 3D graphene materials, resulting in new designs of carbon materials. Our study reveals that although the 3D graphene assembly has an exceptionally high strength at relatively high density (given the fact that it has a density of 4.6% that of mild steel and is 10 times as strong as mild steel), its mechanical properties decrease with density much faster than those of polymer foams. Our results provide critical densities below which the 3D graphene assembly starts to lose its mechanical advantage over most polymeric cellular materials.
INTRODUCTION
Graphene is one of the stiffest and strongest materials (1, 2). Besides its outstanding mechanical properties, its atomic thickness and large surface area make it ideal for many engineering applications (3–5), albeit materials-by-design examples of using graphene to form bulk materials and achieve targeted material properties remain rare. A single piece of graphene is too delicate to generate mechanical functions; it is beneficial to have graphene preassembled as a three-dimensional (3D) scaffold, inheriting high stiffness and strength from the 2D graphene as the building block. This assembly by design is applicable to materials science, energy and environmental innovations, and many other fields of study (6–10). There is recent progress in making graphene-based porous materials, and several different experimental methods have been used to produce the material (7, 10, 11). These materials combine lightness with strength, and it is claimed that they can be lighter than air (12). It is intriguing to ask whether the material, in vacuum, can be a substitute for helium in unpowered flight; in this case, the material must be sufficiently strong to avoid being crushed by the surrounding air pressure. Although the mechanical behavior of graphene per se has been well characterized, the relationship between its porous structure and its mechanics is largely unknown, and the experimental measurements for its stiffness and strength vary widely (12–19). Moreover, the failure mechanisms are not well understood, and it is not clear how its mechanical properties relate to its structure from the nanoscale to larger scales. Mechanical models derived from computational modeling and experiments can guide design strategies to improve the mechanical performance of this material. Here, we focus especially on studying the material architecture that allows graphene to form stable 3D porous bulk materials, implemented at different scales in the material, to achieve a set of target bulk material properties including stiffness and tensile and compression strength, which are the mechanical properties most involved with engineering applications.
In the literature, the strength of a 3D graphene assembly has been measured using previous tensile tests (12, 14, 16). A material with a bulk density of 1.5 to 110 mg/cm3 has been measured to have a tensile strength of 0.011 to 11 MPa (12, 14, 16). Considering that its building block is graphene, which has a density of 2300 mg/cm3 and a strength of 130 GPa (1), its strength is estimated to be 2.2 to 1360 MPa by using the same scaling laws as the polymeric open-cell foam, because the strength-density plot has a slope of 3/2 on a double logarithmic plot (20, 21). This estimation is several orders of magnitude larger than what is measured in previous experiments (12, 14, 16). Such a sharp difference suggests that the mechanics of the 3D graphene assembly are very different from those of conventional polymeric foams.
RESULTS
Full atomic models of the 3D graphene assembly
To understand this difference, we built full atomic models of the 3D graphene assembly in molecular dynamics (MD) simulations by mimicking the synthesis of the porous material. Large-scale simulations based on a reactive force field (22–24) are performed to simulate the process of fusing graphene flakes together into the 3D assembly (see fig. S1 and Supplementary Materials). The initial model, as illustrated in Fig. 1A, is composed of graphene flakes with dimensions following the lognormal distribution to avoid negative values for the dimensions and spherical inclusions of a constant diameter that mimic the effect of water clusters in freeze-casting porous graphene materials (13). The graphene flakes have no functional groups, and the edges are modeled without hydrogen for efficient formation of covalent bonds between flakes, which result in a 3D graphene assembly close to the polycrystalline graphene from chemical vapor deposition (CVD) (25, 26). It has been shown that CVD graphene in low hydrogen pressure is not terminated by hydrogen or functional groups (27). These graphene flakes are randomly distributed and oriented inside the simulation box (Fig. 1B). This initial state is close to a gas with a density of 3.9 mg/cm3. We design a cyclic protocol to condense the material. Each of the cycles is composed of four stages, and we control both the temperature and pressure for each stage, as shown in Fig. 1C. Repeating the cycle enables us to obtain the condensed graphene flakes, as shown in Fig. 1E. We find that, by repeating the cycle more than eight times, we are able to obtain an equilibrated structure and the total number of covalent bonds NC–C converges from 1.22 to 1.4 for each carbon atom (Fig. 1G), which is close to that of the ideal graphene with an infinitely large size (1.5 per atom). After removing the inclusions and equilibrating the carbon material under ambient conditions, we are able to obtain a stable structure of the 3D graphene assembly that closely represents the irregular experimental sample, as shown in Fig. 1F. It has a density of 366.2 mg/cm3, which is 4.6% that of mild steel. The diameter of the spherical inclusions can be tuned during synthesis to adjust the density and make the material lighter. We note that most of the walls are curved adjacent to the junction where several of them meet (Fig. 1F). This curvature is induced by defects in the form of pentagons and heptagons at grain boundaries (25), which cause out-of-plane deformations (28, 29) and achieve defined 3D architectures composed of nondevelopable surfaces (8).
Fig. 1. Computational synthesis of the 3D graphene assembly.
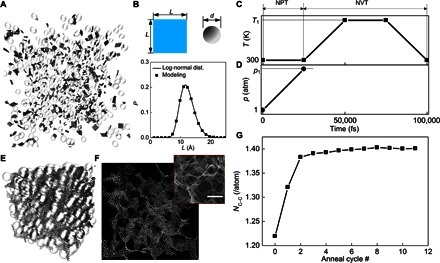
(A) Initial model composed of 500 randomly distributed rectangular graphene flakes and spherical inclusions. (B) Schematics of the graphene with L dimensions that follows a lognormal distribution as given below and spherical inclusion with uniform d in diameter. (C) The targeting temperature T as a function of simulation time in the alternative NPT-NVT ensemble during each equilibration cycle. (D) The targeting pressure p as a function of simulation time in the alternative NPT-NVT ensemble during each equilibration cycle, which is only applicable to the first stage from 0 to 25 ps. (E) The closely packed graphene-inclusion structure obtained after cyclic equilibrations. (F) The equilibrated structure of the 3D graphene assembly after removing the spherical inclusions with dimensions of 11 nm × 11 nm × 11 nm, and the SEM image of a graphene assembly [reproduced from Wu et al. (8)]. Scale bar, 20 μm (inset). (G) The total number of covalent bonds counted at the end of each anneal cycle, averaged by the total number of carbon atoms in the system.
Mechanical response of the 3D graphene assembly under loading
We estimate the mechanical properties of this material by simulating uniaxial tension and compressive tests. A series of snapshots of the structure during the simulation is given in Fig. 2A, and the full force extension–compression curve is given in Fig. 2B. The material has a Young’s modulus of 2.8 GPa (given by the slope of the stress-strain curve at the zero strain point) and a tensile strength of 2.7 GPa (the peak stress in the stress-strain curve), which is an order of magnitude higher than that of mild steel. We observe that the strain stiffening behavior of the material in tension is governed by the bending of the graphene walls, aligning them toward the loading direction at large deformations before rupture (Fig. 2A, iii). The compressive strength of the material is measured to be 0.6 GPa, which corresponds to the point before the more significant increment of the stress (measured by averaging the stress between 0.1 and 0.3 strain), and it is found to be governed by the buckling of the walls in compression (Fig. 2A, i). We find that, for small deformations (less than 0.02 strain), Poisson’s ratio is measured to be 0.3 in both tensile and compressive loadings (Fig. 2C). For large compressive deformations, there is almost zero strain in directions perpendicular to the loading direction once buckling occurs (Fig. 2C and fig. S2 for volume change). This agrees with what has been observed in recent experiments (8, 30). Note that we did not consider functional groups in the current 3D graphene structures because our model is constructed on the basis of the CVD graphene. Additional chemical groups could be expected to affect both the nonbonded interaction between two facing layers and the material strength of the graphene itself; these effects may play roles that could affect the mechanics of the graphene but are not included in our current model.
Fig. 2. Mechanical tests on the 3D graphene assembly.
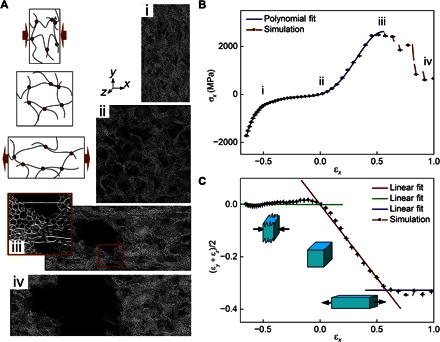
(A) Simulation snapshots of the full atomic graphene structure in tension and compressive tests that are taken at εx = −0.5, 0.0, 0.6, and 1.0 for (i) to (iv), respectively. The atomic stress and its distribution at different strain states are computed and included in fig. S3. The symmetric distribution of positive and negative stress suggests that the graphene is largely bent under deformation. Insets show schematics for the different mechanisms of the material behavior under compression and tension. (B) Full stress-strain curve of the material under compression and tension force. (C) The average strains in the two directions other than the loading direction as a function of εx; for |εx| < 0.02, the slope of the curve is measured to be −0.3. For larger deformations, the three linear fits on the plot have slopes of 0.03, −0.6, and 0.04 from left to right of the curve.
Scaling laws of the mechanics of the 3D graphene assembly
We repeat the mechanical tests in computational simulations but use different material samples with their mass density varying between 80 and 962 mg/cm3 by altering the inclusion diameter during the material preparation. We measure the Young’s modulus (E), tensile strength (σT), and compressive strength (σC) obtained in our simulations (data in table S1), and we normalize these results by the mechanical features of graphene (ρs, Es, and σTs), as summarized in Fig. 3. In analogy to the mechanics of polymeric open-cell foam (20, 21), we plot the data points as functions of the material density on double logarithmic graphs, which allow us to determine the scaling laws of the mechanical properties of the material as
| (1) |
| (2) |
| (3) |
Fig. 3.
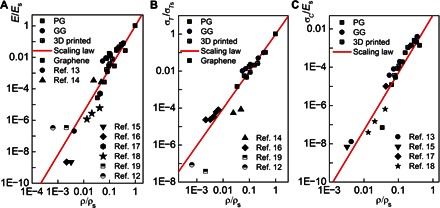
The normalized Young’s modulus (A), tensile strength (B), and compressive strength (C) of the 3D graphene assembly as a function of its mass density.The data points include mechanical test results of the full atomic 3D graphene assembly (PG), the full atomic gyroid graphene (GG), and the 3D-printed polymer samples (3D-printed). The solid curves are plotted according to scaling laws obtained in the study with slopes of 2.73, 2.01, and 3.01 for (A), (B), and (C), respectively. ρs = 2300 mg/cm3, ES = 1.02 TPa, and σTs = 130 GPa correspond to the density, Young’s modulus, and tensile strength of graphene for its in-plane mechanics, which are used to normalize the properties of graphene materials (PG, GG, and references mentioned). ρs = 1175 mg/cm3, ES = 2.45 GPa, and σTs = 50 MPa correspond to the density, Young’s modulus, and tensile strength of the bulk material properties of polymer material for 3D printing, which are used to normalize the results of 3D-printed samples.
Compared to previous experiments on 3D graphene assembly (the so-called graphene aerogel) in the literature, our results show an overall agreement with the results obtained from different measurements (12–19). They follow the same scaling law, suggesting that their mechanics as a function of the density are mainly dominated by their structures, and our simulation model captures the essential mechanism of their deformation under mechanical loading up to failure. However, we note that the experiments described in the literature use several different techniques to prepare the material samples, such as CVD and freeze-drying (7, 11, 19), leading to different defect forms, and thereby, the results are more dispersed than our modeling results. Considering the power index of the functions of mechanics versus density, Young’s modulus (2.73 ± 0.09), tensile strength (2.01 ± 0.05), and compressive strength (3.01 ± 0.01) are overall larger than those of conventional polymeric open-cell foams (2, 1.5, and 2 for Young’s modulus, tensile strength, and compressive elastic strength, respectively) (20, 31), suggesting that the microstructures of the graphene assembly are very different from those of conventional polymeric open-cell foams. From conventional polymeric foams, it has been learned that a bending-dominated foam structure generally gives a larger power index than a stretch-dominated foam structure (21). This point is supported by the distribution of atomic stress in our simulations, which shows that the stress distribution is quite symmetric for atoms under compression (negative stress) and tension (positive stress), as shown in fig. S3. Therefore, the results suggest that the high power indexes of the 3D graphene assembly are caused by the bending-dominated behavior that may be even stronger than the ideal bending-dominated polymeric open-cell foams. Our findings would be applicable to predicting the overall mechanical properties of graphene aerogels. It can be further used not only to decide the aerogel density according to the specific mechanical requests but also to provide a well-defined trade-off between density and mechanics. This knowledge will be useful for designing complex structures and composite materials by assigning materials with an optimized material distribution that leads to the highest mechanical strength with the least total material usage.
Mechanics of a pristine gyroid graphene structure
To understand the effect of defects, we built an idealized atomic 3D graphene structure by taking its geometry as a periodic gyroid porous structure, which accounts for the common geometric feature of the graphene structure because each unit cell is composed of a highly curved 2D graphene surface (20, 21, 31). The gyroid shape guarantees minimum density under a given periodicity because the structure is known to have a minimum surface area in a given volume (that is, minimal surface), which corresponds to the 2D nature of graphene in 3D geometry. We obtain equilibrated structures by three different processes (see Supplementary Materials and fig. S4), adopting external potential as
| (4) |
where ∑EC–C accounts for all interactions among carbon atoms in graphene, described by the adaptive intermolecular reactive empirical bond order (AIREBO) potential (23, 24); λ is a Lagrange multiplier for the constraint energy of the desired geometry; (xi,yi,zi) is the Cartesian coordinate of each carbon atom; and L is the length constant of the periodic structure in all three directions, which directly affects the density of the graphene material as ρ ~ L− 1 (see table S2 for detailed data). As the result of iterative modifications of the geometry based on our algorithm, all carbon atoms have a bond number of three, which is the same number as the pristine graphene, with mainly heptagon and pentagon defects to foam curved surfaces. Their coordinates satisfy the minimum Egraphene, and thus, the overall geometry approximates the mathematical form of the gyroid structure as
| (5) |
which has the geometry shown in Fig. 4A. On the basis of our new algorithm, we can design and build the atomic structures of the 3D graphene structure with different length constants (L), as shown in Fig. 4B. Notably, we ensure the convergence of the coordinate number and potential energy before deciding the final structures, and thus, the lattice structure is overall continuous without large holes, and all carbon atoms mainly have a pentagon, hexagon, or heptagon ring shape, which has been proven to not affect the fracture toughness of graphene (25). We investigate the mechanical properties of gyroid graphene structures by applying tensile and compression deformation to the atomic models and by recording the stress in the material (see the Supplementary Materials for the loading conditions and measurement of mechanical properties; see fig. S5 for the stress-strain curves of the loading tests). Their deformation and failure mechanisms largely represent those of the 3D graphene assembly (fig. S6), and their mechanical properties, including Young’s modulus and tensile and compression strength as a function of their material density, are summarized in Fig. 3 (and data in table S2).
Fig. 4. Different atomistic and 3D-printed models of gyroid geometry for mechanical tests.
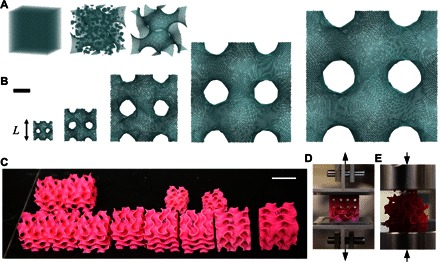
(A) Simulation snapshots taken during the modeling of the atomic 3D graphene structure with gyroid geometry, representing key procedures including (i) generating the coordinate of uniformly distributed carbon atoms based on the fcc structure, (ii) generating a gyroid structure with a triangular lattice feature, and (iii) refinement of the modified geometry from a gyroid with a triangular lattice to one with a hexagonal lattice. (B) Five models of gyroid graphene with different length constants of L = 3, 5, 10, 15, and 20 nm from left to right. Scale bar, 2.5 nm. (C) 3D-printed samples of the gyroid structure of various L values and wall thicknesses. Scale bar, 2.5 cm. The tensile and compressive tests on the 3D-printed sample are shown in (D) and (E), respectively.
Mechanics of large-scale 3D-printed gyroid structures
We use Eq. 5 to build large-scale 3D gyroid models by using a high-resolution 3D printer (see Materials and Methods for the detailed protocols). Using different combinations of cell size and wall thickness, we are able to design different 3D porous computational models with a gyroid architecture and with material densities ranging from 92.2 to 401.6 mg/cm3. The models, as shown in Fig. 4C, provide us samples that are 107 times longer than the full atomic models of the same gyroid geometry to carry out tensile and compressive tests (Fig. 4, D and E, with strain-stress curves in fig. S7 and detailed snapshots in fig. S8). Material failure, including crack generation and propagation in tensile loading as well as wall buckling and breaking in compressive loading, is also observed in our full atomic simulations. After normalizing the results with the bulk material properties of the 3D printing material (with the numerical value of all the data points summarized in table S3), they agree with the scaling laws as identified for the 3D graphene assembly, as shown in Fig. 3. This agreement suggests that the mechanics of the 3D graphene assembly are mainly governed by its geometry, and the gyroid structure represents a very relevant architecture. Such an agreement between 3D graphene and 3D-printed models, which are made of photoreactive polymers with mechanics very different from those of graphene, suggests that the index of the scaling laws derived from this study may still be applicable to a wide range of other 2D materials as long as they can turn into gyroid structures similar to graphene.
DISCUSSION
3D carbon materials of desired mechanical properties by design are useful for multifunctional engineering applications. Our results reveal that, by designing the chemical synthesizing process, especially the reacting conditions, including pressure and temperature, we can fuse graphene flakes and produce stable 3D porous bulk materials with material architecture and density under control. By fully characterizing the material properties, we can derive scaling laws, which can be used to achieve a set of target bulk material properties. We have demonstrated that the scaling laws derived from the 3D graphene assembly can be used to design and predict the mechanical properties of a pristine 3D graphene structure as well as 3D-printed models with gyroid geometries and a wide density distribution, showing that the material architecture features, instead of the mechanics of its constituting materials, play a more dominant role in governing the scaling laws. As shown in the scaling law, higher density provides better mechanics. Also, the connectivity between flakes is critical for the mechanical properties. As shown in the construction of the 3D graphene assembly, refining the structure based on annealing may improve its mechanical properties. The study provides a simple way to predict the mechanics of graphene aerogels, and using graphene aerogels of different densities as building blocks can be helpful in designing larger-scale structures. This conclusion can be generally applied to guide designs of structural materials of diverse functions by using universal constituting materials.
With the scaling law, we can directly answer the question asked earlier: Can we use graphene as a building block to form a 3D bulk material that is strong yet lighter than air? In particular, can this material be designed and synthesized as a substitute for helium in unpowered flight balloons? This requires the material to satisfy σC > 1 atm and ρ < 1.16 mg/cm3 simultaneously. According to the scaling law, these two conditions cannot be satisfied simultaneously because σC > 1 atm yields ρ > 28.7 mg/cm3 and ρ < 1.16 mg/cm3 yields σC < 6.39 × 10⁻⁵ atm, suggesting either filling gas with a lower density or implementing structural materials as necessary conditions for these applications.
We compare the scaling laws for a 3D graphene assembly with those for other porous polymeric materials. The mechanics-density trade-off for a 3D graphene assembly is significantly more biased than that for conventional porous materials, resulting in a much softer and weaker material once the density of the material decreases (20, 21). For example, although graphene has the highest in-plane stiffness and strength, the advantage of the 3D graphene assembly (particularly its stiffness) over woven structures made of polystyrene may only exist for ρ > 10 mg/cm3 but not for materials lighter than this critical value, as shown in Fig. 5.
Fig. 5. Comparison between the mechanics of the 3D graphene assembly and a polymeric foam as functions of mass density.
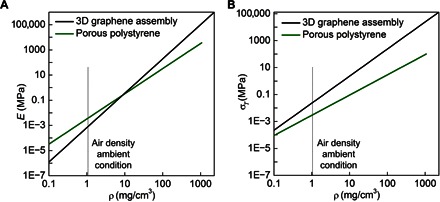
Young’s modulus (A) and tensile strength (B) of the 3D graphene assembly compared to those of porous polystyrene with a woven and foam structure with ρs = 1065 mg/cm3, ES = 3.67 GPa, and σTs = 100 MPa; its scaling laws, and , were obtained from previous studies (20, 21).
Although the porous graphene assembly can likely (but not directly) substitute helium, its material features, including its ultralight nature, outstanding mechanical properties, high surface area, and stable chemical and thermal properties, remain promising for many engineering applications, making products lighter and stronger, which can thereby play a profound game-changing role in broad industrial areas. Using the knowledge learned from the current study that the natural curved 2D surface of graphene is disadvantageous to the mechanics of the 3D assembly, we are working toward further designing and optimizing the structure of these porous materials by tuning the surface chemistry of graphene and combining the 2D material with other polymers for a more efficient use of the material and to derive improved mechanical scaling laws. The combination of a theoretical model and computational simulations provides a powerful tool to explore these opportunities for carbon material designs.
MATERIALS AND METHODS
MD simulation and the force field
MD simulations in this study were performed via LAMMPS MD package (22) using the AIREBO force field to model the internal interactions among carbon atoms in graphene (23, 24). This has been widely used and has been proven to be a reliable force field to reproduce the mechanical behavior observed experimentally in graphene (32, 33). According to this model, the total potential energy of the system is given by
| (6) |
where
| (7) |
accounts for all interactions among carbon atoms in graphene. Moreover, denotes the REBO term of hydrocarbon (24) and is an explicit four-body potential that describes various dihedral angle preferences in hydrocarbon configurations. Detailed expressions for and are given in the study of Stuart et al. (23).
| (8) |
is the pair interaction between a carbon atom and inclusion particles, as well as the interaction between two inclusion particles, where rij is the distance between the two particles (the cutoff function Ξ = 1 for rij < 20 Ǻ and Ξ = 0 for rij ≥ 20 Ǻ), ϵ = 15 kcal/mol (which relates to the stiffness of the inclusion), and σ is the zero energy distance with rij = 21/6 σ = d/2 as the effective radius of the inclusion. We found that σ affected the density of the 3D graphene assembly because σ = 20 Ǻ resulted in ρ = 80 mg/cm3, σ = 15 Ǻ resulted in ρ = 148 mg/cm3, σ = 10 Ǻ resulted in ρ = 366.2 mg/cm3, and σ = 2 Ǻ resulted in ρ = 962 mg/cm3.
Design and modeling of the chemical process of fusing graphene flakes into the 3D graphene assembly
The initial system was composed of 500 rectangular graphene flakes with a dimension of L(i) for each flake, as well as 500 spherical inclusions with a uniform diameter d, as shown in Fig. 1B. The value of L follows the lognormal distribution with a probability density function of
| (9) |
where and are functions related to the mean value Ǻ and the standard deviation LSD = 4.8 Ǻ used throughout our study. Using the system, we simulated the chemical process of fusing the graphene flakes to form the 3D graphene assembly (details are provided in the Supplementary Materials).
Tensile test on the 3D graphene assembly
We deformed the 3D graphene assembly in a quasi-static manner. Periodic conditions were applied to all the directions of the simulation box. We first equilibrated the system in the NPT ensemble under ambient conditions (T = 300 K and p = 1 atm) and then deformed the simulation box in a stepwise fashion for 1% uniaxial strain with p = 1 atm applied to the other two directions. Each strain increment is followed by energy minimization and equilibration in the NVT ensemble with T = 300 K.
Design and modeling of the pristine periodic gyroid graphene structures
To understand the mechanical properties of the idealized 3D graphene, we used the gyroid structure (following Eq. 5) that has a minimum surface area in a given volume (also called minimal surface). Thus, the shape guarantees the minimum density under a given periodicity. To achieve the geometry, we first introduced the external potential to the Lennard-Jones (LJ) particle system
| (10) |
to build a triangular template for the initial geometry. It was found that the shorter equilibrium distance of the LJ potential than the graphene bond (~1.42 Å) was better for the latter process to refine geometry, and ϵ had little effect on the geometry if strength of the external potential λ was strong enough to bind atoms on the surface. In our model, the parameters were set to ϵ = 0.25 kcal/mol, σ = 1.15 Å, rcut = 3.0 Å, and λ = 460 kcal/mol. The initial geometry of LJ particles was chosen as a face-centered cubic (fcc) solid with a 5.8 Å lattice constant, as shown in Fig. 4A (left). Then, the system was heated up to 1000 from 350 K for 100 ps. After the system was cooled down to 10 K for another 100 ps, we obtained the initial triangular geometry of the gyroid, as shown in Fig. 4A (middle) and fig. S3 (B and C). Next, we removed atoms based on the bond number for hexagonal geometry because the triangular geometry was not applicable for the refining algorithm. After obtaining the bond number of all atoms based on the distance criteria (set at 2 Å here), the atoms having more than six bonds were removed. We removed all atoms under these conditions until there was no atom having six bonds. After removing atoms having four and five bonds, we obtained the hexagonal geometry for the next process, as shown in fig. S3E. Finally, we extended the previous algorithm to generate polycrystalline graphene to refine the geometry obtained from previous processes (25). We added atoms based on the bond number and relaxed the structure with energy minimization and short MD runs. We used the modified potential based on Eq. 4 for gyroid graphene with the same parameters for the LJ potential. After removing atoms not satisfying three bonds, we added atoms to make hexagonal structures. Iteratively, this process was repeated until there was no more update. We were able to obtain the final geometry of the gyroid graphene structure, as shown in Fig. 4A (right). The quality of grain boundary was similar to the previous polycrystalline graphene models, most of which had five to seven rings and a few of which had eight rings for the small defects.
3D printing of a porous structure with gyroid geometry
A collection of coordinates (x,y,z) of randomly generated dispersed points on the gyroid surface was generated according to Eq. 5. The total surface area of a unit cell was given by S = 2.96L2. MeshLab was used to read the coordinate as input and generate a meshed surface and then extrude to a 3D solid structure with a defined wall thickness d. The density of the 3D-printed porous material was given by
| (11) |
where ρs is the density of the bulk material for printing. Using different combinations of d and L, we were able to design different 3D porous computational models with a gyroid architecture and with material densities ranging from 92.2 to 401.6 mg/cm3. Thereafter, the computational model was input to a high-resolution and multimaterial 3D printer, Object500, made by Stratasys, which allowed us to print complex geometries at 20-μm resolution. The material we used for printing is called VeroMagenta, and has ρs = 1175 mg/cm3, ES = 2.45 GPa, and σTs = 50 MPa, corresponding to the density, Young’s modulus, and tensile strength of the bulk material properties. The material samples we designed and created for this study, with dimensions of 1.5 inches × 1.5 inches × 1.5 inches or 1.0 inch × 1.0 inch × 1.0 inch and of various thickness values, are shown in Fig. 4C. Their mechanical properties, which are summarized in table S3, also have a wide range; for example, the Young’s modulus of the porous material ranged from 3.0 to 184.9 MPa.
Mechanical tests on 3D-printed gyroid samples
The tensile tests were carried out at room temperature with a standard tensile testing machine (MTS Corporation). In each of the tensile tests, the material sample was attached to two T-shaped aluminum substrates with epoxy glue. The aluminum substrates were fixed to the crosshead, which moved at a constant rate of displacement (0.01 mm/s). For the compressive test, the samples were directly compressed by two parallel crossheads with a large enough flat surface. The upper crosshead was held by a force transducer where the reaction force was measured. The crosshead displacement was measured using a linear voltage displacement transducer mounted inside the actuator. The total force and displacement of the substrate were scanned with 1 Hz and saved to the connected data collector. We checked during the multiple tests to ensure that there was no detachment or misalignment of the samples or substrates that could affect the results.
Supplementary Material
Acknowledgments
We thank L. Gibson, N. Fang, and J. Kong (all from Massachusetts Institute of Technology) for helpful discussion of theoretical analysis. We thank S. Rudolph for help in the design and setup of the tensile and compressive tests on 3D-printed samples. Funding: The authors acknowledge support from the Office of Naval Research (Grant No. N00014-16-1-233) and Air Force Office of Scientific Research Multidisciplinary University Research Initiative (Grant No. FA9550-15-1-0514). The authors also acknowledge support from BASF-NORA. Author contributions: Z.Q. and M.J.B. designed the study. Z.Q. and G.S.J. performed computational modeling, carried out simulations, and analyzed modeling data. Z.Q. and M.J.K. designed and prepared the 3D-printed models, performed the mechanical tests, and analyzed the experimental data. All authors contributed to the writing of the paper. Competing interests: The authors declare that they have no competing interests. Data and materials availability: All data needed to evaluate the conclusions in the paper are present in the paper and/or the Supplementary Materials. Additional data related to this paper may be requested from M.J.B. (mbuehler@mit.edu).
SUPPLEMENTARY MATERIALS
Supplementary material for this article is available at http://advances.sciencemag.org/cgi/content/full/3/1/e1601536/DC1
Supplementary Methods
fig. S1. Material density of the graphene assembly as a function of elevated pressure.
fig. S2. The total volume of the 3D graphene assembly as functions of the applied strain.
fig. S3. The atomic stress (σxx) distribution in the 3D graphene assembly under a tensile loading test.
fig. S4. The processes of building a gyroid graphene structure from three steps.
fig. S5. Stress-strain curves of tensile and compressive tests on gyroid graphene.
fig. S6. Snapshots of tensile and compressive tests with different strains on gyroid graphene.
fig. S7. Stress-strain curves of tensile and compressive tests for 3D-printed gyroid samples.
fig. S8. Experimental snapshots of the tensile and compressive tests on 3D-printed samples.
table S1. Summary of the mechanical properties of different 3D graphene assemblies.
table S2. Summary of the mechanical properties of different gyroid graphene structures.
table S3. Summary of the mechanical properties of different 3D-printed gyroid structures obtained from experiments.
REFERENCES AND NOTES
- 1.Lee C., Wei X., Kysar J. W., Hone J., Measurement of the elastic properties and intrinsic strength of monolayer graphene. Science 321, 385–388 (2008). [DOI] [PubMed] [Google Scholar]
- 2.Geim A. K., Novoselov K. S., The rise of graphene. Nat. Mater. 6, 183–191 (2007). [DOI] [PubMed] [Google Scholar]
- 3.Bao W., Miao F., Chen Z., Zhang H., Jang W., Dames C., Lau C. N., Controlled ripple texturing of suspended graphene and ultrathin graphite membranes. Nat. Nanotechnol. 4, 562–566 (2009). [DOI] [PubMed] [Google Scholar]
- 4.Zang J., Ryu S., Pugno N., Wang Q., Tu Q., Buehler M. J., Zhao X., Multifunctionality and control of the crumpling and unfolding of large-area graphene. Nat. Mater. 12, 321–325 (2013). [DOI] [PMC free article] [PubMed] [Google Scholar]
- 5.Joshi R. K., Carbone P., Wang F. C., Kravets V. G., Su Y., Grigorieva I. V., Wu H. A., Geim A. K., Nair R. R., Precise and ultrafast molecular sieving through graphene oxide membranes. Science 343, 752–754 (2014). [DOI] [PubMed] [Google Scholar]
- 6.Stankovich S., Dikin D. A., Dommett G. H. B., Kohlhaas K. M., Zimney E. J., Stach E. A., Piner R. D., Nguyen S. B. T., Ruoff R. S., Graphene-based composite materials. Nature 442, 282–286 (2006). [DOI] [PubMed] [Google Scholar]
- 7.Chen Z., Ren W., Gao L., Liu B., Pei S., Cheng H.-M., Three-dimensional flexible and conductive interconnected graphene networks grown by chemical vapour deposition. Nat. Mater. 10, 424–428 (2011). [DOI] [PubMed] [Google Scholar]
- 8.Wu Y., Yi N., Huang L., Zhang T., Fang S., Chang H., Li N., Oh J., Lee J. A., Kozlov M., Chipara A. C., Terrones H., Xiao P., Long G., Huang Y., Zhang F., Zhang L., Lepró X., Haines C., Lima M. D., Lopez N. P., Rajukumar L. P., Elias A. L., Feng S., Kim S. J., Narayanan N. T., Ajayan P. M., Terrones M., Aliev A., Chu P., Zhang Z., Baughman R. H., Chen Y., Three-dimensionally bonded spongy graphene material with super compressive elasticity and near-zero Poisson’s ratio. Nat. Commun. 6, 6141 (2015). [DOI] [PubMed] [Google Scholar]
- 9.Kuang J., Liu L., Gao Y., Zhou D., Chen Z., Han B., Zhang Z., A hierarchically structured graphene foam and its potential as a large-scale strain-gauge sensor. Nanoscale 5, 12171–12177 (2013). [DOI] [PubMed] [Google Scholar]
- 10.Jiang L., Fan Z., Design of advanced porous graphene materials: From graphene nanomesh to 3D architectures. Nanoscale 6, 1922–1945 (2014). [DOI] [PubMed] [Google Scholar]
- 11.Bi H., Yin K., Xie X., Zhou Y., Wan N., Xu F., Banhart F., Sun L., Ruoff R. S., Low temperature casting of graphene with high compressive strength. Adv. Mater. 24, 5124–5129 (2012). [DOI] [PubMed] [Google Scholar]
- 12.Sun H., Xu Z., Gao C., Multifunctional, ultra-flyweight, synergistically assembled carbon aerogels. Adv. Mater. 25, 2554–2560 (2013). [DOI] [PubMed] [Google Scholar]
- 13.Xie X., Zhou Y., Bi H., Yin K., Wan S., Sun L., Large-range control of the microstructures and properties of three-dimensional porous graphene. Sci. Rep. 3, 2117 (2013). [DOI] [PMC free article] [PubMed] [Google Scholar]
- 14.Xu Z., Zhang Y., Li P., Gao C., Strong, conductive, lightweight, neat graphene aerogel fibers with aligned pores. ACS Nano 6, 7103–7113 (2012). [DOI] [PubMed] [Google Scholar]
- 15.Li J., Zhao S., Zhang G., Gao Y., Deng L., Sun R., Wong C.-P., A facile method to prepare highly compressible three-dimensional graphene-only sponge. J. Mater. Chem. A 3, 15482–15488 (2015). [Google Scholar]
- 16.Luan V. H., Tien H. N., Hoa L. T., Hien N. T. M., Oh E.-S., Chung J. S., Kim E. J., Choi W. M., Kong B.-S., Hur S. H., Synthesis of a highly conductive and large surface area graphene oxide hydrogel and its use in a supercapacitor. J. Mater. Chem. A 1, 208–211 (2013). [Google Scholar]
- 17.Worsley M. A., Kucheyev S. O., Mason H. E., Merrill M. D., Mayer B. P., Lewicki J., Valdez C. A., Suss M. E., Stadermann M., Pauzauskie P. J., Satcher J. H. Jr, Biener J., Baumann T. F., Mechanically robust 3D graphene macroassembly with high surface area. Chem. Commun. 48, 8428–8430 (2012). [DOI] [PubMed] [Google Scholar]
- 18.Zhang X., Sui Z., Xu B., Yue S., Luo Y., Zhan W., Liu B., Mechanically strong and highly conductive graphene aerogel and its use as electrodes for electrochemical power sources. J. Mater. Chem. 21, 6494–6497 (2011). [Google Scholar]
- 19.Nieto A., Boesl B., Agarwal A., Multi-scale intrinsic deformation mechanisms of 3D graphene foam. Carbon 85, 299–308 (2015). [Google Scholar]
- 20.L. J. Gibson, M. F. Ashby, The mechanics of three-dimensional cellular materials, in Proceedings of the Royal Society of London. Series A, Mathematical and Physical Sciences, Great Britain, 8 July 1982 (Royal Society, 1982), pp. 43–59. [Google Scholar]
- 21.Ashby M. F., The properties of foams and lattices. Philos. Trans. R. Soc. London Ser. A 364, 15–30 (2006). [DOI] [PubMed] [Google Scholar]
- 22.Plimpton S., Fast parallel algorithms for short-range molecular-dynamics. J. Comput. Phys. 117, 1–19 (1995). [Google Scholar]
- 23.Stuart S. J., Tutein A. B., Harrison J. A., A reactive potential for hydrocarbons with intermolecular interactions. J. Chem. Phys. 112, 6472–6486 (2000). [Google Scholar]
- 24.Brenner D. W., Shenderova O. A., Harrison J. A., Stuart S. J., Ni B., Sinnott S. B., A second-generation reactive empirical bond order (REBO) potential energy expression for hydrocarbons. J. Phys. Condens. Matter 14, 783–802 (2002). [Google Scholar]
- 25.Jung G. S., Qin Z., Buehler M. J., Molecular mechanics of polycrystalline graphene with enhanced fracture toughness. Extreme Mech. Lett. 2, 52–59 (2015). [Google Scholar]
- 26.Song Z., Artyukhov V. I., Yakobson B. I., Xu Z., Pseudo Hall–Petch strength reduction in polycrystalline graphene. Nano Lett. 13, 1829–1833 (2013). [DOI] [PubMed] [Google Scholar]
- 27.He K., Lee G.-D., Robertson A. W., Yoon E., Warner J. H., Hydrogen-free graphene edges. Nat. Commun. 5, 3040 (2014). [DOI] [PubMed] [Google Scholar]
- 28.Terrones H., Terrones M., Curved nanostructured materials. New J. Phys. 5, 126.1–126.37 (2003). [Google Scholar]
- 29.Zhang T., Gao H. J., Toughening graphene with topological defects: A perspective. J. Appl. Mech. 82, 051001 (2015). [Google Scholar]
- 30.Zhu C., Han T. Y.-J., Duoss E. B., Golobic A. M., Kuntz J. D., Spadaccini C. M., Worsley M. A., Highly compressible 3D periodic graphene aerogel microlattices. Nat. Commun. 6, 6962 (2015). [DOI] [PMC free article] [PubMed] [Google Scholar]
- 31.L. J. Gibson, M. F. Ashby, Cellular Solids: Structure and Properties (Cambridge Univ. Press, ed. 2, 1997). [Google Scholar]
- 32.Wei Y., Wu J., Yin H., Shi X., Yang R., Dresselhaus M., The nature of strength enhancement and weakening by pentagon–heptagon defects in graphene. Nat. Mater. 11, 759–763 (2012). [DOI] [PubMed] [Google Scholar]
- 33.Qin Z., Taylor M., Hwang M., Bertoldi K., Buehler M. J., Effect of wrinkles on the surface area of graphene: Toward the design of nanoelectronics. Nano Lett. 14, 6520–6525 (2014). [DOI] [PubMed] [Google Scholar]
Associated Data
This section collects any data citations, data availability statements, or supplementary materials included in this article.
Supplementary Materials
Supplementary material for this article is available at http://advances.sciencemag.org/cgi/content/full/3/1/e1601536/DC1
Supplementary Methods
fig. S1. Material density of the graphene assembly as a function of elevated pressure.
fig. S2. The total volume of the 3D graphene assembly as functions of the applied strain.
fig. S3. The atomic stress (σxx) distribution in the 3D graphene assembly under a tensile loading test.
fig. S4. The processes of building a gyroid graphene structure from three steps.
fig. S5. Stress-strain curves of tensile and compressive tests on gyroid graphene.
fig. S6. Snapshots of tensile and compressive tests with different strains on gyroid graphene.
fig. S7. Stress-strain curves of tensile and compressive tests for 3D-printed gyroid samples.
fig. S8. Experimental snapshots of the tensile and compressive tests on 3D-printed samples.
table S1. Summary of the mechanical properties of different 3D graphene assemblies.
table S2. Summary of the mechanical properties of different gyroid graphene structures.
table S3. Summary of the mechanical properties of different 3D-printed gyroid structures obtained from experiments.