Abstract
BACKGROUND
Asian Americans (AAs) are the fastest growing U.S. population, and when properly distinguished by their ethnic origins, exhibit substantial heterogeneity in socioeconomic status, health behaviors, and health outcomes. Cancer is the second leading cause of death in the US, yet trends and current patterns in the mortality burden of cancer among AA ethnic groups have not been documented.
METHODS
We report age-adjusted rates, standardized mortality ratios, and modeled trends in cancer-related mortality in the following Asian American (AA) ethnicities: Asian Indians, Chinese, Filipinos, Japanese, Koreans, and Vietnamese, from 2003–2011, with non-Hispanic whites (NHW) as the reference population.
RESULTS
For most cancer sites, AAs had lower cancer mortality than NHWs, however, mortality patterns were heterogeneous across Asian American ethnicities. Stomach and liver cancer mortality was very high, particularly among Chinese, Koreans, and Vietnamese, for whom these two cancer types combined accounted for 15–25% of cancer deaths, but less than 5% of cancer deaths in NHWs. In AA women, lung cancer was a leading cause of death but (unlike males and NHW females) rates did not decline over the study period.
CONCLUSIONS
Ethnicity-specific analyses are critical to understanding the national burden of cancer among the heterogeneous AA population.
IMPACT
Our findings highlight the need for disaggregated reporting of cancer statistics in AAs, and warrant consideration of tailored screening programs for liver and gastric cancers.
Keywords: cancer mortality, Asian Americans, ethnic disparities, epidemiology
INTRODUCTION
Surpassing Hispanics as the most rapidly growing racial/ethnic group in the U.S., Asian Americans (AAs) currently number nearly 17.3 million, representing 5.6% of the U.S. population (1) and that number is expected to exceed 40 million by 2050 (2). As a single category, AAs exhibit tremendous heterogeneity, reflective not only of their >30 countries of origin and >100 languages, but also in their immigration trends, cultural diversity, and degree of acculturation, socioeconomic status (SES), insurance coverage, health beliefs, use of health services, diets, body size, and lifestyles (3–6). Because of clustering of AA ethnicities into certain occupations and neighborhoods, the environments where AAs live and work can also vary greatly (e.g., air pollution, workplace chemicals, built environment) (7, 8). All these factors can greatly impact the cancer mortality burden in these populations.
Recent publications based on the Surveillance, Epidemiology, and End Results (SEER) program have improved our understanding of cancer incidence (9) and cancer survival (10) by AA ethnicity. However, as Asian ethnic subgroups were only recently disaggregated on death records in many states, an updated, comprehensive report of national cancer mortality patterns and trends by disaggregated AA ethnicity has yet to be published. To fill this knowledge gap, we report AA ethnicity-specific cancer mortality rates and, for the first time, mortality trends during the years 2003–2011.
MATERIALS AND METHODS
Study Data
The new version of the U.S. death certificate, implemented starting in 2003, collects detailed Asian ethnicity for six major subgroups (Asian Indian, Chinese, Filipino, Japanese, Korean, and Vietnamese) in pre-defined checkboxes. These subgroups make up about 85% of all AAs in the U.S. according to the 2010 US Census. Until its release, only 7 US states (California, Hawaii, Illinois, New Jersey, New York, Texas, and Washington), chosen in 1977 because they housed two thirds of the nation’s AAs, collected detailed Asian ethnicity. In 2010, 64% of AA’s lived in these states, which are also among the most urban in the nation. However, many other states experienced tremendous growth in their AA populations in the last decade(1). Between 2003 and 2011, 33 additional states (Supplementary Table 1) adopted the new version of the U.S. Standard Certificate of Death and began reporting AA deaths in all six categories. We obtained data on cancer-related deaths from 2003 to 2011 for a total of 41 states from the National Center for Health Statistics (NCHS) mortality records.
Year of death, age, sex, and race/ethnicity of the decedent, location of death, and the underlying cause of death (disease or injury that initiated the events resulting in death) were identified from death certificate data. “Underlying cause of death” was coded by NCHS using International Classification of Diseases, 10th revision (ICD-10; specific codes provided in Supplementary Table 2). We chose 10 cancer sites based on their overall contribution to AA mortality burden from 2003 to 2011: stomach, colon and rectum, pancreas, liver, lung and bronchus, female breast cancer, ovary, prostate, non-Hodgkins lymphoma, and leukemia. These 10 sites make up 75% of the cancer-related deaths in AAs between 2003 and 2011. Statistics calculated for “all cancer sites” include the aforementioned sites as well as all other sites not mentioned.
The study population included 85,616 AA decedents who were identified on their death certificates (usually by the next of kin or the medical examiner) as Asian Indian, Chinese, Filipino, Japanese, Korean or Vietnamese, and 4,116,783 Non-Hispanic White (NHW) decedents, to serve as a comparison group. Blacks, Hispanics, Native Hawaiians and Pacific Islanders, and any AA decedents reported as more than one ethnicity or as “Other Asian”, were not included in the present study. Statistics calculated for “aggregate Asians” pertain to the six aforementioned subgroups combined.
Statistical Analysis
The 2003 version death certificate was not adopted at the same time for all states in our sample. To accommodate this, we introduced each state into the numerator and denominator only after they adopted the new form (Supplementary Table 1). In order to estimate denominator population counts for the study period, we used linear interpolation and extrapolation based on age-specific population counts from the 2000 and 2010 Census. We calculated three statistics for each stratum, as defined by cancer site, sex, and ethnicity: proportional cancer mortality (PCM), age-adjusted mortality rates (AMR), and standardized mortality ratios (SMR). PCM was calculated as the stratum-specific proportion of all cancer deaths. AMRs and 95% confidence intervals (CI) (11) were calculated as deaths per 100,000 persons for the combined 9-year study period, 2003–2011, and were obtained by applying the stratum-specific mortality rates to the standard age distribution of the 2000 U.S. Census population. Since AMRs were standardized using the same reference population, site-specific rates are comparable across strata. Rates based on small death counts tend to have poor reliability (12), and can threaten confidentiality of decedents, therefore we did not report any AMRs based on any count of <16 deaths (13). Indirectly standardized mortality ratios (SMR) were calculated as the ratio of the stratum-specific deaths to the expected number of stratum-specific deaths, the latter of which were estimated by applying the NHW (reference population) mortality rate rates to the stratum-specific age distribution. The SMR was chosen as the relative measure because it is the minimum variance estimator of the common rate ratio, a property that is advantageous when death counts are small (14). Each SMR is weighted by the stratum-specific age distribution and not a standard distribution, so they may be used to compare site-specific mortality from different cancer types within any given ethnicity, but not between ethnicities. Trends for cancer-related mortality were described via joinpoint regression analysis (15), which involves fitting a series of joined straight lines on a log scale to the trends in the annual (2-year or 3-year when annual death counts were too low) age-adjusted rates (16). Line segments are joined at “joinpoints”, which denote a statistically significant (p ≤.05) change in trend. The tests of significance use a Monte Carlo Permutation method (i.e. it finds “the best fit” line for each segment). A maximum of one joinpoint (two line segments) were allowed for each model due to our limited follow-up time. Once the line segments were established, the estimated annual percent change (APC) was used to describe and test the statistical significance of the trends. Direct and indirect age adjustment was performed using PROC STDRATE in SAS version 9.3 (SAS Institute, Cary NC), joinpoint regressions were fit using the SEER*Stat software (17) and all figures created using Microsoft Excel.
RESULTS
We ranked the top 5 cancers by proportion of total cancer deaths by ethnicity and found that lung cancer accounted for the highest mortality burden in all male subgroups and all female subgroups with the exception of Asian Indians and Filipinas, both of which ranked breast cancer as the highest (Table 1). For all ethnicities (including NHW) the following cancers accounted for more than 40% of all cancer mortality: lung, female breast, colorectal, liver and stomach (Figure 1). However, AAs die from cancer of any site at about 60% the rate of NHWs (Table 2). Among AAs, Korean males (SMR: 0.69, 95% CI 0.67 to 0.71) and Japanese females (SMR: 0.70, 95% CI 0.68 to 0.71) had the highest overall cancer mortality. Asian Indians have the lowest overall cancer mortality rates (male SMR: 0.35, 95% CI 0.34 to 0.36; female SMR: 0.41, 95% CI 0.39 to 0.42). Trend analysis (Figures 2 and 3) revealed that all ethnicity-specific AA mortality rates of cancer at any site were either stable or declining during the study period.
Table 1.
Top 5 sites of cancer-related mortality – as a proportion of all cancer deaths – by Race/Ethnicity (2003–2011)
| Males | NHW | Aggregate Asian | Asian Indian | Chinese | Filipino | Japanese | Korean | Vietnamese |
|---|---|---|---|---|---|---|---|---|
| 1 | Lung 31.0% |
Lung 26.8% |
Lung 19.0% |
Lung 28.13% |
Lung 30.7% |
Lung 23.9% |
Lung 22.8% |
Lung 28.1% |
| 2 | Prostate 9.2% |
Colorectal 10.5% |
Colorectal 8.3% |
Liver 11.7% |
Colorectal 10.8% |
Colorectal 13.1% |
Stomach 14.6% |
Liver 22.3% |
| 3 | Colorectal 9.1% |
Liver 10.3% |
Prostate 8.1% |
Colorectal 10.4% |
Prostate 8.9% |
Prostate 8.9% |
Liver 12.9% |
Colorectal 7.9% |
| 4 | Pancreas 5.8% |
Pancreas 6.3% |
Pancreas 7.0% |
Stomach 6.5% |
Liver 7.6% |
Stomach 8.8% |
Colorectal 11.0% |
Stomach 6.5% |
| 5 | Leukemia 4.4% |
Prostate 6.3% |
Leukemia 6.3% |
Pancreas 5.9% |
Pancreas 5.7% |
Pancreas 8.4% |
Pancreas 7.4% |
Pancreas 4.4% |
| Females | NHW | Aggregate Asian | Asian Indian | Chinese | Filipino | Japanese | Korean | Vietnamese |
| 1 | Lung 27.3% |
Lung 19.6% |
Breast 19.8% |
Lung 22.2% |
Breast 19.5% |
Lung 21.4% |
Lung 18.5% |
Lung 21.7% |
| 2 | Breast 14.6% |
Breast 13.7% |
Ovary 9.7% |
Breast 11.8% |
Lung 18.1% |
Colorectal 12.9% |
Stomach 11.6% |
Breast 10.3% |
| 3 | Colorectal 9.6% |
Colorectal 10.8% |
Lung 9.3% |
Colorectal 11.9% |
Colorectal 9.0% |
Breast 10.7% |
Colorectal 11.4% |
Colorectal 9.6% |
| 4 | Pancreas 6.2% |
Pancreas 7.5% |
Colorectal 6.8% |
Pancreas 7.2% |
Pancreas 6.7% |
Pancreas 9.6% |
Pancreas 8.2% |
Liver 9.3% |
| 5 | Ovary 5.6% |
Stomach 5.6% |
Pancreas 5.9% |
Stomach 5.4% |
Ovary 6.0% |
Stomach 6.5% |
Liver 7.2% |
Stomach 6.3% |
Figure 1.
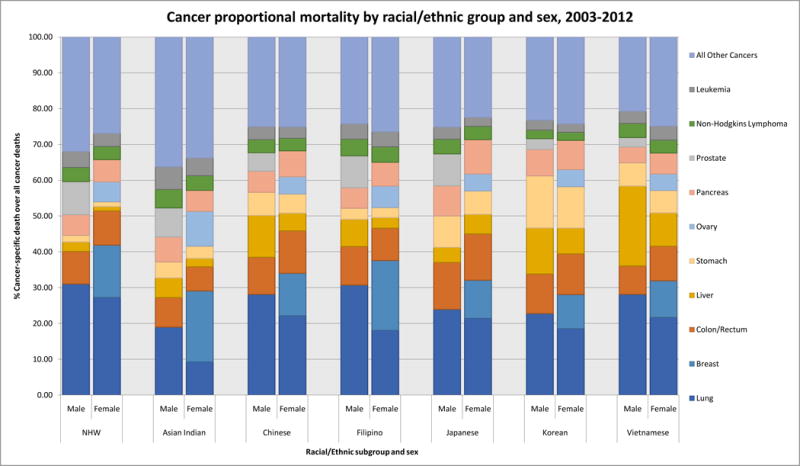
Proportionate cancer mortality by race/ethnicity and sex, 2003–2011
Table 2.
Asian American cancer mortality statistics by cancer type, ranked by (directly) age-adjusted mortality rates
| ALL CANCER SITES | ||||||||||
|---|---|---|---|---|---|---|---|---|---|---|
| Males (2003–2011) | Females (2003–2011) | |||||||||
| Rank | Race/Ethnicity | Count | Age-adjusted rate per 100,000 (95% CI) | Standardized Mortality Ratio (95% CI) | Rank | Race/Ethnicity | Count | Age-adjusted rate per 100,000 (95% CI) | Standardized Mortality Ratio (95% CI) | |
| 1 | NH White | 2144938 | 221.8 (221.5, 222.1) | 1.00 | 1 | NH White | 1971845 | 155.9 (155.7, 156.1) | 1.00 | |
| 2 | Korean | 4592 | 155.2 (150.3, 160.1) | 0.69 (0.67, 0.71) | 2 | Japanese | 8177 | 106.7 (104.3, 109.1) | 0.70 (0.68, 0.71) | |
| 3 | Japanese | 6588 | 145.8 (142.3, 149.4) | 0.67 (0.65, 0.68) | 3 | Korean | 4623 | 101.1 (98.0, 104.1) | 0.63 (0.62, 0.65) | |
| 4 | Chinese | 15124 | 135.9 (133.7, 138.1) | 0.60 (0.59, 0.61) | 4 | Chinese | 12578 | 91.0 (89.4, 92.6) | 0.58 (0.57, 0.59) | |
| 5 | Aggregate Asian | 43879 | 131.7 (130.5, 133.0) | 0.58 (0.58, 0.59) | 5 | Aggregate Asian | 41737 | 90.7 (89.9, 91.6) | 0.57 (0.57, 0.58) | |
| 6 | Filipino | 9526 | 131.6 (128.8, 134.3) | 0.58 (0.57, 0.60) | 6 | Filipino | 10360 | 87.0 (85.2, 88.7) | 0.56 (0.55, 0.57) | |
| 7 | Vietnamese | 4447 | 129.9 (125.6, 134.2) | 0.63 (0.61, 0.64) | 7 | Vietnamese | 2947 | 78.1 (75.1, 81.2) | 0.49 (0.47, 0.51) | |
| 8 | Asian Indian | 3602 | 80.8 (77.6, 84.0) | 0.35 (0.34, 0.36) | 8 | Asian Indian | 3052 | 64.3 (61.7, 66.8) | 0.41 (0.39, 0.42) | |
| STOMACH CANCER | ||||||||||
| Males (2003–2011) | Females (2003–2011) | |||||||||
| Rank | Race/Ethnicity | Count | Age-adjusted rate per 100,000 (95% CI) | Standardized Mortality Ratio (95% CI) | Rank | Race/Ethnicity | Count | Age-adjusted rate per 100,000 (95% CI) | Standardized Mortality Ratio (95% CI) | |
| 1 | Korean | 668 | 21.6 (19.8, 23.4) | 5.42 (5.01, 5.83) | 1 | Korean | 534 | 11.7 (10.6, 12.7) | 5.90 (5.40, 6.40) | |
| 2 | Japanese | 579 | 12.7 (11.7, 13.8) | 3.20 (2.93, 3.46) | 2 | Japanese | 535 | 6.7 (6.1, 7.3) | 3.34 (3.06, 3.63) | |
| 3 | Aggregate Asian | 2970 | 9.0 (8.6, 9.3) | 2.13 (2.06, 2.21) | 3 | Vietnamese | 185 | 5.2 (4.4, 6.0) | 2.51 (2.15, 2.87) | |
| 4 | Chinese | 978 | 8.8 (8.3, 9.4) | 2.11 (1.98, 2.24) | 4 | Aggregate Asian | 2326 | 5.1 (4.9, 5.4) | 2.52 (2.41, 2.62) | |
| 5 | Vietnamese | 288 | 8.5 (7.4, 9.6) | 2.19 (1.94, 2.44) | 5 | Chinese | 676 | 4.9 (4.5, 5.2) | 2.41 (2.23, 2.59) | |
| 6 | Filipino | 296 | 4.2 (3.7, 4.7) | 0.99 (0.88, 1.10) | 6 | Filipino | 292 | 2.5 (2.2, 2.8) | 1.28 (1.13, 1.42) | |
| 7 | NH White | 39151 | 4.1 (4.0, 4.1) | 1.00 | 7 | Asian Indian | 104 | 2.2 (1.7, 2.7) | 1.14 (0.92, 1.36) | |
| 8 | Asian Indian | 161 | 3.2 (2.6, 3.8) | 0.84 (0.71, 0.97) | 8 | NH White | 26449 | 2.0 (2.0, 2.1) | 1.00 | |
| COLORECTAL CANCER | ||||||||||
| Males (2003–2011) | Females (2003–2011) | |||||||||
| Rank | Race/Ethnicity | Count | Age-adjusted rate per 100,000 (95% CI) | Standardized Mortality Ratio (95% CI) | Rank | Race/Ethnicity | Count | Age-adjusted rate per 100,000 (95% CI) | Standardized Mortality Ratio (95% CI) | |
| 1 | NH White | 195021 | 20.3 (20.2, 20.4) | 1.00 | 1 | NH White | 188320 | 14.3 (14.2, 14.3) | 1.00 | |
| 2 | Japanese | 863 | 19.3 (18.0, 20.6) | 0.95 (0.89, 1.01) | 2 | Japanese | 1058 | 13.7 (12.8, 14.6) | 0.93 (0.87, 0.99) | |
| 3 | Korean | 507 | 17.4 (15.8, 19.1) | 0.84 (0.76, 0.91) | 3 | Korean | 525 | 11.9 (10.9, 13.0) | 0.84 (0.77, 0.91) | |
| 4 | Chinese | 1568 | 14.1 (13.4, 14.9) | 0.68 (0.65, 0.72) | 4 | Chinese | 1491 | 10.9 (10.3, 11.5) | 0.76 (0.72, 0.80) | |
| 5 | Filipino | 1027 | 13.8 (12.9, 14.7) | 0.69 (0.65, 0.74) | 5 | Aggregate Asian | 4499 | 10.0 (9.7, 10.3) | 0.70 (0.68, 0.72) | |
| 6 | Aggregate Asian | 4615 | 13.8 (13.4, 14.2) | 0.67 (0.65, 0.69) | 6 | Filipino | 935 | 8.2 (7.7, 8.8) | 0.59 (0.55, 0.62) | |
| 7 | Vietnamese | 353 | 10.0 (8.8, 11.2) | 0.55 (0.49, 0.61) | 7 | Vietnamese | 284 | 7.7 (6.7, 8.7) | 0.56 (0.49, 0.62) | |
| 8 | Asian Indian | 297 | 6.5 (5.6, 7.5) | 0.32 (0.28, 0.35) | 8 | Asian Indian | 206 | 4.5 (3.8, 5.2) | 0.33 (0.29, 0.38) | |
| LIVER CANCER | ||||||||||
| Males (2003–2011) | Females (2003–2011) | |||||||||
| Rank | Race/Ethnicity | Count | Age-adjusted rate per 100,000 (95% CI) | Standardized Mortality Ratio (95% CI) | Rank | Race/Ethnicity | Count | Age-adjusted rate per 100,000 (95% CI) | Standardized Mortality Ratio (95% CI) | |
| 1 | Vietnamese | 992 | 26.2 (24.4, 28.0) | 4.76 (4.46, 5.05) | 1 | Vietnamese | 274 | 8.3 (7.3, 9.4) | 4.06 (3.58, 4.54) | |
| 2 | Korean | 590 | 18.2 (16.6, 19.8) | 3.09 (2.84, 3.34) | 2 | Korean | 333 | 7.8 (6.9, 8.7) | 4.03 (3.60, 4.46) | |
| 3 | Chinese | 1762 | 14.5 (13.8, 15.2) | 2.55 (2.43, 2.67) | 3 | Japanese | 444 | 5.6 (5.1, 6.1) | 3.15 (2.85, 3.44) | |
| 4 | Aggregate Asian | 4539 | 12.2 (11.9, 12.6) | 2.15 (2.09, 2.22) | 4 | Chinese | 621 | 4.7 (4.3, 5.0) | 2.47 (2.27, 2.66) | |
| 5 | Filipino | 721 | 8.8 (8.2, 9.5) | 1.57 (1.45, 1.68) | 5 | Aggregate Asian | 2046 | 4.7 (4.5, 4.9) | 2.45 (2.34, 2.55) | |
| 6 | Japanese | 277 | 6.2 (5.5, 7.0) | 1.13 (1.00, 1.26) | 6 | Filipino | 303 | 2.7 (2.4, 3.1) | 1.44 (1.28, 1.61) | |
| 7 | NH White | 56773 | 5.6 (5.5, 5.6) | 1.00 | 7 | NH White | 23393 | 1.8 (1.8, 1.9) | 1.00 | |
| 8 | Asian Indian | 197 | 4.1 (3.4, 4.8) | 0.63 (0.55, 0.72) | 8 | Asian Indian | 71 | 1.6 (1.2, 2.0) | 0.86 (0.66, 1.06) | |
| PANCREATIC CANCER | ||||||||||
| Males (2003–2011) | Females (2003–2011) | |||||||||
| Rank | Race/Ethnicity | Count | Age-adjusted rate per 100,000 (95% CI) | Standardized Mortality Ratio (95% CI) | Rank | Race/Ethnicity | Count | Age-adjusted rate per 100,000 (95% CI) | Standardized Mortality Ratio (95% CI) | |
| 1 | NH White | 124173 | 12.6 (12.5, 12.7) | 1.00 | 1 | Japanese | 784 | 9.8 (9.1, 10.5) | 1.05 (0.98, 1.13) | |
| 2 | Japanese | 554 | 12.2 (11.2, 13.2) | 0.99 (0.91, 1.07) | 2 | NH White | 122410 | 9.4 (9.4, 9.5) | 1.00 | |
| 3 | Korean | 339 | 11.0 (9.7, 12.3) | 0.86 (0.77, 0.95) | 3 | Korean | 378 | 8.5 (7.6, 9.4) | 0.89 (0.80, 0.98) | |
| 4 | Aggregate Asian | 2779 | 8.4 (8.0, 8.7) | 0.63 (0.61, 0.65) | 4 | Aggregate Asian | 3115 | 7.0 (6.8, 7.3) | 0.72 (0.70, 0.75) | |
| 5 | Chinese | 893 | 8.1 (7.5, 8.6) | 0.61 (0.57, 0.65) | 5 | Chinese | 910 | 6.8 (6.4, 7.3) | 0.70 (0.66, 0.75) | |
| 6 | Filipino | 545 | 7.4 (6.8, 8.1) | 0.57 (0.52, 0.62) | 6 | Filipino | 692 | 6.2 (5.7, 6.7) | 0.64 (0.59, 0.69) | |
| 7 | Vietnamese | 197 | 6.3 (5.3, 7.3) | 0.47 (0.40, 0.53) | 7 | Vietnamese | 172 | 4.9 (4.1, 5.7) | 0.50 (0.43, 0.58) | |
| 8 | Asian Indian | 251 | 5.8 (4.9, 6.7) | 0.41 (0.36, 0.46) | 8 | Asian Indian | 179 | 4.1 (3.5, 4.8) | 0.43 (0.37, 0.50) | |
| Lung cancers | ||||||||||
| Males (2003–2011) | Females (2003–2011) | |||||||||
| Rank | Race/Ethnicity | Count | Age-adjusted rate per 100,000 (95% CI) | Standardized Mortality Ratio (95% CI) | Rank | Race/Ethnicity | Count | Age-adjusted rate per 100,000 (95% CI) | Standardized Mortality Ratio (95% CI) | |
| 1 | NH White | 665259 | 67.4 (67.3, 67.6) | 1.00 | 1 | NH White | 537826 | 42.9 (42.8, 43.0) | 1.00 | |
| 2 | Filipino | 2926 | 39.9 (38.4, 41.4) | 0.57 (0.55, 0.59) | 2 | Japanese | 1752 | 22.2 (21.1, 23.2) | 0.54 (0.52, 0.57) | |
| 3 | Chinese | 4255 | 38.8 (37.6, 40.0) | 0.55 (0.53, 0.56) | 3 | Chinese | 2786 | 20.5 (19.8, 21.3) | 0.47 (0.45, 0.48) | |
| 4 | Korean | 1046 | 37.7 (35.2, 40.2) | 0.50 (0.47, 0.53) | 4 | Korean | 857 | 19.3 (17.9, 20.6) | 0.42 (0.39, 0.45) | |
| 5 | Vietnamese | 1251 | 37.6 (35.2, 39.9) | 0.56 (0.53, 0.59) | 5 | Aggregate Asian | 8188 | 18.2 (17.8, 18.6) | 0.41 (0.40, 0.42) | |
| 6 | Aggregate Asian | 11739 | 35.7 (35.0, 36.4) | 0.50 (0.49, 0.51) | 6 | Vietnamese | 639 | 17.0 (15.6, 18.5) | 0.39 (0.36, 0.42) | |
| 7 | Japanese | 1577 | 35.2 (33.5, 37.0) | 0.53 (0.51, 0.56) | 7 | Filipino | 1871 | 16.1 (15.3, 16.8) | 0.36 (0.35, 0.38) | |
| 8 | Asian Indian | 684 | 15.7 (14.3, 17.1) | 0.21 (0.20, 0.23) | 8 | Asian Indian | 283 | 6.7 (5.8, 7.5) | 0.14 (0.12, 0.16) | |
| BREAST CANCER | OVARIAN CANCER | |||||||||
| 2003–2011 | 2003–2011 | |||||||||
| Rank | Race/Ethnicity | Count | Age-adjusted rate per 100,000 (95% CI) | Standardized Mortality Ratio (95% CI) | Rank | Race/Ethnicity | Count | Age-adjusted rate per 100,000 (95% CI) | Standardized Mortality Ratio (95% CI) | |
| 1 | NH White | 288068 | 23.3 (23.2, 23.4) | 1.00 | 1 | NH White | 109900 | 8.8 (8.8, 8.9) | 1.0 | |
| 2 | Filipino | 2023 | 15.2 (14.5, 15.9) | 0.70 (0.67, 0.73) | 2 | Asian Indian | 297 | 5.8 (5.1, 6.6) | 0.50 (0.41, 0.59) | |
| 3 | Japanese | 872 | 12.7 (11.8, 13.6) | 0.53 (0.49, 0.56) | 3 | Japanese | 388 | 5.5 (4.9, 6.0) | 0.50 (0.41, 0.59) | |
| 4 | Aggregate Asian | 5736 | 11.5 (11.2, 11.8) | 0.51 (0.49, 0.52) | 4 | Filipino | 621 | 4.9 (4.5, 5.3) | 0.49 (0.43, 0.55) | |
| 5 | Asian Indian | 605 | 11.1 (10.1, 12.1) | 0.49 (0.45, 0.53) | 5 | Aggregate Asian | 2266 | 4.7 (4.5, 4.9) | 0.44 (0.41, 0.47) | |
| 6 | Chinese | 1493 | 9.9 (9.4, 10.4) | 0.44 (0.42, 0.46) | 6 | Korean | 220 | 4.4 (3.8, 5.0) | 0.40 (0.31, 0.49) | |
| 7 | Korean | 441 | 8.1 (7.4, 8.9) | 0.38 (0.35, 0.42) | 7 | Chinese | 604 | 4.2 (3.8, 4.5) | 0.39 (0.34, 0.44) | |
| 8 | Vietnamese | 302 | 6.6 (5.8, 7.4) | 0.31 (0.27, 0.34) | 8 | Vietnamese | 136 | 3.1 (2.6, 3.7) | 0.32 (0.24, 0.40) | |
| PROSTATE CANCER | ||||||||||
| 2003–2011 | ||||||||||
| Rank | Race/Ethnicity | Count | Age-adjusted rate per 100,000 (95% CI) | Standardized Mortality Ratio (95% CI) | ||||||
| 1 | NH White | 198182 | 22.1 (22.0, 22.2) | 1.00 | ||||||
| 2 | Filipino | 849 | 14.6 (13.5, 15.6) | 0.65 (0.61, 0.69) | ||||||
| 3 | Japanese | 587 | 12.0 (11.0, 13.0) | 0.56 (0.51, 0.60) | ||||||
| 4 | Asian Indian | 293 | 10.3 (8.9, 11.6) | 0.44 (0.39, 0.49) | ||||||
| 5 | Aggregate Asian | 2765 | 10.1 (9.7, 10.5) | 0.44 (0.43, 0.46) | ||||||
| 6 | Chinese | 781 | 8.2 (7.6, 8.7) | 0.36 (0.33, 0.38) | ||||||
| 7 | Korean | 138 | 6.5 (5.4, 7.7) | 0.27 (0.23, 0.32) | ||||||
| 8 | Vietnamese | 117 | 5.1 (4.1, 6.1) | 0.23 (0.19, 0.27) | ||||||
| NON-HODGKINS LYMPHOMA | ||||||||||
| Males (2003–2011) | Females (2003–2011) | |||||||||
| Rank | Race/Ethnicity | Count | Age-adjusted rate per 100,000 (95% CI) | Standardized Mortality Ratio (95% CI) | Rank | Race/Ethnicity | Count | Age-adjusted rate per 100,000 (95% CI) | Standardized Mortality Ratio (95% CI) | |
| 1 | NH White | 84690 | 8.9 (8.9, 9.0) | 1.00 | 1 | NH White | 72715 | 5.5 (5.5, 5.6) | 1.00 | |
| 2 | Filipino | 444 | 6.4 (5.8, 7.0) | 0.70 (0.63, 0.76) | 2 | Filipino | 446 | 4.0 (3.6, 4.4) | 0.74 (0.67, 0.81) | |
| 3 | Japanese | 270 | 5.9 (5.2, 6.6) | 0.68 (0.60, 0.76) | 3 | Japanese | 306 | 3.7 (3.3, 4.2) | 0.68 (0.60, 0.76) | |
| 4 | Aggregate Asian | 1736 | 5.3 (5.1, 5.6) | 0.59 (0.56, 0.61) | 4 | Aggregate Asian | 1534 | 3.5 (3.3, 3.6) | 0.62 (0.59, 0.66) | |
| 5 | Vietnamese | 175 | 5.1 (4.3, 6.0) | 0.64 (0.54, 0.73) | 5 | Chinese | 445 | 3.3 (3.0, 3.7) | 0.60 (0.54, 0.65) | |
| 6 | Chinese | 552 | 5.0 (4.6, 5.5) | 0.55 (0.51, 0.60) | 6 | Asian Indian | 125 | 3.1 (2.5, 3.7) | 0.54 (0.45, 0.64) | |
| 7 | Asian Indian | 185 | 4.4 (3.6, 5.2) | 0.46 (0.40, 0.53) | 7 | Vietnamese | 107 | 2.9 (2.4, 3.5) | 0.56 (0.46, 0.67) | |
| 8 | Korean | 110 | 3.6 (2.9, 4.4) | 0.42 (0.34, 0.50) | 8 | Korean | 105 | 2.4 (1.9, 2.9) | 0.44 (0.36, 0.53) | |
| LEUKEMIA | ||||||||||
| Males (2003–2011) | Females (2003–2011) | |||||||||
| Rank | Race/Ethnicity | Count | Age-adjusted rate per 100,000 (95% CI) | Standardized Mortality Ratio (95% CI) | Rank | Race/Ethnicity | Count | Age-adjusted rate per 100,000 (95% CI) | Standardized Mortality Ratio (95% CI) | |
| 1 | NH White | 95118 | 10.1 (10.1, 10.2) | 1.00 | 1 | NH White | 71484 | 5.6 (5.6, 5.7) | 1.00 | |
| 2 | Filipino | 409 | 5.6 (5.1, 6.2) | 0.57 (0.52, 0.63) | 2 | Filipino | 434 | 3.8 (3.5, 4.2) | 0.70 (0.64, 0.77) | |
| 3 | Japanese | 223 | 5.1 (4.4, 5.8) | 0.50 (0.43, 0.56) | 3 | Asian Indian | 150 | 3.1 (2.5, 3.7) | 0.58 (0.48, 0.67) | |
| 4 | Aggregate Asian | 1683 | 5.0 (4.7, 5.2) | 0.50 (0.48, 0.53) | 4 | Aggregate Asian | 1403 | 3.1 (2.9, 3.2) | 0.56 (0.53, 0.59) | |
| 5 | Chinese | 547 | 4.9 (4.5, 5.4) | 0.49 (0.45, 0.53) | 5 | Chinese | 397 | 2.9 (2.6, 3.2) | 0.52 (0.47, 0.57) | |
| 6 | Vietnamese | 150 | 4.8 (3.9, 5.6) | 0.48 (0.40, 0.56) | 6 | Vietnamese | 114 | 2.9 (2.3, 3.4) | 0.56 (0.46, 0.66) | |
| 7 | Asian Indian | 228 | 4.4 (3.7, 5.1) | 0.50 (0.43, 0.56) | 7 | Japanese | 201 | 2.7 (2.3, 3.1) | 0.47 (0.40, 0.53) | |
| 8 | Korean | 126 | 3.9 (3.2, 4.7) | 0.43 (0.35, 0.50) | 8 | Korean | 107 | 2.2 (1.8, 2.7) | 0.43 (0.35, 0.52) | |
Figure 2.

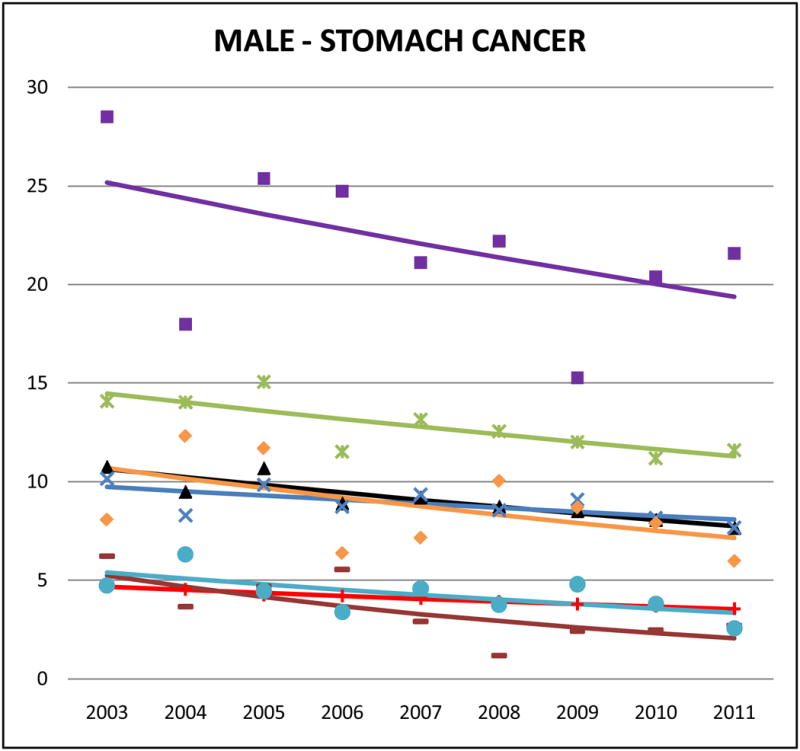
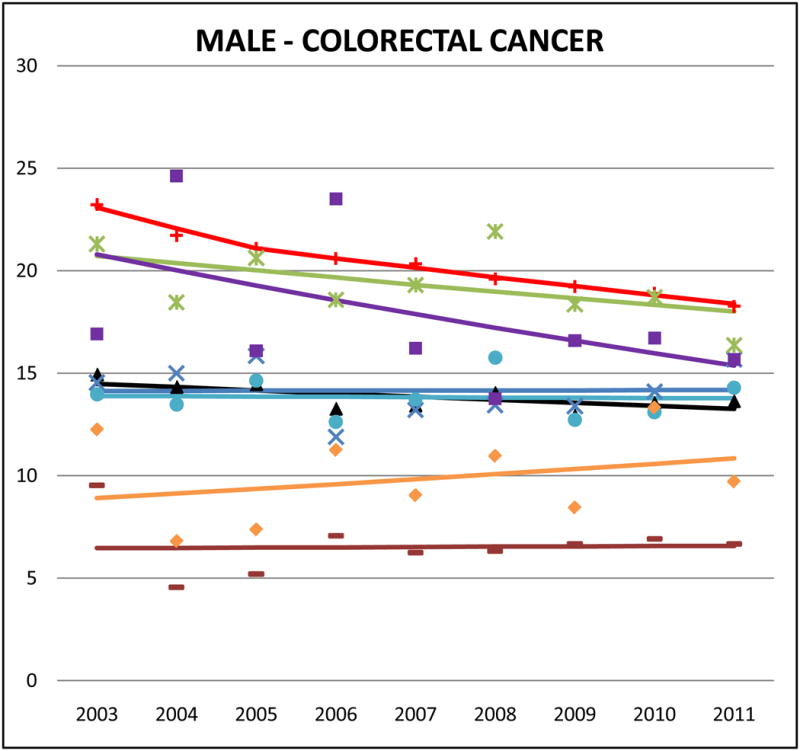
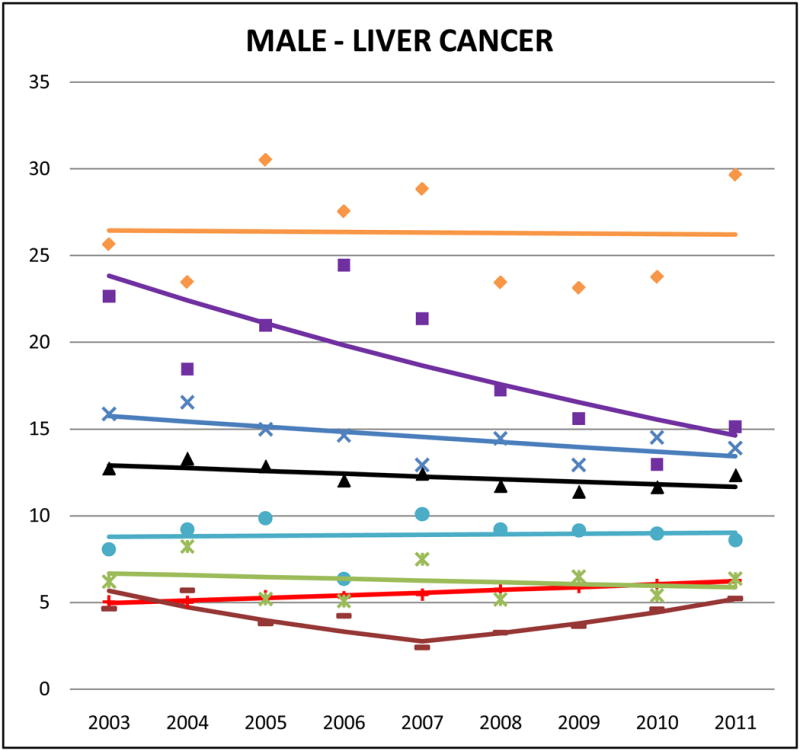
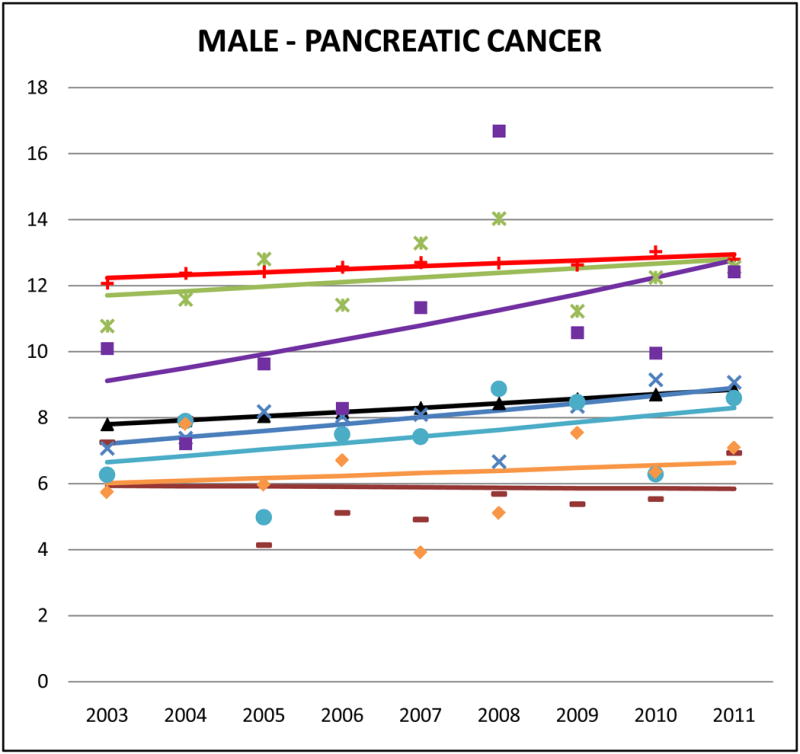
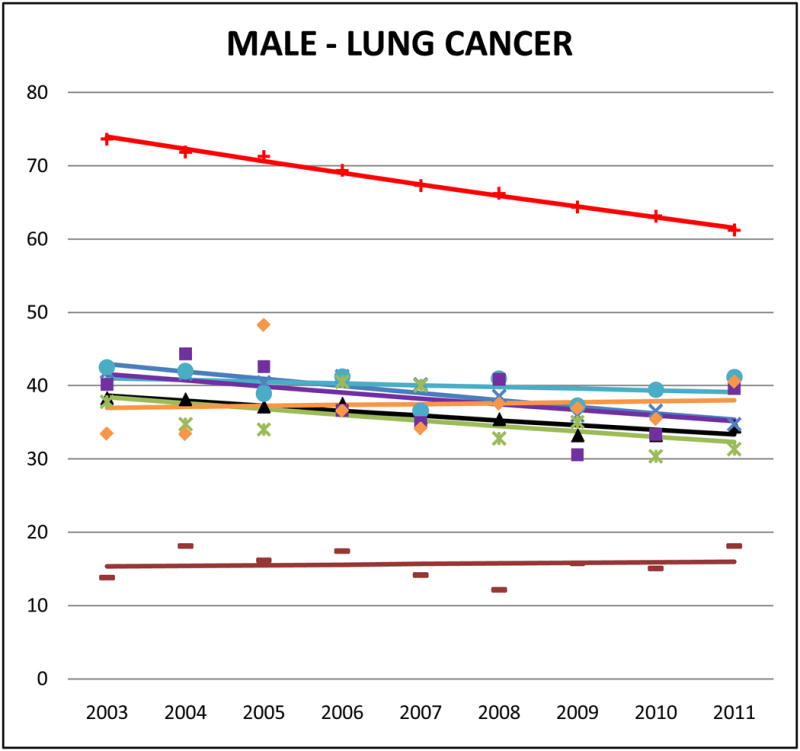
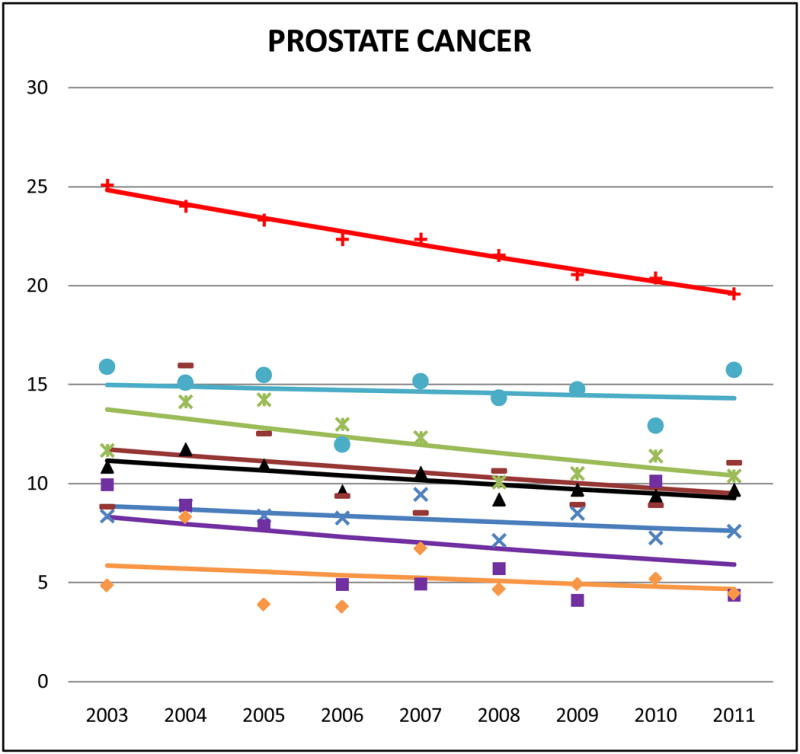
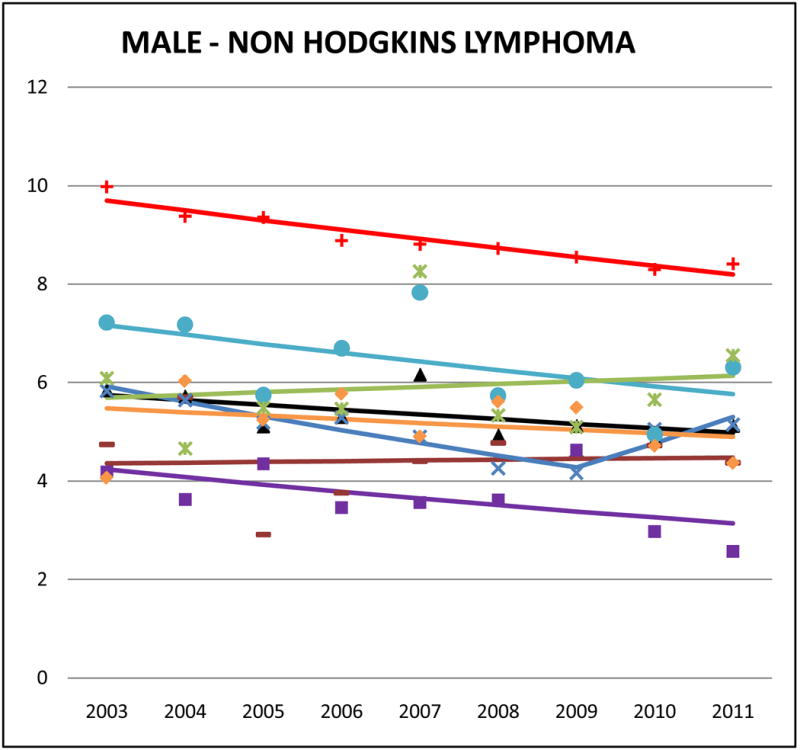
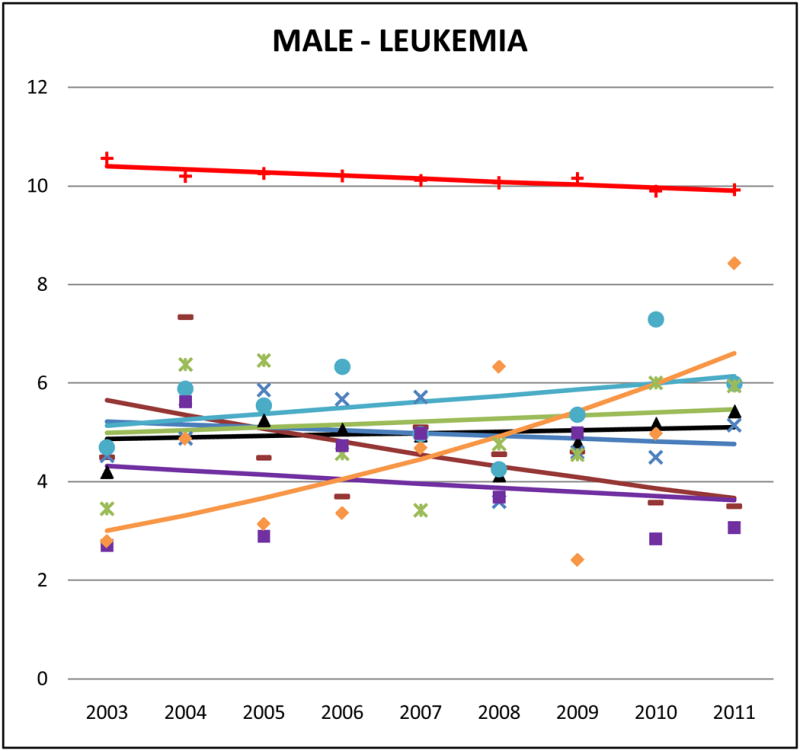
Cancer mortality trends (men, 2003–2011)
Figure 3.

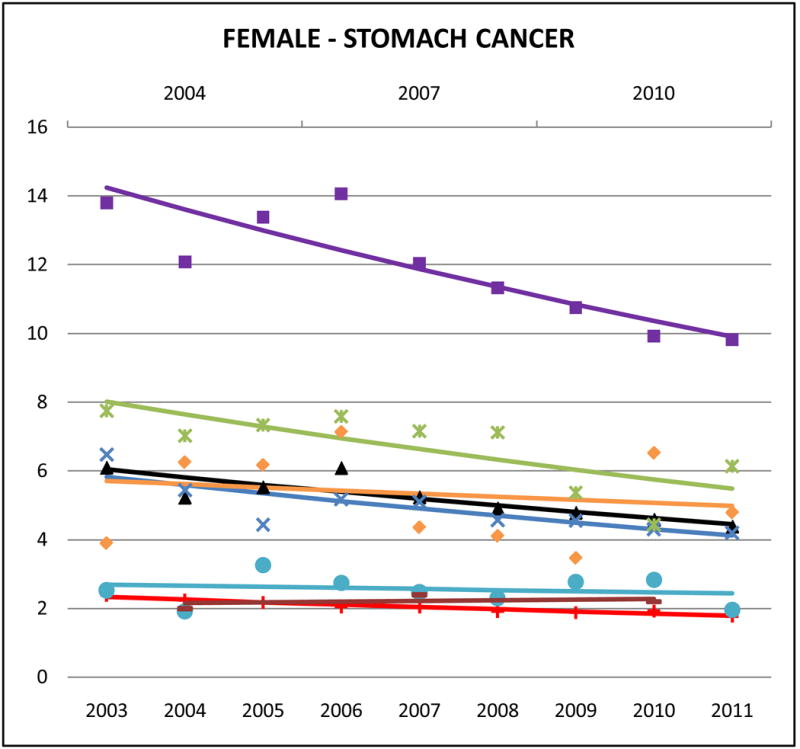
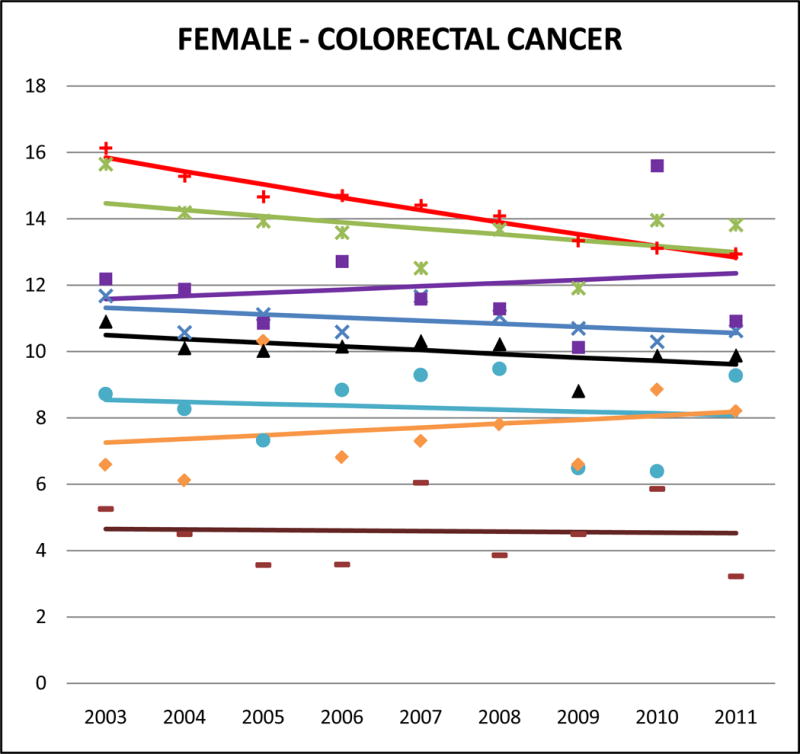
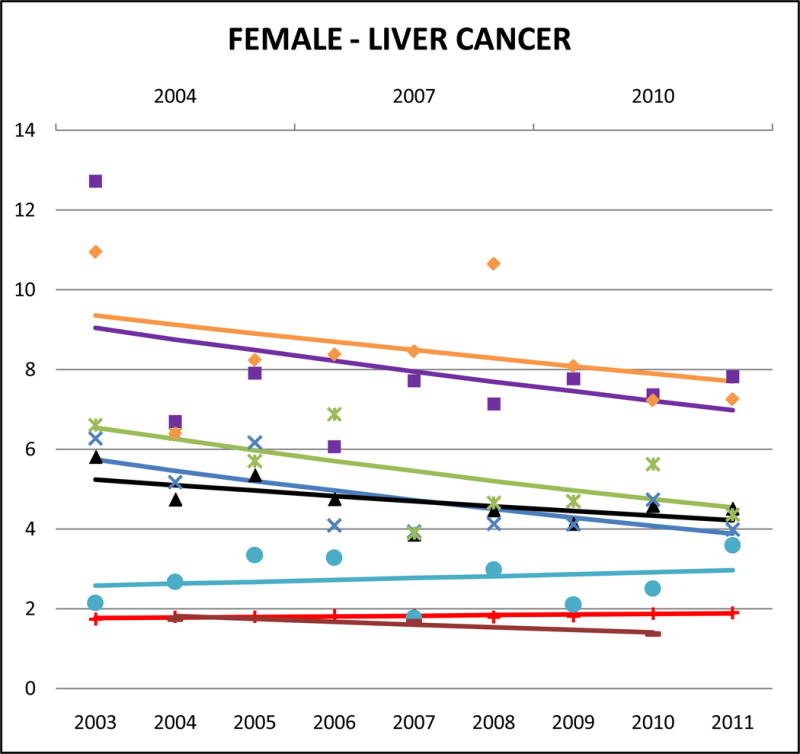

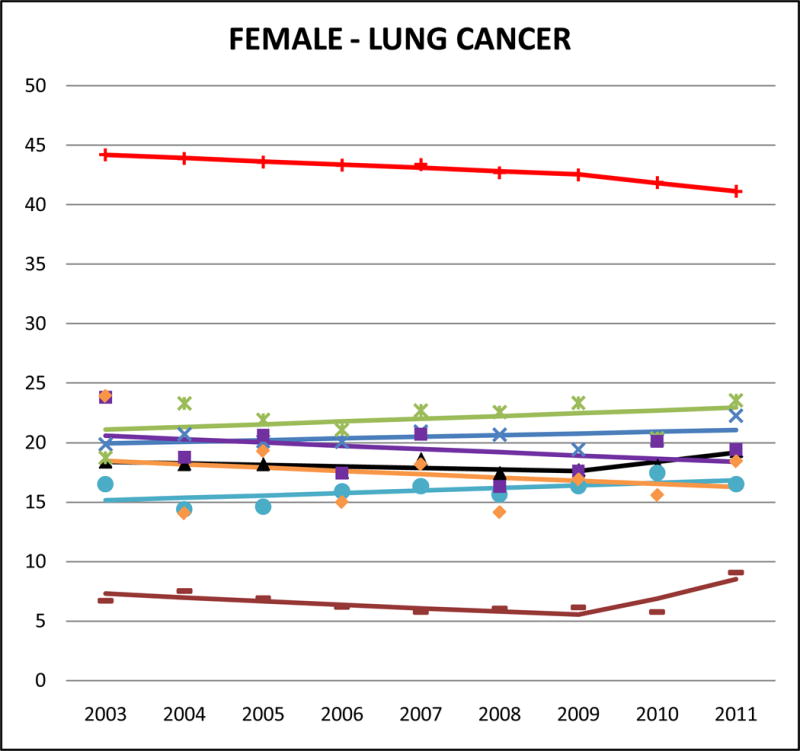
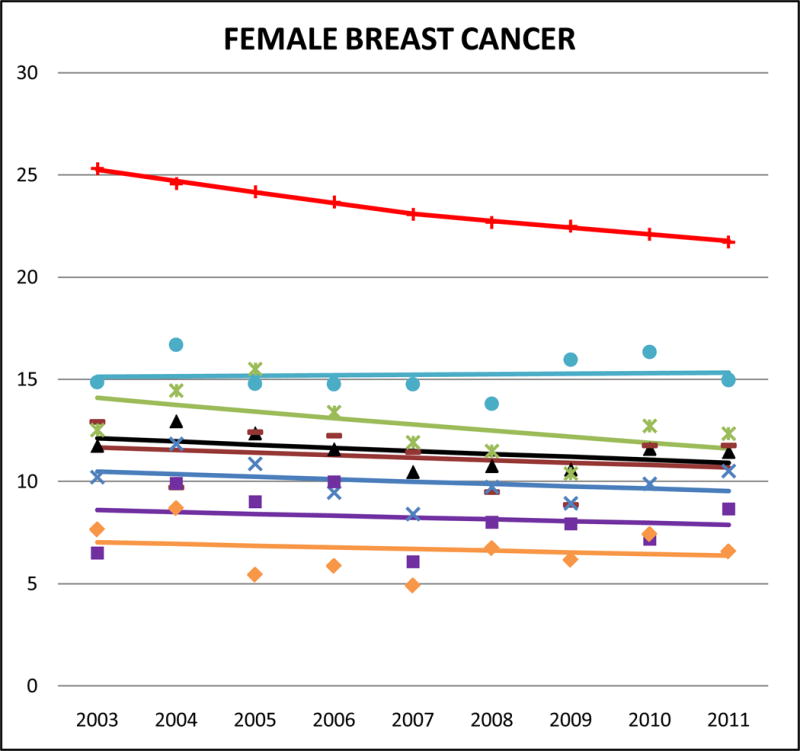
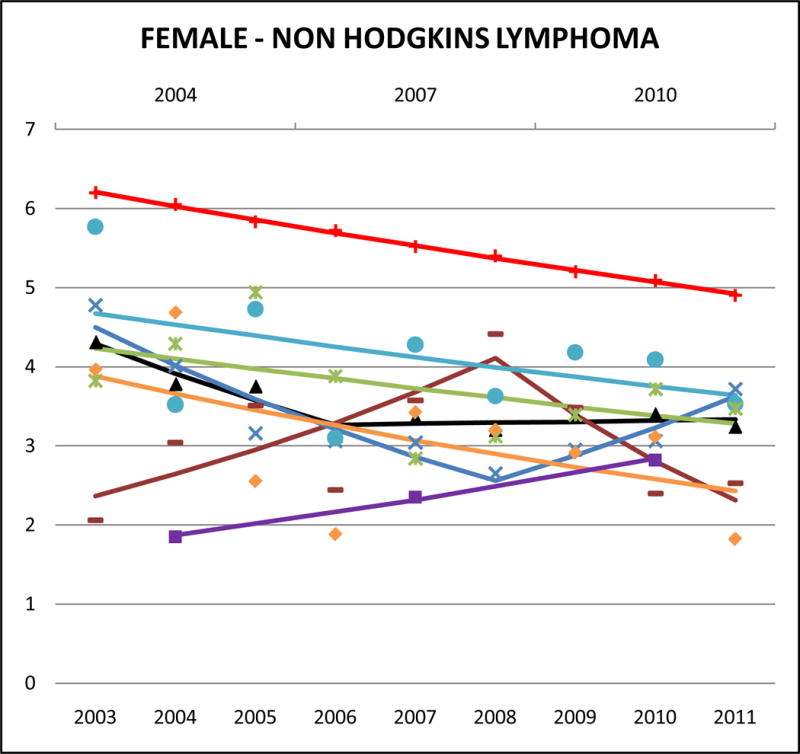

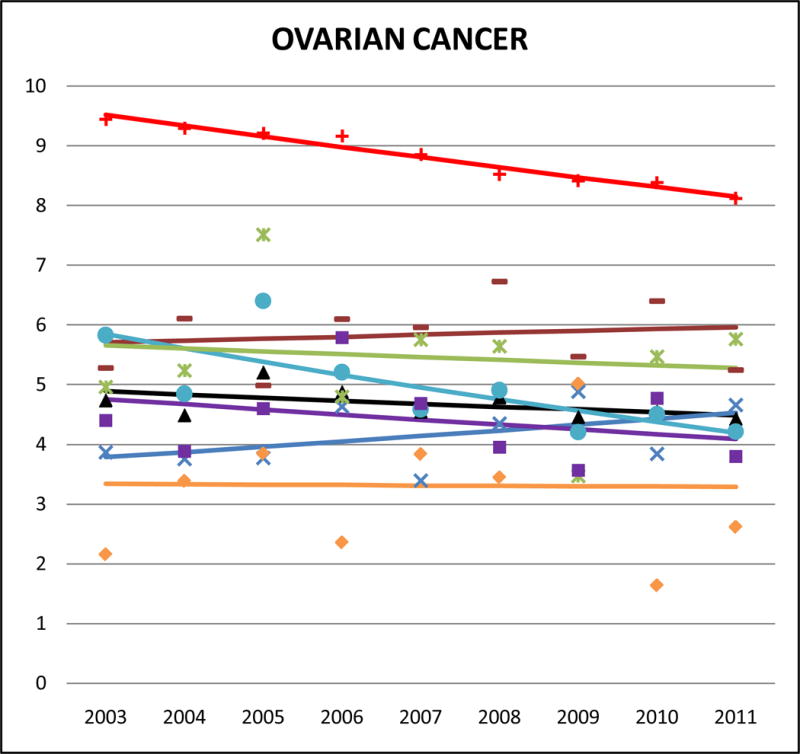
Cancer mortality trends (women, 2003–2011)
Cancers of the digestive system
Stomach cancer accounted for approximately 10–15% of Korean and 5–10% of Chinese, Japanese and Vietnamese cancer deaths but <2% of NHW cancer deaths. Compared to NHWs, AA mortality rates were high, especially for Koreans (male SMR: 5.42, 95% CI 5.01 to 5.83; female SMR: 5.90, 95% CI 5.40 to 6.40) and Japanese (male SMR: 3.20, 95% CI 2.93 to 3.46; female SMR: 3.34, 95% CI 3.06 to 3.63). Asian Indians had the lowest rates (male SMR: 0.84, 95% CI 0.71 to 0.97; female SMR: 1.14, 95% CI 0.92 to 1.36). Stomach cancer mortality rates decreased in AA populations, with significant trends for Japanese males (APC: −3.1, 95% CI −5.1 to −1), Chinese males (APC: −2.3, 95% CI −4.4 to −0.2), Korean females (APC: −4.4, 95% CI −6.5 to −2.4), Japanese females (APC: −4.6, 95% CI −8.3 to 0.8), and Chinese females (APC: −4.2, 95% CI −6.5 to −1.9). Complete APC statistics are provided in Supplementary Tables 3 and 4.
Liver cancer accounted for 22% of Vietnamese male, 12% of Chinese male, and 10% of Vietnamese female cancer deaths, and it ranked in the top 5 sites of cancer-related death for Korean males and females, and Filipino males. Among NHWs, the corresponding percentages are <2.5% (data not shown). In both males and females, the highest AA liver cancer mortality rates were for Vietnamese (male SMR: 4.76, 95% CI 4.46 to 5.06; female SMR: 4.06, 95% CI 3.58 to 4.54) and Koreans (male SMR: 3.09, 95% CI 2.84 to 3.34; female SMR: 4.03, 95% CI 3.60 to 4.46). Asian Indians had the lowest rates of liver cancer mortality among all study decedents (AA or NHW) (male SMR: 0.63, 95% CI 0.55 to 0.72; female SMR: 0.86, 95% CI 0.66 to 1.06). Trends indicate that AA liver cancer mortality rates were generally decreasing, and significant for Korean males (APC: −5.9, 95% CI −10.1 to −1.6), Chinese females (APC: −4.8, 95% CI −8.7 to −0.7), and Japanese females (APC: −4.5, 95% CI −8.8 to 0).
Colorectal cancer accounted for about 10% of NHW cancer deaths, 9–11% of most AA cancer deaths, and 13% for Japanese. Adjusted rates of mortality from colorectal cancer were slightly lower for AAs than for NHW but the differences were not as large as those detected in other cancers. Japanese males and females had the highest rates of colorectal cancer among AAs (male SMR: 0.95, 95% CI 0.89 to 1.01; female SMR: 0.93, 95% CI 0.87 to 0.99) followed by Koreans (male SMR: 0.84, 95% CI 0.76 to 0.91; female SMR: 0.84, 95% CI 0.77 to 0.91). Asian Indians had the lowest rates of colorectal cancer mortality (male SMR: 0.32, 95% CI 0.28 to 0.35; female SMR: 0.33, 95% CI 0.29 to 0.38). Colorectal cancer mortality trends in NHWs were declining in both men and women, but no statistically significant decreases were identified in any AA ethnic group.
Pancreatic cancer mortality rates were highest for Japanese and Koreans. Death rates from pancreatic cancer among Japanese were similar to NHWs (male SMR: 0.99, 95% CI 0.91 to 1.07; female SMR: 1.07, 95% CI 0.98 to 1.13). Trends for Japanese pancreatic cancer mortality (males and females) were stable or slightly decreasing. Male Korean pancreatic cancer mortality increased (APC: 4.3, 95% CI −3.3 to 12.4), and pancreatic cancer mortality rates in Chinese (APC: 3.3, 95% CI −0.5 to 7.2) also appeared to rise.
Lung cancer
Lung cancer was the leading cause of cancer-related mortality among males for all AA ethnicities, and for Chinese, Japanese, and Vietnamese women. For Filipino (AMR: 39.9, 95% CI 38.4 to 41.4) and Chinese (AMR: 38.8, 95% CI 37.6 to 40.0) men, lung cancer accounted for approximately 30% of all cancer-related deaths. However, compared to NHWs the mortality burden for male lung cancer in most AA ethnicities is about half and in females it was one-half to one-third. Asian Indians of both sexes had markedly lower lung cancer mortality rates than NHWs (SMR males: 0.21, 95% CI 0.20 to 0.23; SMR females: 0.14, 95% CI 0.12 to 0.16) and all other AA ethnicities. In trend analyses, male lung cancer was either stable or declining in all AA groups. However lung cancer in females did not reflect the same declining patterns; we identified non-significant positive APCs for Chinese, Filipina and Japanese women.
Female breast and ovarian cancers
Compared to other AA ethnicities, Filipinas had the highest rates of breast cancer mortality, but their mortality rates are still lower than those of NHWs (SMR: 0.7, 95% CI 0.67 to 0.73). Notably though, breast cancer deaths accounted for 19.5% of all Filipina cancer deaths, relative to 14.6% in NHW women. Most of the other AA subgroups died from breast cancer at about 50% the rate of NHWs, including Asian Indians (SMR: 0.49, 95% CI 0.45 to 0.53). In Asian Indians however, breast cancer was the leading cause of female cancer death, accounting for 19.8% of all cancer deaths. The lowest female breast cancer mortality rates were in Vietnamese (SMR 0.31, 95% CI 0.27 to 0.34). Death from female breast cancer was decreasing in NHW women, but we did not identify any statistically significant decreasing trends among AAs.
The rate of ovarian cancer mortality in NHW women was 8.8 (AMR), 95% CI 8.8 to 8.9. All AA groups died at half that rate or less. Asian Indians and Japanese had the highest ovarian mortality rates (SMR 0.50, 95% CI 0.41 to 0.59) while Vietnamese had the lowest (SMR 0.32, 95% CI 0.24 to 0.40). Notably, ovarian cancer death accounted for 10% of female Asian Indian cancer mortality; this is about twice the proportion in NHW women.
Prostate cancer
In NHW males, prostate cancer was the second leading cause of death, behind lung cancer. In most of the AA ethnicities it was ranked third. Aggregate Asian rates of prostate cancer mortality were lower than NHWs, but the proportion of total cancer-related deaths were similar between NHWs and AAs (8–9%). Filipino men had the highest rates of prostate cancer mortality (SMR: 0.65, 95% CI 0.61 to 0.69) while Vietnamese men had the lowest (SMR: 0.23, 95% CI 0.19 to 0.27). We detected slightly downward sloping trends in all AA ethnicities for prostate cancer mortality.
Lymphoma and Leukemias
Relative to NHWs, AAs aggregated had lower NHL mortality rates (aggregate Asian male SMR: 0.59, 95% CI 0.65 to 0.61; aggregate Asian female SMR: 0.62, 95% CI 0.59 to 0.66). Among AAs, Filipinos had the highest rates of NHL mortality (male AMR: 6.4, 95% CI 5.8 to 7.0; female AMR: 4.0, 95% CI 3.6 to 4.4) while Koreans had the lowest (male AMR: 3.6, 95% CI 2.9 to 4.4; female AMR: 2.4, 95% CI 1.9 to 2.9).
Like many other cancers that rank higher in NHW mortality, leukemia death rates were low in AA men and women and the rates were generally homogenous across ethnicities (aggregate Asian SMR male: 0.50, 95% CI 0.48 to 0.53; aggregate Asian female SMR: 0.56, 95% CI 0.53 to 0.59). In Asian Indian men, leukemia ranked 5th in the leading cause of cancer-related mortality, and accounted for 6% of all cancer deaths. Trend analysis revealed significant decreasing rates in NHWs (male APC: −0.6, 95% CI −0.9 to −0.3; female APC: −0.8, 95% CI −1.1 to −0.5) and Asian Indian males (APC: −5.3, 95% CI −10.3 to 0.1).
DISCUSSION
Our study is the first to provide a comprehensive report of the contemporary mortality burden across 10 major cancer sites for the six largest AA ethnic populations. Prior to this work, the only cancer mortality data for AA populations were reported in Miller et al. based on data from 1998–2002 from seven U.S. states (18). Consistent with these earlier patterns, we found that, for most cancer sites, AAs as an aggregated group have lower mortality burden than NHWs, with overall cancer mortality rates one-half to one-third those of NHWs. As the first to examine mortality trends among AA ethnic groups, we found that rates in overall cancer mortality are decreasing in both male and female AAs when data are aggregated across all ethnic groups. However, patterns of cancer-related mortality are heterogeneous across AA ethnicities, highlighting the need for disaggregation in reporting. Stomach and liver cancer mortality burden, specifically, is very high for AAs, particularly among Chinese, Koreans, and Vietnamese, for whom these two cancer types combined accounted for 15–25% of cancer deaths, but less than 5% of cancer deaths in NHWs. Among women, breast cancer was also especially burdensome for Filipinas and Asian Indians, and AA lung cancer rates were not declining, and even increasing in some AA females in recent years, despite the introduction and uptake of nationwide anti-smoking legislation.
Cancer mortality is a function of the incidence rate in the population of interest as well as survival after diagnosis. Heterogeneity in cancer incidence is multi-faceted and site-specific attributable risk factors are often higher in one group than another. Survival may vary between racial and ethnic groups as well; survival is impacted by early detection and treatment, both of which are related to access to healthcare and socio-economic status. In line with our findings, Gomez et al. (9) used SEER data to show that between 2004 and 2008, liver cancer was in the top 5 most diagnosed cancers among Americans of Chinese, Koreans, and Vietnamese descent (both sexes) and in Japanese American men, and that from 1990 to 2008, trends of liver cancer incidence are increasing in Filipino and Vietnamese American men. They also reported that stomach cancer was among the 5 most diagnosed cancers in Japanese American men and women, and in Korean American men, with increasing trends apparent for Japanese American men. For women, their analysis indicated that breast cancer is the most commonly diagnosed cancer among all Asian American ethnicities, with incidence rates increasing for Asian Indians, Chinese, Filipina, Korean, and Vietnamese women. Trinh et al. (10) also analyzed SEER case data, from 1990 to 2008, and found that rates of cause-specific mortality among eight Asian American ethnicities were consistently lower than NHW patients for lung, breast, prostate and colorectal cancers, but their study did not include survival from infection-related cancers. Between-ethnicity heterogeneity in cancer statistics may reflect some genetic variation, however, prior studies comparing cancer incidence rates between US- and foreign-born Asian Americans, as well as between Asians in Asia with Asian Americans support the idea that lifestyle and environmental factors generally have larger impacts on cancer burden than population genetics (19–22). Reflecting cancer burden as multifactorial public health concern, the following paragraphs include discussion of etiology and prevention strategies that are relevant to the AA populations.
The higher rates of gastric cancer mortality we observed in Koreans and Japanese may warrant consideration of heightened screening efforts in these groups. Population-based gastric cancer screening programs using radiographic or endoscopic techniques are established in Japan and South Korea, where gastric cancer incidence is very high (23, 24). The effectiveness of these programs is debated, but reductions in gastric cancer mortality have been achieved in Asian countries nonetheless, primarily attributable to efforts to treat infections with Helicobacter pylori (H. pylori), one of the most important causal factors in gastric carcinogenesis. H. pylori infection has been classified as by IARC as a group 1 carcinogen (25), and their 2014 report recommended eradication of H. pylori as the best primary preventive measure for gastric cancer (26). More recent screening efforts in China and Taiwan, have focused on early age detection and treatment of H. pylori infections. Results from an initial 15-year trial in China demonstrated significant reduction of gastric cancer in asymptomatic subjects, and a larger nationwide trial is underway (27). According to the National Cancer Institute’s recommendations, there is no evidence that gastric cancer screening would result in a decrease in mortality in areas with relatively low incidence of the disease (28). However, given the high mortality burden of gastric cancer in some AA populations, the recommendations from IARC and successes demonstrated in Asian countries may warrant further evaluation of ethnicity-specific screening guidelines.
The higher rates of liver cancer we observed in Vietnamese and Korean populations offer an important opportunity to enhance screening efforts for hepatitis B and C in high risk communities. While AAs make up 5.8% of the US population, they represent more than half of the 1.4 million Americans infected with chronic hepatitis B (CHB), an important predisposing factor for hepatocellular carcinoma, the most common cancer of the liver (29). CHB prevalence rates for AAs vary by ethnicity: as high as 12–13% in Chinese and Vietnamese, 5–7% in Koreans and Filipinos (30), however less than 50% of at-risk AAs know their HBV status. CHB prevention has been successful in younger AAs via childhood vaccination initiatives, but AA adults, especially those in underserved communities, remain a high priority for screening. Hepatitis C screening is not routinely recommended for Asian immigrants in the US (31), but should be considered since treatment with a highly curative therapy is now available. Having dis-aggregated data by ethnicity allows for more precise targeted screening and control efforts that employ culture-specific approaches (32).
We also observed noteworthy trends and burden for female lung and breast cancers. Smoking, a major health concern for many Americans, is associated with approximately 75% of lung cancer diagnoses, however, an estimated 70% of female AA lung cancers occur in never smokers (33). Patterns in histologic subtypes may provide evidence of smoking status in population-level statistics, as squamous cell carcinoma (SCC) is more commonly associated with tobacco use than adenocarcinoma (34, 35). Cheng et al. (36) examined 20-year incidence rates of AA female lung cancer and found marked differences in histology by ethnicity, with increasing trends of SCC in Japanese women and increasing trends in adenocarcinoma for Filipinas and Korean women. Along with our findings, this may highlight a need for targeted smoking prevention campaigns, but ways to prevent non-smoking lung cancer remain unclear. As of 2013, screening for lung cancer by low-dose computerized tomography is recommended for heavy, current, or recent smokers (37). However AA females, who are predominantly non-smokers, may not be targeted by these guidelines. Further, oncogenic driver mutations, which serve as the basis for precision therapy for lung cancer, are not well characterized by smoking status. A recent prospective study with a mix of smoking and non-smoking Asians identified some key differences in these patients’ mutation profiles (38), but much additional work is needed including prospective studies of populations with ethnic heterogeneity and variation in smoking behaviors. Breast cancer is a screening detectable cancer, but effective intervention requires access and use of healthcare, which has been found to be heterogonous across Asian subgroups. The AA patient-physician relationship is an important way to encourage healthy living habits that prevent cancer such as diet, exercise, and regular primary care visits (39, 40).
Limitations
This study is based on death records and any inaccuracies could result in misclassification, which is a known limitation in Asian populations (41). Place of birth is recorded on the death certificate, but not by the census, so we are unable to provide rates by decedent nativity which would be particularly useful for this study. Additionally, direct age-adjusted rates may be less reliable in sparse data, therefore we suppressed rates with counts less than 16 and also reported SMRs which do not suffer the same limitations. Nine years is a short follow-up time, and our analysis was modified to accommodate state-by-state gradual adoption of the new death certificate. By including AA groups in the denominator only when deaths were reported, yearly estimates should be approximately unbiased with more uncertainty in earlier years, but there is a possibility of geographic time bias in trend results if the later adopting states had markedly different mortality rates than the earlier ones.
Impact
In his 2016 State of the Union address, Barack Obama announced a new national initiative aimed at finding a cure to cancer (42). Intrinsic to this effort is the need for a comprehensive understanding of the burden of cancer, especially as it pertains to U.S. populations that are experiencing rapid growth and those which are heterogeneous in levels of education and access to health services – here we have focused on Asians, but this also describes other diverse American groups, such as our Hispanic populations. Cancer has surpassed cardiovascular disease as the leading cause of death for most AA ethnicities (43), and in this first ever trend analysis of ethnicity specific AA cancer mortality, we have highlighted cancers of substantial burden than have potential screening mechanisms (e.g., liver, stomach) as well as cancers of less understood etiology (e.g. breast, non-smoking lung cancer) that are disproportionately killing Americans of Asian descent. While the new format death certificate is still in its early stages of adoption, even short term mortality trends can be important for alerting to potential problems and establishing a call to action, as seen in recent media coverage of unexpected spikes in mortality for middle aged NHW men (44). Echoing the objectives of the precision medicine initiative (45), national prevention efforts may benefit from the adoption of ethnicity-specific cancer screening recommendations that take into consideration heterogeneity of cancer etiology as well as varying incidence and mortality patterns. We believe that this study highlights the importance of capturing and considering distinct Asian ethnicity in census data, disease surveillance and vital statistics data, as well as medical records, and research studies. Currently in the U.S. there are no Asian-American cohorts with sufficient sample sizes to allow disaggregation of AA ethnicity for longitudinal analyses of cancer risk factors, but there is clearly a critical need for such a data resource.
Supplementary Material
Acknowledgments
The authors wish to thank Shefali Patel for help with table and figure design and Derek Boothroyd for statistical advice.
Financial support: This work was supported by grants from the National Institutes of Health (1R01MD007012 to M.R.C, K.G.H., K.K., and L.P.P., and 1KL2TR001444 to C.A.T.).
Footnotes
Conflict(s) of interest: None declared.
References
- 1.Hoeffel E, Rastogi E, Myoung KO, Shahid H. The Asian Population: 2010. US Department of Commerce, Economics and Statistics Administration, US Census Bureau; 2012. [Google Scholar]
- 2.Annual Estimates of the Resident Population by Sex, Race, and Hispanic Origin for the United States. April 1, 2010 to July 1, 2011. 2011 [Internet] [cited May 6, 2014]. Available from: http://www.census.gov/popest/data/national/asrh/2011/index.html.
- 3.Profile American Facts for Features. Washington, DC: United States Census Bureau, U.S. Department of Commerce; 2014. Asian/Pacific American Heritage Month: May 2014. [Google Scholar]
- 4.Research UCfHP, editor. California Health Interview Survey. CHIS 2007 Adult Public Use File [computer file] Los Angeles, CA: 2009. [Google Scholar]
- 5.Tseng W, McDonnell DD, Lee C, Wong S. Ethnic Health Assessment for Asian Americans, Native Hawaiians and Pacific Islanders in California. Prepared for the California Program on Access to Care (CPAC) UC Berkeley School of Public Health. 2010 Aug; 2010. Report No. [Google Scholar]
- 6.Asian American Center for Advancing Justice - A Community of Contrasts - Asian Americans in the United States: 2013. Washington, DC: Asian American Center for Advancing Justice; 2013. [Google Scholar]
- 7.Quach T, Liou J, Fu L, Mendiratta A, Tong M, Reynolds P. Developing a proactive research agenda to advance nail salon worker health, safety, and rights. Progress in community health partnerships: research, education, and action. 2012;6(1):75–82. doi: 10.1353/cpr.2012.0005. [DOI] [PubMed] [Google Scholar]
- 8.Quach T, Liu R, Nelson DO, Hurley S, Von Behren J, Hertz A, et al. Disaggregating data on Asian American and Pacific Islander women to provide new insights on potential exposures to hazardous air pollutants in California. Cancer epidemiology, biomarkers & prevention: a publication of the American Association for Cancer Research, cosponsored by the American Society of Preventive Oncology. 2014;23(11):2218–28. doi: 10.1158/1055-9965.EPI-14-0468. [DOI] [PubMed] [Google Scholar]
- 9.Gomez SL, Noone AM, Lichtensztajn DY, Scoppa S, Gibson JT, Liu L, et al. Cancer incidence trends among Asian American populations in the United States, 1990–2008. Journal of the National Cancer Institute. 2013;105(15):1096–110. doi: 10.1093/jnci/djt157. [DOI] [PMC free article] [PubMed] [Google Scholar]
- 10.Trinh QD, Nguyen PL, Leow JJ, Dalela D, Chao GF, Mahal BA, et al. Cancer-specific mortality of Asian Americans diagnosed with cancer: a nationwide population-based assessment. Journal of the National Cancer Institute. 2015;107(6):djv054. doi: 10.1093/jnci/djv054. [DOI] [PubMed] [Google Scholar]
- 11.Fay MP, Feuer EJ. Confidence intervals for directly standardized rates: a method based on the gamma distribution. Statistics in medicine. 1997;16(7):791–801. doi: 10.1002/(sici)1097-0258(19970415)16:7<791::aid-sim500>3.0.co;2-#. [DOI] [PubMed] [Google Scholar]
- 12.Brillinger DR. The natural variability of vital rates and associated statistics. Biometrics. 1986;42(4):693–734. [PubMed] [Google Scholar]
- 13.U.S. Cancer Statistics Working Group. Incidence and Mortality. Atlanta, GA: U.S. Department of Health and Human Services, Centers for Disease Control and Prevention and National Cancer Insitute; 2005. United States Cancer Statistics: 2002. [Google Scholar]
- 14.Breslow NE, Day NE. In: The Design and Analysis of Cohort Studies. Heseltine E, editor. Lyon, FR: International Agency for Research on Cancer; 1987. [Google Scholar]
- 15.Kim HJ, Fay MP, Feuer EJ, Midthune DN. Permutation tests for joinpoint regression with applications to cancer rates. Statistics in medicine. 2000;19(3):335–51. doi: 10.1002/(sici)1097-0258(20000215)19:3<335::aid-sim336>3.0.co;2-z. [DOI] [PubMed] [Google Scholar]
- 16.Devesa SS, Donaldson J, Fears T. Graphical presentation of trends in rates. American journal of epidemiology. 1995;141(4):300–4. doi: 10.1093/aje/141.4.300. [DOI] [PubMed] [Google Scholar]
- 17.SEER*Stat Software. Available from: http://www.seer.cancer.gov.seerstat/
- 18.Miller BA, Chu KC, Hankey BF, Ries LA. Cancer incidence and mortality patterns among specific Asian and Pacific Islander populations in the US Cancer Causes Control. 2008;19(3):227–56. doi: 10.1007/s10552-007-9088-3. [DOI] [PMC free article] [PubMed] [Google Scholar]
- 19.Frisbie WP, Cho Y, Hummer RA. Immigration and the health of Asian and Pacific Islander adults in the United States. American journal of epidemiology. 2001;153(4):372–80. doi: 10.1093/aje/153.4.372. [DOI] [PubMed] [Google Scholar]
- 20.Chang ET, Yang J, Alfaro-Velcamp T, So SK, Glaser SL, Gomez SL. Disparities in liver cancer incidence by nativity, acculturation, and socioeconomic status in California Hispanics and Asians. Cancer epidemiology, biomarkers & prevention: a publication of the American Association for Cancer Research, cosponsored by the American Society of Preventive Oncology. 2010;19(12):3106–18. doi: 10.1158/1055-9965.EPI-10-0863. [DOI] [PMC free article] [PubMed] [Google Scholar]
- 21.Ladabaum U, Clarke CA, Press DJ, Mannalithara A, Myer PA, Cheng I, et al. Colorectal cancer incidence in Asian populations in California: effect of nativity and neighborhood-level factors. Am J Gastroenterol. 2014;109(4):579–88. doi: 10.1038/ajg.2013.488. [DOI] [PMC free article] [PubMed] [Google Scholar]
- 22.Ziegler RG, Hoover RN, Pike MC, Hildesheim A, Nomura AM, West DW, et al. Migration patterns and breast cancer risk in Asian-American women. Journal of the National Cancer Institute. 1993;85(22):1819–27. doi: 10.1093/jnci/85.22.1819. [DOI] [PubMed] [Google Scholar]
- 23.Choi KS, Kwak MS, Lee HY, Jun JK, Hahm MI, Park EC. Screening for gastric cancer in Korea: population-based preferences for endoscopy versus upper gastrointestinal series. Cancer epidemiology, biomarkers & prevention: a publication of the American Association for Cancer Research, cosponsored by the American Society of Preventive Oncology. 2009;18(5):1390–8. doi: 10.1158/1055-9965.EPI-08-0940. [DOI] [PubMed] [Google Scholar]
- 24.Hamashima C, Shibuya D, Yamazaki H, Inoue K, Fukao A, Saito H, et al. The Japanese guidelines for gastric cancer screening. Jpn J Clin Oncol. 2008;38(4):259–67. doi: 10.1093/jjco/hyn017. [DOI] [PubMed] [Google Scholar]
- 25.Stomach Cancer Helicobacter in biological agents. Lyon, France: International Agency for Research on Cancer; 2012. [Google Scholar]
- 26.Heliocobacter pylori Eradication as a Strategy for Preventing Gastric Cancer. Lyon, France: International Agency for Research on Cancer; 2014. [Google Scholar]
- 27.Ma JL, Zhang L, Brown LM, Li JY, Shen L, Pan KF, et al. Fifteen-year effects of Helicobacter pylori, garlic, and vitamin treatments on gastric cancer incidence and mortality. Journal of the National Cancer Institute. 2012;104(6):488–92. doi: 10.1093/jnci/djs003. [DOI] [PMC free article] [PubMed] [Google Scholar]
- 28.National Cancer Institute. Stomach (Gastric) Cancer Screening - for health professionals: National Cancer Institute. [cited December 1, 2015]. Available from: http://www.cancer.gov/types/stomach/hp/stomach-screening-pdq.
- 29.Centers for Disease C. Viral Hepatitis - Hepatitis B Information. [December 1, 2015]. Available from: http://www.cdc.gov/hepatitis/hbv/bfaq.htm#bFAQ05.
- 30.Kowdley KV, Wang CC, Welch S, Roberts H, Brosgart CL. Prevalence of chronic hepatitis B among foreign-born persons living in the United States by country of origin. Hepatology. 2012;56(2):422–33. doi: 10.1002/hep.24804. [DOI] [PubMed] [Google Scholar]
- 31.Screening for Hepatitis C Virus Infection in Adults: U.S. Preventive Services Task Force Recommendation Statement. Ann Intern Med. 2013;159(5) doi: 10.7326/0003-4819-159-5-201309030-00677. [DOI] [PubMed] [Google Scholar]
- 32.Chen MS, Jr, Dang J. Hepatitis B among Asian Americans: Prevalence, progress, and prospects for control. World J Gastroenterol. 2015;21(42):11924–30. doi: 10.3748/wjg.v21.i42.11924. [DOI] [PMC free article] [PubMed] [Google Scholar]
- 33.Gomez SL, Chang ET, Shema SJ, Fish K, Sison JD, Reynolds P, et al. Survival following non-small cell lung cancer among Asian/Pacific Islander, Latina, and Non-Hispanic white women who have never smoked. Cancer epidemiology, biomarkers & prevention: a publication of the American Association for Cancer Research, cosponsored by the American Society of Preventive Oncology. 2011;20(3):545–54. doi: 10.1158/1055-9965.EPI-10-0965. [DOI] [PMC free article] [PubMed] [Google Scholar]
- 34.Charloux A, Quoix E, Wolkove N, Small D, Pauli G, Kreisman H. The increasing incidence of lung adenocarcinoma: reality or artefact? A review of the epidemiology of lung adenocarcinoma. Int J Epidemiol. 1997;26(1):14–23. doi: 10.1093/ije/26.1.14. [DOI] [PubMed] [Google Scholar]
- 35.Kenfield SA, Wei EK, Stampfer MJ, Rosner BA, Colditz GA. Comparison of aspects of smoking among the four histological types of lung cancer. Tob Control. 2008;17(3):198–204. doi: 10.1136/tc.2007.022582. [DOI] [PMC free article] [PubMed] [Google Scholar]
- 36.Cheng I, Le GM, Noone AM, Gali K, Patel M, Haile RW, et al. Lung cancer incidence trends by histology type among Asian American, Native Hawaiian, and Pacific Islander populations in the United States, 1990–2010. Cancer epidemiology, biomarkers & prevention: a publication of the American Association for Cancer Research, cosponsored by the American Society of Preventive Oncology. 2014;23(11):2250–65. doi: 10.1158/1055-9965.EPI-14-0493. [DOI] [PMC free article] [PubMed] [Google Scholar]
- 37.Kumar V, Becker K, Zheng HX, Huang Y, Xu Y. The performance of NLST screening criteria in Asian lung cancer patients. BMC Cancer. 2015;15(1):916. doi: 10.1186/s12885-015-1922-5. [DOI] [PMC free article] [PubMed] [Google Scholar]
- 38.Kawaguchi T, Koh Y, Ando M, Ito N, Takeo S, Adachi H, et al. Prospective Analysis of Oncogenic Driver Mutations and Environmental Factors: Japan Molecular Epidemiology for Lung Cancer Study. J Clin Oncol. 2016 doi: 10.1200/JCO.2015.64.2322. [DOI] [PubMed] [Google Scholar]
- 39.Thompson CA, Gomez SL, Palaniappan LP. Patient and provider characteristics associated with colorectal, breast, and cervical cancer screening among Asian americans. Cancer epidemiology, biomarkers & prevention: a publication of the American Association for Cancer Research, cosponsored by the American Society of Preventive Oncology. 2014 doi: 10.1158/1055-9965.EPI-14-0487. In Press. [DOI] [PMC free article] [PubMed] [Google Scholar]
- 40.Ye J, Mack D, Fry-Johnson Y, Parker K. Health care access and utilization among US-born and foreign-born Asian Americans. J Immigr Minor Health. 2012;14(5):731–7. doi: 10.1007/s10903-011-9543-9. [DOI] [PMC free article] [PubMed] [Google Scholar]
- 41.Arias E, Schauman WS, Eschbach K, Sorlie PD, Backlund E. The validity of race and Hispanic origin reporting on death certificates in the United States. Vital Health Stat 2. 2008;(148):1–23. [PubMed] [Google Scholar]
- 42.Obama BH. 2016 State of the Union. Capitol Building. Washington, DC: 2016. Jan 13, State of the Union Address. Address. [Google Scholar]
- 43.Hastings KG, Jose PO, Kapphahn KI, Frank AT, Goldstein BA, Thompson CA, et al. Leading Causes of Death among Asian American Subgroups (2003–2011) PLoS One. 2015;10(4):e0124341. doi: 10.1371/journal.pone.0124341. [DOI] [PMC free article] [PubMed] [Google Scholar]
- 44.Kolata G. Rise in Deaths for US Whites in Middle Age. Vol. 2015 New York Times; 2015. Nov 3, [Google Scholar]
- 45.The Precision Medicine Initiative. [5/24/2016]. Available from: https://www.whitehouse.gov/precision-medicine.
Associated Data
This section collects any data citations, data availability statements, or supplementary materials included in this article.


