Abstract
Goal
Ventilated patients with the Acute Respiratory Distress Syndrome (ARDS) are predisposed to cyclic parenchymal overdistention and derecruitment, which may worsen existing injury. We hypothesized that intratidal variations in global mechanics, as assessed at the airway opening, would reflect such distributed processes.
Methods
We developed a computational lung model for determining local instantaneous pressure distributions and mechanical impedances continuously during a breath. Based on these distributions and previous literature, we simulated the within-breath variability of airway segment dimensions, parenchymal viscoelasticity, and acinar recruitment in an injured canine lung for tidal volumes (VT) of 10, 15, and 20 mL kg−1 and positive end-expiratory pressures (PEEP) of 5, 10, and 15 cm H2O. Acini were allowed to transition between recruited and derecruited states when exposed to stochastically-determined critical opening and closing pressures, respectively.
Results
For conditions of low VT and low PEEP, we observed small intratidal variations in global resistance and elastance, with a small number of cyclically recruited acini. However with higher VT and PEEP, larger variations in resistance and elastance were observed, and the majority of acini remained open throughout the breath. Changes in intratidal resistance, elastance, and impedance followed well-defined parabolic trajectories with tracheal pressure, achieving minima near 12 to 16 cm H2O.
Conclusion
Intratidal variations in lung mechanics may allow for optimization of ventilator settings in patients with ARDS, by balancing lung recruitment against parenchymal overdistention.
Significance
Titration of airway pressures based on variations in intratidal mechanics may mitigate processes associated with injurious ventilation.
Index Terms: Biological models, computational models, lung pathology, mechanical ventilation, respiratory mechanics
I. Introduction
The Acute Respiratory Distress Syndrome (ARDS) is characterized by airway closure / atelectasis, alveolar flooding, increased lung resistance, and reduced lung compliance. For patients meeting the clinical criteria for ARDS, the mortality rate is about 40%. Supportive mechanical ventilation is the mainstay of the treatment, with one therapeutic goal being improvement in gas exchange. However positive pressure ventilation may worsen lung injury, due to parenchymal overdistention (volutrauma) and repetitive recruitment / derecruitment (atelectrauma). The mechanical stresses associated with these processes result in the release of cytokines and other inflammatory mediators (biotrauma) that may lead to further injury, maldistribution of ventilation, and additional impairments in gas exchange. Therefore treatment goals for ‘lung-protective’ ventilation are to minimize volutrauma by selection of an appropriate tidal volume (VT), and to minimize atelectrauma by appropriate positive end-expiratory pressure (PEEP).
In the ventilated patient, optimization of PEEP and VT often depends on quantitative assessments of airway pressure, as a surrogate indicator of parenchymal stress [1, 2]. Such assessments may include the concavity of the airway pressure vs. time tracing [3, 4], so-called ‘best’ compliance [5–7], or nonlinear distortions of elastance [8, 9]. More recent studies have adjusted PEEP or VT based on measurements of esophageal pressure to estimate transpulmonary pressure, rather than transrespiratory pressure [10]. Despite promising preliminary results, it is still unclear whether measures of esophageal pressure will present a clinically useful technique to adjust ventilator settings [11].
We hypothesized that intratidal variations in global lung mechanics, as assessed at the airway opening, would be a sensitive indicator of these pathophysiologic processes. To test this hypothesis, we developed a computational lung model for determining local instantaneous pressure distributions and mechanical impedances continuously during a breath. Our model incorporates specific pathophysiologic processes for acinar recruitment / derecruitment (R/D) and parenchymal overdistention, typical of what has been observed experimentally in canine acute lung injury [12, 13]. The specific objectives of this study were to: 1) develop a computational model of the injured canine lung incorporating parenchymal overdistention, as well as within-breath recruitment and derecruitment; 2) determine how these processes impact local (acinar) and global (whole lung) mechanical behavior for various PEEP and VT settings; and 3) assess whether intratidal variations in global lung mechanics allow for the optimization of PEEP and VT.
Portions of this work were presented in abstract form at the 2010 Annual Meeting of the Biomedical Engineering Society in Austin, TX [14].
II. Materials and Methods
A. Model Structure
The structure of the model is based on a 47-order, asymmetric binary airway tree of the canine lung [15], consisting of K = 300,153 discrete airway segments (i.e., nodes), including N = 150,077 terminal bronchioles. Each kth airway segment was assumed to behave as a simple distensible cylinder, with length and diameter varying with the cube root of the local instantaneous transmural pressure [16, 17]. Longitudinal impedance for each airway segment depends on the airway segment dimensions, as well as physical gas properties [18]. Viscoelastic airway wall properties were simulated using the appropriate distributions of cartilage and soft tissue for each order [19]. An additional shunt impedance was included to account for the adiabatic compression of gas contained within each airway segment [17]. Each terminal airway segment was subtended by a viscoelastic “constant-phase” acinus with index n [20]. Each acinus was characterized by a tissue elastance parameter (Hn), as well as a dimensionless tissue hysteresivity parameter (ηn) to account for dynamic pressure-volume hysteresis [21]. To simulate parenchymal overdistention [22], both Hn and ηn were allowed to vary as functions of the local instantaneous transpulmonary pressure (Ptp,n) over the course of a breath, according to the quadratic relationships [17,22]:
| (1) |
| (2) |
where Ptp,n is expressed in units of cm H2O, Hn is expressed in units of cm H2O μL−1, and ηn is dimensionless [21]. Equations (1) and (2) thus allow for empirically nonlinear increases in parenchymal tissue elastance and resistance (as determined from the product of Hn and ηn) with distending pressure [22].
The R/D processes were determined according to stochastically assigned values for critical opening / closing pressures for each acinus (Pcrit,n). To determine the distribution of these critical pressures, we reanalyzed the previously published data of Kaczka et al. [13], who reported global dynamic elastance in canines before and after oleic acid-induced lung injury. We found that the ratio of their measured baseline elastance to injured elastance, which is reflective of lung recruitment [23], followed a linear relationship with distending pressure from 5 to 20 cm H2O (Fig. 1-a). We therefore assumed that the slope of the regressed line describing this relationship between the percentage of recruited lung and distending pressure was equivalent to the cumulative distribution of acinar values for Pcrit,n in the model (Fig. 1-b). Using this linear regression, our model assumed that approximately 7.6% of the lung is recruited at a distending pressure of 0 cm H2O, and that 100% of the lung is recruited at about 28 cm H2O. We also constrained acinar recruitment to occur only during inhalation, while derecruitment occurred only during exhalation.
Fig. 1.
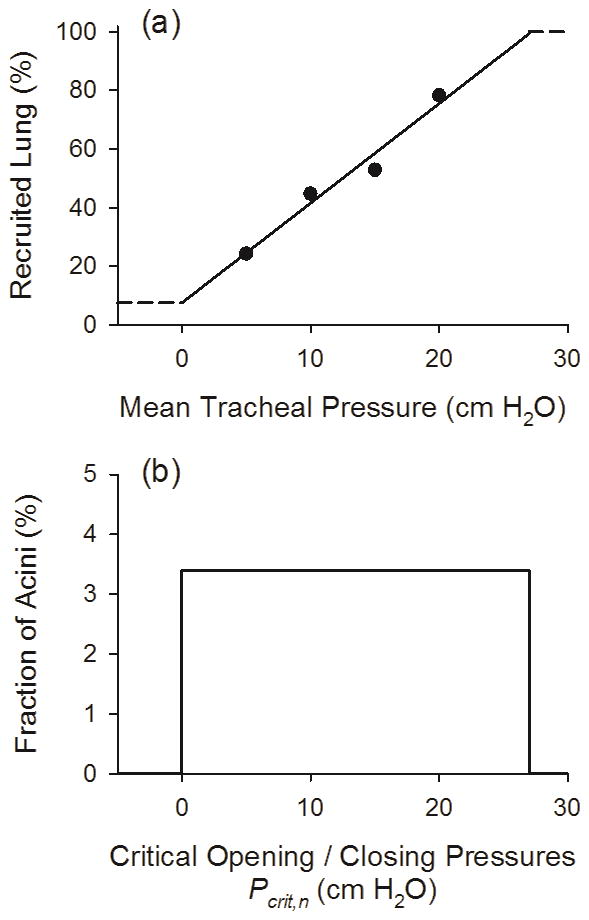
(a) Percentage of recruited lung vs. mean tracheal pressure. Symbols are computed from the experimental data of Kaczka et al. [13], as the ratio healthy to injured dynamic elastance multiplied by 100%. Solid line is the linear regression for the four data points, with horizontal dashed lines denoting the imposed upper and lower limits of recruitment. Thus the model assumes that 7.6% of the lung is recruited at a mean tracheal pressure of 0 cm H2O, while 100% of the lung is recruited at about 28 cm H2O. (b) Distribution of acinar critical opening / closing pressures (Pcrit,n), expressed as the fraction of total acini in the model. This distribution is computed as the slope (i.e., derivative) of the function in (a).
B. Simulations
A numerical algorithm was used to simulate local, instantaneous time-domain variations in regional flow and pressure throughout the airway tree during sinusoidal excitation (Fig. 2). Nonlinear alterations in regional impedance were assumed to arise from intratidal variations in airway size, parenchymal strain-stiffening, and acinar R/D. The algorithm was initiated at time t = 0 seconds, by setting a specified PEEP, VT, and frequency (f, expressed in units of Hz). The trachea of the model was assumed to be driven by an input sinusoidal flow (V̇tr) with amplitude:
| (3) |
Fig. 2.
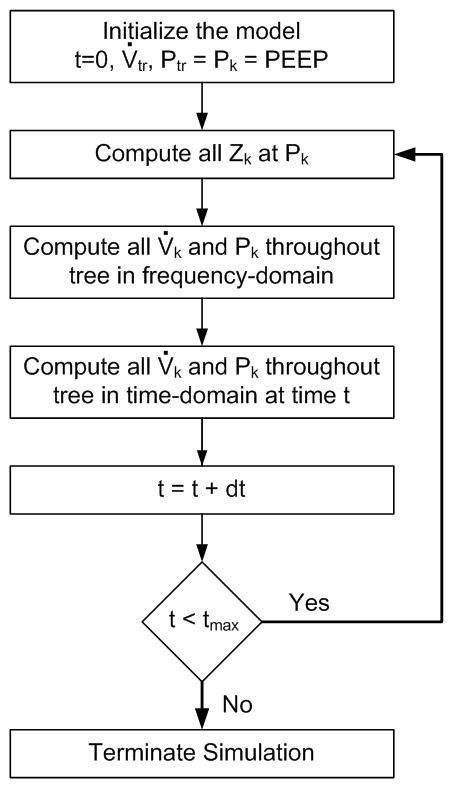
Algorithm used to simulate time-domain variations in flow and pressure based on nonlinear variations in impedance. At time t = 0, the model is initiated by setting a PEEP and sinusoidal tracheal flow magnitude |V̇tr |. The local impedances throughout the tree (Zk) are then computed at this PEEP. Regional pressure magnitudes (Pk) and phases (ϕk) throughout the tree are determined in frequency-domain, and then converted to time-domain values according to (4). The time index is then incremented as t = t + dt.
The percentage of derecruited acini for the starting condition of the model was determined according to the linear regression of Fig. 1-a. A derecuited acinus was assumed to have an impedance value of 1016 + j1016cm H2O s μL−1, which is several orders of magnitude higher than the wall or gas compression impedances of its corresponding terminal bronchiole [18]. When an acinus transitioned from a derecruited state to a recruited state, we assumed that it instantly inflated to its appropriate volume for the corresponding distending pressure, Pcrit,n. In other words, its pressure-volume characteristic was preserved [24].
The mechanical impedance looking into each node of the tree (Zk) was determined in the frequency-domain at this instant of time from the complex summation of all airway, gas compressive, and parenchymal tissue impedances in the appropriate serial and parallel fashion [18]. Global lung impedance (ZL) was defined as the total mechanical impedance to flow at the trachea. Local flow (V̇k) and pressure (Pk) distributions throughout the tree were determined using a recursive flow-divider algorithm with preorder traversal sequence [25]. All impedance values, flows, and pressures within the tree were complex values with both real and imaginary components, or equivalently, magnitudes and phases. At each airway node k, the local pressure magnitudes (|Pk|) and phases (ϕk) at the discrete frequency f were converted to an equivalent time-domain value at time t according to:
| (4) |
The time index was then incremented as t = t + dt, and each Pk(t) in the model was updated. All local impedances and acinar R/D states were recalculated at the new local distending pressures, according to (4). This process was repeated until t = tmax, when the simulation was terminated.
All simulations were performed assuming a 25 kg dog with functional residual capacity of about 1.3 liter at 5 cm H2O distending pressure. In practice, we simulated three complete breaths with a respiratory rate of 20 min−1 (f = 0.333 Hz) at 25 points per breath (dt = 0.125 s), PEEPs of 5, 10, and 15 cm H2O, and VT of 10, 15, and 20 mL kg−1. However we restricted our analysis only to the third breath, to minimize the influence of any numerical transient responses. Total lung impedance ZL as measured at the trachea was determined at each instant of time throughout the course of a breath, along with global lung resistance and elastance as RL = Re{ZL} and EL = -2πf Im{ZL}, respectively. The tracheal pressure (Ptr) at a specific instant of time was first computed in the frequency-domain as
| (5) |
which was converted to its time-domain equivalent according to (4). Given that the nonlinear processes of intratidal overdistention and R/D occurred over the course of a breath, we then estimated the degree of nonlinear distortion in Ptr using the harmonic index κd of Zhang et al. [26]:
| (6) |
where ℘tot is the total spectral power in Ptr, and ℘ni is the power in Ptr only at those frequencies in the input V̇tr signal with no spectral energy. Thus if the Ptr waveform corresponded to a pure sinusoid, then κd = 0. In addition, we performed multiple linear regression on the tracheal pressure, flow, and volume data from the single breath in the time-domain [27] using the following equation of motion:
| (7) |
where R denotes an estimated linear coefficient of lung resistance, E1, E2, and E3 are polynomial coefficients of lung elastance, and Vtr denotes delivered volume at the trachea at time t. Equation (7) assumes that the relationship between tracheal pressure and volume is best characterized by a cubic polynomial [28]. Based on estimates of these elastance coefficients, we determined an extended version of a nonlinear volume-dependent elastance index [4, 9, 29]:
| (8) |
where %E3 denotes the percentage of nonlinear elastic recoil.
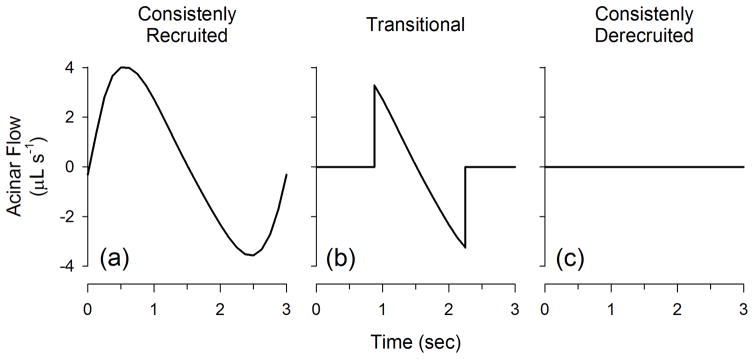
For the purpose of assessing the local mechanics of the injured lung, we characterized the acinar flow patterns into three distinct subgroups as illustrated in Fig. 3: (a) those that were consistently recruited and received advective flow during the course of the entire breath; (b) those that were transitional and were either recruited and / or derecuited during the breath; and (c) those that were consistently derecruited and received no flow at any time point in the breathing cycle. Thus consistently recruited acini have the highest potential for overdistension, consistently-derecruited do not participate in gas exchange, and transitional acini are at the highest risk for atelectrauma. In addition, we defined a so-called ‘recruitment duty cycle’ for each acinus (RDCn) as the amount of time that the acinus remains in the recruited state (Trec,n) divided by the total duration of the breath (Ttot):
| (9) |
Fig. 3.
Acinar flow patterns in the model are divided into three distinct subgroups: (a) consistently recruited; (b) transitional; and (c) consistently derecruited.
Thus the RDCn for consistently recruited acini would be 1, consistent derecuited acini would be 0, and transitional acini would be between 0 and 1. RDCn histograms for each PEEP and VT were constructed with bin sizes of 0.08333. Finally we examined total lung dynamic pressure-volume (P-V) loops for the individual breaths at each PEEP and VT, by plotting tidal volume against the absolute Ptr during inspiration and expiration.
All algorithms were written and executed using Matlab v7.0 (The Mathworks, Natick, MA). Total computation time for one simulation at a specified VT and PEEP was approximately 12 hours using a Dell desktop computer with an Intel Pentium® 4 processor running Windows 32 bit operating system at 2.80 GHz and 3.42 GB RAM.
III. Results
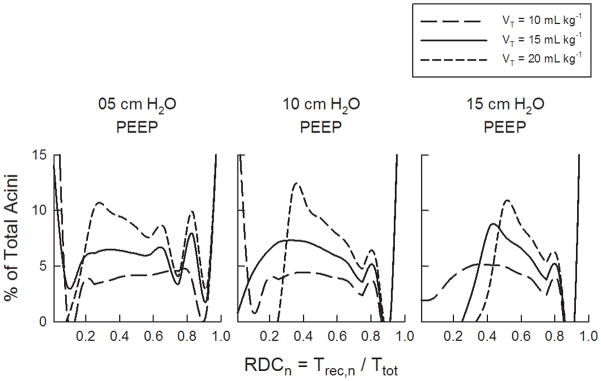
Fig. 4 shows the percentages of consistently recruited, transitional, and consistently derecruited acini in the model for 5, 10, and 15 cm H2O PEEP and 10, 15, and 20 mL kg−1VT. For our simulated conditions, the greatest percentage of consistently derecruited acini was about 38%, which occurred at the lowest PEEP of 5 cm H2O, and lowest VT of 10 mL kg−1. The amount of derecruited acini at this PEEP decreased to about 16% for 15 mL kg−1VT. The percentage of consistently recruited acini remained constant with VT for each PEEP level, but increased as PEEP increased. The relative number of transitional acini increased with increasing VT for 5 cm H2O PEEP, from about 38% at VT = 10 mL kg−1 to about 76% at VT = 20 mL kg−1. Consistently derecruited acini occurred only at VT of 10 and 15 mL kg−1 for 5 cm H2O PEEP, and only at VT of 10 mL kg−1 for 10 cm H2O PEEP. For 5 and 10 cm H2O PEEP, transitional acini increased with increasing VT. However for a given PEEP, the number of consistently recruited acini remained unchanged with VT. Fig. 5 shows the distribution of acinar recruitment duty cycles (RDCn). Consistent with Fig. 4, these histograms demonstrate that for a given PEEP, the number of transitional acini at a specified RDC value generally increased with increasing VT. However, the time that transitional acini remained in a recruited state (i.e., Trec,n), increased with both PEEP and VT.
Fig. 4.
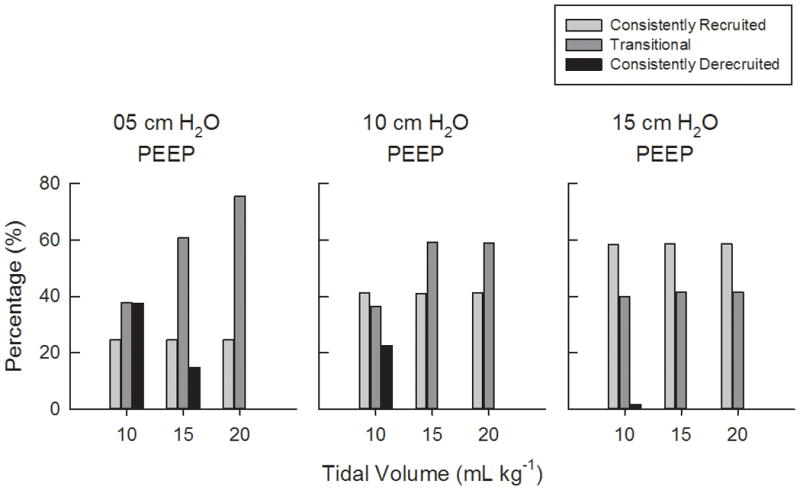
Percentages of consistently recruited, transitional, and consistently derecruited acini in the model for 5, 10, and 15 cm H2O PEEP and 10, 15, and 20 mL kg−1VT.
Fig. 5.
Histograms of the acinar recruitment duty cycle (RDCn), defined as the fraction of time that acinus stays opened throughout a breath. Histograms are shown for PEEPs of (a) 5, (b) 10, and (c) 15 cm H2O, and tidal volumes of 10, 15, and 20 mL kg−1.
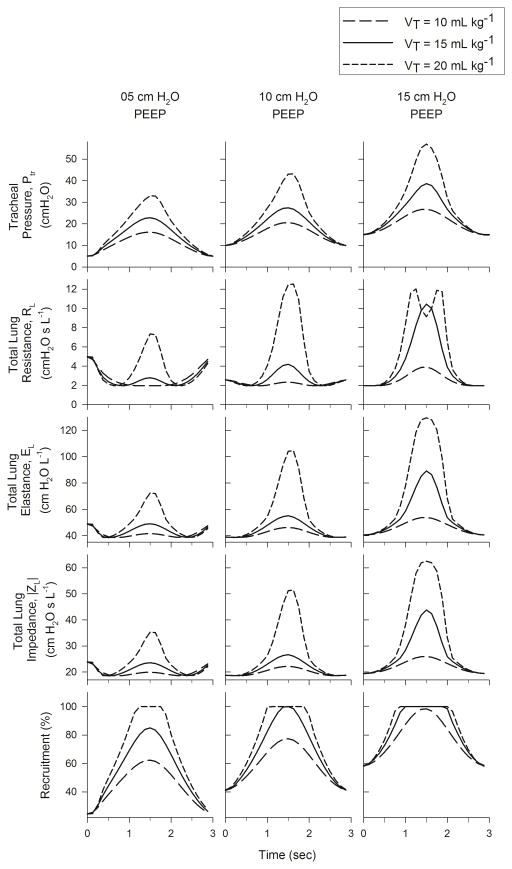
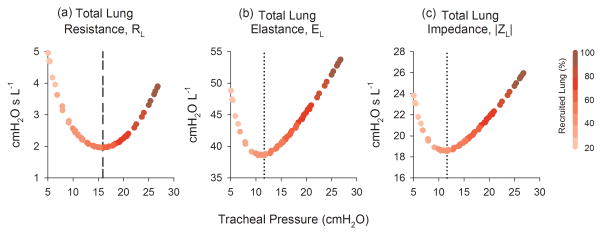
Fig. 6 shows the within-breath variations of Ptr, RL, EL, |ZL|, as well as the percentage of recruited acini as functions of time. The peak Ptr increased with both PEEP and VT. The smallest peak Ptr occurred at PEEP of 5 cm H2O and VT of 10 mL kg−1, while the largest occurred at PEEP of 15 cm H2O and VT of 20 mL kg−1. The greatest variations in RL, EL, and |ZL| occurred for VT of 20 mL kg−1, regardless of PEEP. Within-breath variations in these three parameters closely followed the corresponding temporal variations in Ptr. However for 5 and 10 cm H2O PEEP, the RL, EL, and |ZL| exhibited slight decreases at the beginning of the breath and slight increases at the end of the breath. The degree of harmonic distortion in Ptr, κd, also increased with both PEEP and VT, with values ranging between 7.53% to 35.4% (Table I). The %E3 index demonstrated more complicated behavior (Table II). At PEEP of 5 cm H2O, %E3 yielded negative values for all VT, although its magnitude decreased with increasing VT. However at PEEP of 10 and 15 cm H2O, %E3 was positive for all VT, and generally increased with increasing VT. The smallest magnitude of %E3 (7.3%) occurred at PEEP of 10 cm H2O and VT of 10 mL kg−1. Regardless of PEEP or VT, the RL, EL, and |ZL| followed well-defined, parabolic trajectories with Ptr, achieving minima at 15.9, 11.6, and 11.6 cm H2O, respectively (Fig. 7).
Fig. 6.
Tracheal pressure variations and within breath variations of lung resistance, elastance, impedance, and acinar recruitment for 5, 10, and 15 cm H2O PEEP and 10, 15, and 20 mL kg−1VT.
Table I.
percent harmonic distortion (κd) for tracheal pressure waveforms of the model at three PEEP levels (5, 10, and 15 cm H2O) and three tidal volumes (10, 15, and 20 mL kg−1), as computed using the method of Zhang et al. [26].
| Tidal Volumes | 05 cm H2O PEEP | 10 cm H2O PEEP | 15 cm H2O PEEP |
|---|---|---|---|
| 10 mL kg−1 | 7.53 | 8.98 | 11.3 |
| 15 mL kg−1 | 11.1 | 13.8 | 26.5 |
| 20 mL kg−1 | 22.7 | 33.4 | 35.4 |
Table II.
Nonlinear volume-dependent elastance index (%E3) at three PEEP levels (5, 10, and 15 cm H2O) and three tidal volumes (10, 15, and 20 mL kg−1)
| Tidal Volumes | 05 cm H2O PEEP | 10 cm H2O PEEP | 15 cm H2O PEEP |
|---|---|---|---|
| 10 mL kg−1 | −52.2% | 7.3% | 20.9% |
| 15 mL kg−1 | −40.9% | 15.5% | 21.6% |
| 20 mL kg−1 | −26.0% | 14.9% | 36.8% |
Fig. 7.
(a) Total lung resistance (RL), (b) elastances (EL), and (c) impedance magnitude (|ZL|) as functions of tracheal pressure. Trajectories are color coded (shaded) to denote the percentage of recruited lung as a function of tracheal pressure. Vertical dashed /dotted lines denote ‘optimal’ tracheal pressures, according to the pressure for which RL, EL, or |ZL| is minimized.
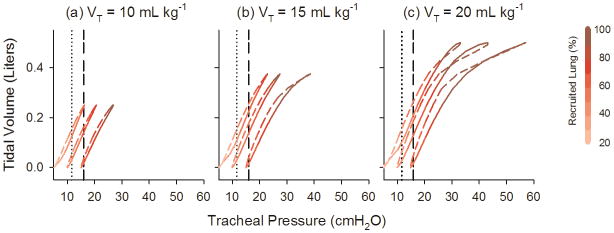
Fig. 8 shows the dynamic P-V loops for individual breaths at each PEEP and VT. The loops are color-coded to indicate the percentage of recruited lung during the inspiratory and expiratory portions of the breath. For each VT, the P-V loops were shifted toward the right with increasing PEEP. Lung volume exhibited a near-linear relationship with Ptr for pressures less than 25 cm H2O. Characteristic flattening of the loops near end-inspiration occurred above 28 cm H2O, and only when the lung was 100% recruited.
Fig. 8.
Simulated dynamic pressure-volume loops for single breaths at (a) 10, (b) 15, and (c) 20 mL kg−1 and 5, 10, and 15 cm H2O PEEP (left to right within each panel). Loops are color coded (shaded) to denote the percentage of recruited lung during the course of a breath. Solid lines denote inspiration, while dashed lines denote expiration. Vertical lines denote ‘optimal’ tracheal pressure, as defined according to the minimum EL or |ZL| (11.6 cm H2O, dotted line) or RL minimum (15.9 cm H2O, dashed line) criteria (Fig. 7).
IV. Discussion
In this study, we developed a computational lung model to simulate within-breath variations in airway segment dimensions, parenchymal viscoelasticity, and acinar R/D in an injured canine lung during physiological PEEP and VT. Our model relied on numerical techniques in both the frequency-domain and time-domain (Fig. 2), to determine the local instantaneous pressure distributions and mechanical impedances throughout an asymmetric branching airway tree, continuously during a breath. This combined approach was utilized in order to predict how nonlinear processes, such as R/D and overdistention, affect local and global mechanics of the injured lung within a single breath. The computation associated with the vast number of regional impedances, flows, pressures in the asymmetric airway tree used in this study is most easily accomplished in the frequency-domain [17, 25], given the computational efficiency of calculating and storing the mechanical impedances looking into each node of the tree [18]. Frequency-domain approaches also allow one easily to determine regional flow and pressure distributions throughout the tree [17, 25], which are required to determine whether any acinus in the model has been exposed to a critical opening or closing pressure. However, frequency-domain analyses have traditionally been constrained to describing the steady-state behavior of linear, time-invariant approximations of the respiratory system during sinusoidal excitation. While similar simulations can be performed in the time-domain, such models are generally limited to symmetric airway trees [30, 31] or simpler descriptions of parenchymal mechanics [32] due to tremendous computational burden associated with asymmetric trees and fractional viscoelasticity. By contrast, our model relies on the assumptions of piecewise linearity and time invariance over very small time scales, in order to quantify the effects of nonlinear R/D and overdistention on apparent global lung mechanics over a longer period of time.
Consistent with previous studies [33], our model predicts that the most injurious conditions for the lung occur during low PEEP and high VT. Indeed Fig. 4 indicates that this condition is associated with the greatest number of acini in the transitional state, with nearly 80% of acini experiencing intratidal R/D for 5 cm H2O PEEP and 20 mL kg−1VT. The repetitive opening and closing of these transitional acini would thus be at the highest risk for atelectrauma. The histograms of acinar recruitment duty cycles (Fig. 5) provide additional information on the temporal occurrences of R/D phenomena for the population of transitional acini in the model. For example, we found that the number of transitional acini at a specified RDC increased with increasing VT. Moreover, these transitional acini were shifted higher values of RDC with increasing VT, indicating that these acini spent less time in a derecruited state during the course of a breath. Whether or not such behavior would impact the efficiency of gas exchange or the lung’s propensity to ventilator-associated lung injury is unclear from these simulations.
Our simulations also support the notion of an ‘optimal’ distending pressure in the injured lung, for which the opposing factors of R/D and overdistention are appropriately balanced [34]. Variations in RL, EL, and |ZL| near minima reflect reduced mechanical stress. Below these minima, RL, EL, and |ZL| will increase with decreasing airway pressure, as more lung units are derecruited. Above these minima, the value of these parameters will increase as the lung parenchyma tends toward overdistention. While it may be difficult to determine a nonarbitrary and quantifiable definition for overdistention in our model, one may assume that significant pathologic overdistention would occur once 100% of the lung has been recruited, consistent with the large intratidal variations in RL, EL, and |ZL| (Fig. 6). Thus keeping airway pressure as close as possible to these corresponding minima, thus minimizing intratidal variations mechanical properties, may allow for the best compromise between the pathophysiologic processes of cyclic R/D and potential parenchymal overdistention. It should be noted, however, that ventilatory airway pressures near these minima do not necessarily imply maximal lung recruitment or minimal overdistention. In fact, our ‘optimal’ pressures of 15.6 cm H2O (based on RL) and 11.6 cm H2O (based on EL and |ZL|) were associated with only about 41% and 45% lung recruitment, respectively. Moreover, the empiric relationships used to describe Hn and ηn as functions of transpulmonary pressure (Equations 1 and 2) were derived from the mechanics of healthy canine lungs [22]. Thus these optimal pressures may not show influence from possible surfactant dysfunction typical of lungs with ARDS. Nonetheless, these simulated optimal pressures are in fairly close quantitative agreement with studies of optimal pressures based on estimates of ‘best’ compliance, elastance, or reactance in other mammalian species with injured lungs [6, 7, 35–37].
Our simulations also illustrate that the concavity of the pressure-volume (P-V) curve of the injured lung does not reliably reflect processes of recruitment or overdistention, or predict where on the curve an optimal distending pressure might occur. Traditionally, the P-V curve of the injured lung can be described empirically with a sigmoidal function [28], with two points demarcated: the so-called ‘upper inflection point’ representing the point at which the majority of lung parenchyma experiences overdistention, and the ‘lower inflection point’ representing the process of maximum alveolar recruitment [38]. For our model, no discernable lower inflection point was observed in the simulated P-V loops, despite the fact that ongoing recruitment was occurring during inflation for pressures less than 28 cm H2O (Fig. 8). Indeed, these dynamic P-V curves were relatively linear from 5 to 28 cm H2O, regardless of PEEP or VT. The upper inflection point could only be discerned for tracheal pressures above 28 cm H2O, after 100% of acini had been recruited. Above 28 cm H2O the P-V curves demonstrated characteristic flattening, as the combined elastances of the individual acini increased with transpulmonary pressure according to (1).
We also investigated the sensitivity of two different nonlinear indices, κd and %E3, to detect acinar R/D and parenchymal overdistention. The κd index has been previously used to assess the strength of nonlinearities in the respiratory system, for lungs driven by both pure sinusoids [39] as well as certain types of broadband waveforms with sparse frequency content [26]. In our case, we used κd to assess the degree to which our tracheal pressure waveform deviated from a simple ideal sinusoid. As expected, κd demonstrated increases with both PEEP and VT (Table I), as both intratidal R/D and overdistention are highly nonlinear phenomena. Thus, these processes result considerable harmonic distortion and spectral crosstalk in the resulting tracheal pressure waveform [26, 39–41]. However increases in κd alone did not distinguish between these two processes, or the relative extent to which either contributed to the nonlinear behavior. For example the greatest value of κd (35.4%) occurred at the highest level of both PEEP (15 cm H2O) and VT (20 mL kg−1), a condition for which about 40% of the acini were transitional (at risk for atelectrauma) and 60% consistently recruited (at risk for volutrauma). However for the condition of 5 cm H2O PEEP and 20 mL kg−1 VT, the value of κd was 22.7%, which corresponded to about 25% consistently recruited acini and 75% transitional acini. Another limitation of the κd index is its lack of applicability to generalized broadband driving signals, such as volume-cycled or pressure-cycled ventilator waveforms.
Alternatively, the values of %E3 did appear to distinguish between intratidal R/D and overdistention (Table II). This index is based on the assumption that apparent lung recoil pressure may be adequately characterized by a third order polynomial relationship with volume (8). At the lowest PEEP level of 5 cm H2O, intratidal R/D would be expected to dominate the nonlinear behavior of our model. In this case the value of %E3 was always negative, although its magnitude decreased with increasing VT. By contrast at the highest PEEP of 15 cm H2O, for which overdistention would be expected to dominate nonlinear behavior, %E3 was always positive and increased with increasing VT. The smallest magnitude of %E3 (7.3%) occurred at the mid-level of PEEP (10 cm H2O) and the lowest VT (10 mL kg−1), during which Ptr varied from 10 cm H2O to just under 28 cm H2O. This suggests that %E3 could have some clinical utility for the adjustment of PEEP or VT in patients with ARDS, as it may be an additional indicator of the degree to which airway pressure is deviating from the so-called ‘optimal’ pressures of Fig. 7.
Several limitations of this model should be noted. First, we simulated the effects of PEEP and VT on R/D and parenchymal overdistention over a very short time scale (i.e., a single breath). In reality, sudden changes in PEEP and VT may manifest themselves over much longer time scales, and may require several breaths to achieve a steady-state [42]. Our model also assumes that recruitment or derecruitment of an acinus occurs instantaneously, when its distending pressure reaches a threshold critical opening or closing pressure, respectively. In reality, the recruitment or derecruitment processes may not be instantaneous, but rather may require seconds to minutes after an acinus has been exposed to such a critical pressure [24]. Nonetheless, there is strong experimental evidence to suggest that ongoing R/D occurs within the time scale of a single breath [43]. Also for the sake of model simplicity, and to be consistent with the ‘steady-state’ level of recruitment measured by Kaczka et al. during small amplitude forced oscillations [13], we constrained the opening and closing pressures for each individual acinus to be equivalent. However, the actual opening and closing pressures for individual acini may be very different [24]. In addition, we restricted our volume forcings to pure sinusoidal waveforms, to simplify the computational burden associate with multiple conversions between the time-domain and frequency-domain during the course of a breath. In reality, ventilator waveforms are broadband periodic signals, with harmonics above the fundamental frequency of excitation [44]. While more realistic ventilator waveforms may be constructed from a superposition of multiple sinusoids [45], the computation of flow and pressure distributions throughout the airway tree would require considerably more processing time. Finally, our one dimensional airway network does not allow for anatomic specificity of lung injury [15]. Nonetheless the computational techniques detailed here can easily be extended to three dimensional airway trees, such that specific regions of lung injury can be assigned to distinct anatomic locations [46].
V. Conclusions
In summary, our model simulations demonstrate that stable lung recruitment depends on both static (PEEP) and dynamic (VT) factors. While higher PEEP levels and high VT yield more consistently recruited acini, increases in VT are associated with increases in intratidal recruitment / derecruitment as well as the stresses associated with parenchymal overdistention. Titration of airway pressures based on variations in intratidal mechanics may therefore minimize the processes associated with Ventilator-Associated Lung Injury.
Acknowledgments
This work was supported in part by National Institutes of Health Grants HL112547 (RA), and HL108724 (DWK).
Portions of these simulations were performed while the authors were affiliated with Beth Israel Deaconess Medical Center and Harvard Medical School, Boston, MA.
Glossary of Nomenclature
- ARDS
Acute Respiratory Distress Syndrome
- E1,E2, E3
polynomial coefficients of lung elastance
- EL
total lung elastance
- f
breathing frequency in Hz
- Hn
tissue elastance of acinus n
- j
unit imaginary number (i.e., )
- k
index for nodes (airway segments) in binary tree
- K
total number of airway segments in model (300,153)
- κd
harmonic distortion index
- n
acinar index
- N
total number of acini in the model (150,077)
- Pcrit,n
critical opening / closing pressure of acinus n
- Pk
local pressure at airway node k
- |Pk|
magnitude of local pressure at airway node k
- PEEP
positive end-expiratory pressure
- Ptp,n
transpulmonary pressure of acinus n
- Ptr
tracheal pressure
- ℘ni
spectral power of Ptr for harmonics above the ventilation frequency
- ℘tot
total spectral power of Ptr
- R
linear coefficient of lung resistance
- R/D
recruitment / derecruitment
- RDCn
recruitment duty cycle of acinus n
- RL
total lung resistance
- t
time index in seconds
- Trec,n
time that acinus n remains in a recruited state
- Ttot
total time period of a breath
- VT
tidal volume
- Vtr
volume delivered at the trachea
- V̇tr
tracheal flow
- |V̇tr|
magnitude of tracheal flow
- XL
total lung reactance
- ZL
total lung impedance
- |ZL|
magnitude of total lung impedance
- ηn
tissue hysteresivity of acinus n
- π
number of radians in a semi-circle
- ϕk
phase of local pressure at airway node k
Biographies

Reza Amini received his Ph.D. in mechanical engineering from Northeastern University in Boston, MA in 2007. He was a postdoctoral research fellow in the Department of Anesthesiology & Critical Care Medicine at Johns Hopkins University in Baltimore, MD and a research fellow at Beth Israel Deaconess Medical Center and Harvard Medical School in Boston, MA. He is currently a Senior Analyst at Cimetrics, Inc. in Boston, MA.

Jacob Herrmann received the B.S. (magna cum laude) and M.S. degrees in biomedical engineering from Boston University in Boston, MA in 2012 and 2015, respectively. He is currently a candidate for the Ph.D. degree in biomedical engineering at the University of Iowa in Iowa City, IA. His research interests include computational modeling of respiratory structure and function based imaging and physiologic measurements.

David W. Kaczka is an Associate Professor of Anesthesia, Biomedical Engineering, and Radiology at the University of Iowa. He received the B.S. (summa cum laude), M.S., and Ph.D. degrees in biomedical engineering from Boston University College of Engineering in 1990, 1993, and 2000 respectively, as well as the M.D. degree from Boston University School of Medicine in 2000. He completed his residency in anesthesiology at Johns Hopkins University in 2004. Dr. Kaczka has held previous faculty appointments Johns Hopkins University and Harvard Medical School. His current research interests include computational modeling of respiratory mechanics and gas exchange, design and function of mechanical ventilators, patient monitoring, and image processing.
Contributor Information
Reza Amini, Beth Israel Deaconess Medical Center and Harvard Medical School, Boston MA, USA. He is with Cimetrics, Inc., Boston, MA, USA.
Jacob Herrmann, University of Iowa, Iowa City, IA, USA.
David W. Kaczka, University of Iowa, Iowa City, IA, USA.
References
- 1.The ARDS Network. Ventilation with lower tidal volumes as compared with traditional tidal volumes for acute lung injury and the acute respiratory distress syndrome. N Engl J Med. 2000;342:1301–1308. doi: 10.1056/NEJM200005043421801. [DOI] [PubMed] [Google Scholar]
- 2.Brower RG, et al. Higher versus lower positive end-expiratory pressures in patients with the acute respiratory distress syndrome. N Engl J Med. 2004;351:327–336. doi: 10.1056/NEJMoa032193. [DOI] [PubMed] [Google Scholar]
- 3.Ranieri VM, et al. Pressure-time curve predicts minimally injurious ventilatory strategy in an isolated rat lung model. Anesthesiology. 2000;93:1320–1328. doi: 10.1097/00000542-200011000-00027. [DOI] [PubMed] [Google Scholar]
- 4.Carvalho AR, et al. Ability of dynamic airway pressure curve profile and elastance for positive end-expiratory pressure titration. Intensive Care Med. 2008 Dec;34:2291–9. doi: 10.1007/s00134-008-1301-7. [DOI] [PMC free article] [PubMed] [Google Scholar]
- 5.Zannin E, et al. Optimizing positive end-expiratory pressure by oscillatory mechanics minimizes tidal recruitment and distension: an experimental study in a lavage model of lung injury. Crit Care. 2012 Nov;16:R217. doi: 10.1186/cc11858. [DOI] [PMC free article] [PubMed] [Google Scholar]
- 6.Zannin E, et al. Optimal mean airway pressure during high-frequency oscillatory ventilation determined by measurement of respiratory system reactance. Pediatr Res. 2014 Apr;75:493–9. doi: 10.1038/pr.2013.251. [DOI] [PubMed] [Google Scholar]
- 7.Carvalho AR, et al. Positive end-expiratory pressure at minimal respiratory elastance represents the best compromise between mechanical stress and lung aeration in oleic acid induced lung injury. Crit Care. 2007;11:R86. doi: 10.1186/cc6093. [DOI] [PMC free article] [PubMed] [Google Scholar]
- 8.Carvalho AR, et al. Volume-independent elastance: a useful parameter for open-lung positive end-expiratory pressure adjustment. Anesth Analg. 2013;116:627–633. doi: 10.1213/ANE.0b013e31824a95ca. [DOI] [PubMed] [Google Scholar]
- 9.Carvalho AR, et al. Detection of tidal recruitment/overdistension in lung-healthy mechanically ventilated patients under general anesthesia. Anesth Analg. 2013 Mar;116:677–84. doi: 10.1213/ANE.0b013e318254230b. [DOI] [PubMed] [Google Scholar]
- 10.Talmor D, et al. Mechanical ventilation guided by esophageal pressure in acute lung injury. N Engl J Med. 2008;359:2095–2104. doi: 10.1056/NEJMoa0708638. [DOI] [PMC free article] [PubMed] [Google Scholar]
- 11.Loring SH, et al. Esophageal pressures in acute lung injury: do they represent artifact or useful information about transpulmonary pressure, chest wall mechanics, and lung stress? J Appl Physiol. 2010;108:512–522. doi: 10.1152/japplphysiol.00835.2009. [DOI] [PMC free article] [PubMed] [Google Scholar]
- 12.Kaczka DW, et al. Analysis of regional mechanics in canine lung injury using forced oscillations and 3D image registration. Ann Biomed Eng. 2011;39:1112–1124. doi: 10.1007/s10439-010-0214-0. [DOI] [PMC free article] [PubMed] [Google Scholar]
- 13.Kaczka DW, et al. Quantifying mechanical heterogeneity in canine acute lung injury: Impact of mean airway pressure. Anesthesiology. 2005;103:306–317. doi: 10.1097/00000542-200508000-00014. [DOI] [PubMed] [Google Scholar]
- 14.Amini R, Kaczka DW. Effects of intratidal overdistention and derecruitment on global lung mechanics: A simulation study. The Biomedical Engineering Society Annual Meeting; Austin, TX. 2010. p. 69. [Google Scholar]
- 15.Horsfield K, et al. An asymmetrical model of the airways of the dog lung. J Appl Physiol. 1982;52:21–26. doi: 10.1152/jappl.1982.52.1.21. [DOI] [PubMed] [Google Scholar]
- 16.Thorpe CW, Bates JHT. Effect of stochastic heterogeneity on lung impedance during acute bronchoconstriction: a model analysis. J Appl Physiol. 1997;82:1616–1625. doi: 10.1152/jappl.1997.82.5.1616. [DOI] [PubMed] [Google Scholar]
- 17.Amini R, Kaczka DW. Impact of ventilation frequency and parenchymal stiffness on flow and pressure distribution in a canine lung model. Ann Biomed Eng. 2013;41:2699–2711. doi: 10.1007/s10439-013-0866-7. [DOI] [PMC free article] [PubMed] [Google Scholar]
- 18.Kaczka DW, et al. Reliability of estimating stochastic lung tissue heterogeneity from pulmonary impedance spectra: a forward-inverse modeling study. Ann Biomed Eng. 2007;35:1722–1738. doi: 10.1007/s10439-007-9339-1. [DOI] [PubMed] [Google Scholar]
- 19.Habib RH, et al. Serial distribution of airway mechanical properties in dogs: effects of histamine. J Appl Physiol. 1994;77:554–566. doi: 10.1152/jappl.1994.77.2.554. [DOI] [PubMed] [Google Scholar]
- 20.Hantos Z, et al. Input impedance and peripheral inhomogeneity of dog lungs. J Appl Physiol. 1992;72:168–178. doi: 10.1152/jappl.1992.72.1.168. [DOI] [PubMed] [Google Scholar]
- 21.Fredberg JJ, Stamenovic D. On the imperfect elasticity of lung tissue. J Appl Physiol. 1989;67:2408–2419. doi: 10.1152/jappl.1989.67.6.2408. [DOI] [PubMed] [Google Scholar]
- 22.Kaczka DW, Smallwood JL. Constant-phase descriptions of canine lung, chest wall, and total respiratory viscoelasticity: effects of distending pressure. Respir Physiol Neurobiol. 2012;183:75–84. doi: 10.1016/j.resp.2012.06.008. [DOI] [PMC free article] [PubMed] [Google Scholar]
- 23.Barnas GM, et al. Lung tissue and airway impedance during pulmonary edema in the normal range of breathing. J Appl Physiol. 1995;78:1889–1897. doi: 10.1152/jappl.1995.78.5.1889. [DOI] [PubMed] [Google Scholar]
- 24.Bates JHT, Irvin CG. Time dependence of recruitment and derecruitment in the lung: a theoretical model. J Appl Physiol. 2002;93:705–713. doi: 10.1152/japplphysiol.01274.2001. [DOI] [PubMed] [Google Scholar]
- 25.Colletti AA, et al. Simulating ventilation distribution in heterogeneous lung injury using a binary tree data structure. Comput Biol Med. 2011;41:936–945. doi: 10.1016/j.compbiomed.2011.08.004. [DOI] [PMC free article] [PubMed] [Google Scholar]
- 26.Zhang Q, et al. Harmonic distortion from nonlinear systems with broadband inputs: applications to lung mechanics. Ann Biomed Eng. 1995;23:672–681. doi: 10.1007/BF02584464. [DOI] [PubMed] [Google Scholar]
- 27.Kaczka DW, et al. Assessment of time-domain analyses for estimation of low-frequency respiratory mechanical properties and impedance spectra. Ann Biomed Eng. 1995;23:135–151. doi: 10.1007/BF02368321. [DOI] [PubMed] [Google Scholar]
- 28.Venegas JG, et al. A comprehensive equation for pulmonary pressure-volume curve. J Appl Physiol. 1998;84:389–395. doi: 10.1152/jappl.1998.84.1.389. [DOI] [PubMed] [Google Scholar]
- 29.Kano S, et al. Influence of nonlinearities on estimates of respiratory mechanics using multilinear regression analysis. J Appl Physiol. 1994;77:1185–1197. doi: 10.1152/jappl.1994.77.3.1185. [DOI] [PubMed] [Google Scholar]
- 30.Venegas JG, et al. Self-organized patchiness in asthma as a prelude to catastrophic shifts. Nature. 2005;434:777–782. doi: 10.1038/nature03490. [DOI] [PubMed] [Google Scholar]
- 31.Pedley TJ, et al. The prediction of pressure drop and variation of resistance within the human bronchial airways. Respir Physiol. 1970;9:387–405. doi: 10.1016/0034-5687(70)90094-0. [DOI] [PubMed] [Google Scholar]
- 32.Nucci G, et al. A morphometric model of lung mechanics for time-domain analysis of alveolar pressures during mechanical ventilation. Ann Biomed Eng. 2002;30:537–545. doi: 10.1114/1.1475344. [DOI] [PubMed] [Google Scholar]
- 33.Seah AS, et al. Quantifying the roles of tidal volume and PEEP in the pathogenesis of ventilator-induced lung injury. Ann Biomed Eng. 2011;39:1505–1516. doi: 10.1007/s10439-010-0237-6. [DOI] [PubMed] [Google Scholar]
- 34.Dellacà RL, et al. Optimisation of positive end-expiratory pressure by forced oscillation technique in a lavage model of acute lung injury. Intensive Care Med. 2011;37:1021–1030. doi: 10.1007/s00134-011-2211-7. [DOI] [PubMed] [Google Scholar]
- 35.Kostic P, et al. Positive end-expiratory pressure optimization with forced oscillation technique reduces ventilator induced lung injury: a controlled experimental study in pigs with saline lavage lung injury. Crit Care. 2011;15:R126. doi: 10.1186/cc10236. [DOI] [PMC free article] [PubMed] [Google Scholar]
- 36.Bellardine-Black CL, et al. Relationship between dynamic respiratory mechanics and disease heterogeneity in sheep lavage injury. Crit Care Med. 2007;35:870–878. doi: 10.1097/01.CCM.0000257331.42485.94. [DOI] [PubMed] [Google Scholar]
- 37.Suarez-Sipmann F, et al. Use of dynamic compliance for open lung positive end-expiratory pressure titration in an experimental study. Crit Care Med. 2007 Jan;35:214–21. doi: 10.1097/01.CCM.0000251131.40301.E2. [DOI] [PubMed] [Google Scholar]
- 38.Hickling KG. The pressure-volume curve is greatly modified by recruitment. A mathematical model of ARDS lungs. Am J Respir Crit Care Med. 1998;158:194–202. doi: 10.1164/ajrccm.158.1.9708049. [DOI] [PubMed] [Google Scholar]
- 39.Suki B, et al. Nonlinearity and harmonic distortion of dog lungs measured by low-frequency forced oscillations. J Appl Physiol. 1991;71:69–75. doi: 10.1152/jappl.1991.71.1.69. [DOI] [PubMed] [Google Scholar]
- 40.Suki B. Nonlinear phenomena in respiratory mechanical measurements. J Appl Physiol. 1993;74:2574–2584. doi: 10.1152/jappl.1993.74.5.2574. [DOI] [PubMed] [Google Scholar]
- 41.Suki B, Lutchen KR. Pseudorandom signals to estimate apparent transfer and coherence functions of nonlinear systems: applications to respiratory mechanics. IEEE Trans Biomed Eng. 1992;39:1142–1151. doi: 10.1109/10.168693. [DOI] [PubMed] [Google Scholar]
- 42.Allen G, et al. Transient mechanical benefits of a deep inflation in the injured mouse lung. J Appl Physiol. 2002;93:1709–1715. doi: 10.1152/japplphysiol.00473.2002. [DOI] [PubMed] [Google Scholar]
- 43.Crotti S, et al. Recruitment and derecruitment during acute respiratory failure: a clinical study. Am J Respir Crit Care Med. 2001 Jul;164:131–40. doi: 10.1164/ajrccm.164.1.2007011. [DOI] [PubMed] [Google Scholar]
- 44.Lutchen KR, et al. Low-frequency respiratory mechanics using ventilator-driven forced oscillations. J Appl Physiol. 1993;75:2549–2560. doi: 10.1152/jappl.1993.75.6.2549. [DOI] [PubMed] [Google Scholar]
- 45.Barnas GM, et al. Influence of waveform and analysis technique on lung and chest wall properties. Respir Physiol. 1994;96:331–344. doi: 10.1016/0034-5687(94)90137-6. [DOI] [PubMed] [Google Scholar]
- 46.Tawhai MH, et al. The lung physiome: merging imaging-based measures with predictive computational models. Wiley Interdiscip Rev Syst Biol Med. 2009;1:61–72. doi: 10.1002/wsbm.17. [DOI] [PMC free article] [PubMed] [Google Scholar]


