

Abstract
Purpose
We sought a human blood T2-oximetery calibration curve over the wide range of hematocrits commonly found in anemic patients applicable with T2 Relaxation Under Spin Tagging (TRUST).
Methods
Blood was drawn from 5 healthy control subjects. Ninety-three in vitro blood transverse relaxation (T2b) measurements were performed at 37° C over a broad range of hematocrits (10–55%) and oxygen saturations (14–100%) at 3T. In vivo TRUST was performed on 35 healthy African American control subjects and 11 patients with chronic anemia syndromes.
Results
1/T2 rose linearly with hematocrit (r2 = 0.96), for fully saturated blood. Upon desaturation, 1/T2 rose linearly with the square of the oxygen extraction, (1−Y)2, and the slope was linearly proportional to hematocrit (r2= 0.88). The resulting bilinear model between 1/T2, (1−Y)2 and hematocrit had a combined r2 of 0.96 and a coefficient of variation of 6.1%. Using the in-vivo data, the bilinear model had significantly lower bias and variability than existing calibrations, particularly for low hematocrits. In-vivo Bland Altman analysis demonstrated clinically relevant bias that was −6% (absolute saturation) for hematocrits near 30% and rose to +6% for hematocrits near 45%.
Conclusion
This work introduces a robust bilinear calibration model that should be used for MRI oximetry.
Introduction
T2 Relaxation Under Spin Tagging (TRUST) MRI has emerged as a reliable and robust method for the non-invasive measurement of intravascular cerebral venous oxygen saturation1,2. By magnetically labeling and isolating flowing spins in blood, TRUST avoids extraneous tissue partial volume effects and provides a quick and reproducible measure of the transverse relaxation time of blood, T2b2–4.
Critical to TRUST and similar intravascular T2b oximetry methods is the use of empirically derived calibration curves that covert T2b into oxygen saturation. Wright et al was the first to devise a human blood T2b calibration model by using a Luz Meiboom exchange model to describe oxygenation dependent spin-spin proton dephasing in blood5. Since then several groups have simplified that early model, included the influence of hematocrit and have studied T2b dynamics over a wide range of magnetic field strengths6–12. Continuing along those lines, the aim of this study was to further improve upon these foundational works by describing T2b in hematocrits commonly found in thalassemia, sickle cell and other chronic anemia syndromes and reconciling some of the disparities observed between previously published empirical blood calibration studies across species13–15.
Theory
Fundamentally, the oxygen carrying protein in blood, hemoglobin, is diamagnetic in the oxygen bound state, oxyhemoglobin, and paramagnetic in the unbound oxygen state, deoxyhemoglobin. The distinct magnetic susceptibility of these species produces local microscopic magnetic field inhomogeneities directly proportional to the oxygenation state of blood. As water protons move near these inhomogeneities, non-refocusable dephasing leads to T2 shortening. Two theoretical constructs have been proposed to describe the biophysical spin behavior in a static magnetic environment, the fast exchange model16 and the diffusion model17–19. Although supporting data for both theories have been published, neither model perfectly describes observed transverse relaxation. Fortunately, T2b calibration models are primarily focused on the practical model that can be used to convert T2b into oxygen saturation. In this way, complex biophysical modeling of elusive microscopic red cell behavior is avoided for simple empirical coefficients. One of the earliest, most simple empirical equations used to model T2b relaxation was first proposed by Wright5:
| [1] |
where T2bo is the T2 of fully oxygenated blood, Y is fractional blood oxygen saturation and K is a pulse sequence dependent, lumped constant. Several groups have extended this model in the form of:
| [2] |
where A, B and C are empirically determined constants.
The most widely used T2b oximetry calibration model at 3T was proposed by Lu et al14 and introduced a hemoglobin dependence, breaking equation [1] into the following sub equations:
| [3] |
where a1, a2, a3, b1,b2 and c1 are empirically determined coefficients14. Empirical T2b calibration models were determined separately for both bovine blood and neonatal, infant cord blood15 using this method. Overall the resulting T2b calibration models were very similar however subtle differences were observed particularly at the high oxygen saturation levels. In light of these discrepancy we acquired blood in healthy human adults and introduce a novel T2 oximetry calibration model based on our empirical data.
Methods
In Vitro: All studies were performed at Children’s Hospital Los Angeles. The study was approved by the Committee on Clinical Investigation (CCI#1200095) and informed consent was obtained from all subjects. Blood from five healthy human control subjects was studied (2 female, 35.4 ± 11.0 years old). Thirty milliliters of blood was drawn from the antecubital vein into heparinized vacuum tubes and stored at 4°C until analysis. Each study was conducted within 12 hours of phlebotomy. Oxygen saturation, hemoglobin, methemoglobin and carboxyhemoglobin were measured using a bench top co-oximeter (Radiometer, OSM3, Copenhagen, Denmark). Co-oximetry measurements were cross validated against a handheld point of care blood gas analyzer (Alere, Epoc, Waltham, USA) to insure that pH was controlled within a physiologic range (pH 7.30±0.04). Specimen hematocrit was adjusted by recombining packed red cells or plasma and confirmed by spun microhematocrit.
MRI scans were performed on a 3T Achieva Philips Healthcare (Best, Netherlands) scanner with an eight channel phase array head coil. A custom blood imaging phantom was constructed consisting of a sealable, plastic reservoir encased within a heated water jacket. Water jacket temperature was controlled via connection to a continuously circulating, PID controlled waterbath outside the magnet room. Blood was injected and removed from jacketed reservoir by way of a stopcock and syringe. Blood temperature was measured directly and allowed to equilibrate at 37° C before imaging. Blood within the reservoir was agitated by repeatedly aspirating and reinjecting into the chamber prior to every scan to minimize blood sedimentation (supporting figures).
T2 relaxation was measured with a widely used TRUST sequence1, slightly modified for in vitro imaging. The pulse sequence is outlined in Figure 1. For in vitro experiments arterial spin labeling was disabled because blood was not flowing. Head to head comparison with and without ASL enabled demonstrated no statistical difference in T2 estimation (−1.2%±5.1%). T2 weighting was applied by using a Carr Purcell Meiboom Gill (CPMG) T2 preparation (T2 Prep) module with phase cycled MLEV composite refocusing hard pulses (90° 180° 90°). The number of refocusing pulses were varied successively to achieve effective echo times of 0 40 80 and 160ms. Effective echo time weighting was performed with two different interecho spacing times, τcpmg,10 ms and 20 ms corresponding to 0,4,8 and 16 inversion pulses and 0, 2, 4 and 8 inversion pulses. The nonselective pulses in the T2 preparation module were order to acquire effective echo times of 0, 40, 80 and 160ms in an interleaved manner. This allowed T2 to be generated every 12 repetition times (26 seconds) to capture rapid trends in T2. Six T2 values were generated for each acquisition. Linear regression was used to fit T2 drift during each acquisition and extrapolated to obtain an estimated T2b at the time of blood agitation (30 seconds prior to imaging). Additional parameters included a repetition time of 1978 ms, field of view of 110 cm, slice thickness of 5mm, and inplane resolution of 1.7 by 1.7 mm. To reduce air susceptibility artifact, a three shot acquisition, using an echoplanar factor of 11 and sense factor of two was used instead of a single shot acquisition.
Figure 1.

Modified TRUST pulse sequence used for T2b oximetry calibration. The sequence consists of a TILT labeling pulse followed, by a Carr Pucell Meiboom Gill T2 preparation module and Echo Planar Imaging readout. Experiments were performed with two distinct T2 prep modules, with an interecho spacing, τcpmg, of 10 ms and other 20 ms. Radiofrequency spoiling and gradient crushing following Gz crusher was performed in Gx and Gy (not shown for visual simplicity). For in vitro imaging, the label was turned off to shorten scan time. T2b estimates with and without TILT label were not statistically different.
Following imaging, blood was removed from jacketed reservoir and deoxygenated in a temperature controlled gas chamber using a membrane oxygenator(Living System Instrumentation, Burlington, VT, USA). A gas mixture of 5% CO2 and 95% N2 was used for deoxygenation to maintain a physiologic pH during deoxygenation. Blood was returned to reservoir, sealed, saturation was measured on a hemoximeter and imaging was repeated. Blood saturation and temperature was measured again following imaging for stability assessment. Deoxygenation and imaging was repeated several times at various saturation levels. Hematocrit was adjusted by the addition of red cells or plasma. The sample was reoxygenated within temperature controlled gas chamber and membrane oxygenator using a 5% CO2, 20% O2 and 75% N2 gas mixture. Blood sample deoxygenation and imaging was repeated.
MATLAB (Mathworks, Natick, MA) scripts were written for data analysis. Manual regions of interest were drawn within the blood pool and fit to a monexponential using a Levenburg-Marquadt algorithm. Since arterial spin labeling was disabled, there was no need to adjust for blood T1. Data at each hematocrit were fit to equation 2 using a linear least squares method.
Three separate empirical calibration models were used to convert the measured T2b into derived oxygen saturation. These models include the bovine and neonatal empirical models outlined above and a human bilinear model outlined below.
In vivo studies were performed at Children’s Hospital Los Angeles on the same imaging platform and coil as the in vitro studies. The study was approved by the Committee on Clinical Investigation (CCI#11–00083). All patients provided informed consent or assent. Thirty-three healthy, African American control subjects and 11 healthy patients with chronic hemolytic anemia including thalassemia major (N=10) and dyserythropoietic anemia (N=1) were studied. Patients underwent vital signs measurement and phlebotomy. Complete blood count, reticulocytes, quantitative hemoglobin electrophoresis, and cell free hemoglobin levels were analyzed in the clinical laboratory. T2 relaxation of the sagittal sinus was measured using a TRUST sequence with parameters detailed in the in vitro experiments. Blood labeling was performed using transfer insensitive labeling technique (TILT)20 with a label delay time of 1022ms. The average of pairwise subtraction was taken to obtain the isolated blood signal difference (ΔSignal). The difference signal is proportional to the T1 and T2 decay of blood during the CMPG pulse module, described by the equation, ΔSignal=SignaloeTE*C, where C = R1b–R2b and Signalo is constant across effective TEs1. Patient specific T1 was corrected for using the Liu et al. calibration equation15, with the measured hematocrit and a presumed 60% saturation. Monoexponential fitting was used to derive C and T2b. Peripheral arterial saturation was measured continuously throughout the study using a MRI compatible pulse oximeter (Nonin, Plymouth, MN, USA) and data acquisition system (BIOPAC, Goleta, CA, USA).
Results
A total of 93 T2 measurements were performed at a τcmpg of ten milliseconds and 54 T2 measurements were collected at a τcmpg of twenty milliseconds. Figure 2 demonstrates a tight linear relationship (r2 = 0.956) between R2 and hematocrit for fully saturated blood (saturation greater than 98%). R2 was also linearly proportional to the square of oxygen extraction,(1−Y)2, with r-squared values averaging 0.970 ± .045(Figure 3a). However, the slope of this relationship (the empiric constant ‘K’ from equation 1) increased linearly with hematocrit, with an r2 of 0.877 (Figure 3b).
Figure 2.

R2 dependence on hematocrit for fully oxygenated blood. Tight linear fit (r2=0.956) was observed across 5 healthy hemoglobin AA subjects. Shapes correspond to separate subjects.
Figure 3.
Hemoglobin saturation influence on R2. Left panel demonstrates linear dependence of R2 on the squared oxygen extraction, (1−Y)2, for five different hematocrit values. The slope of this relationship, K, was linearly proportional to hematocrit (right panel).
Based on these observations, we modified the Wright5 model in equation 1 to include terms describing the linear HCT dependence of fully saturated blood, and a linear term reflecting the linear relationship between K and HCT. The resulting human blood bilinear transverse relaxation model was formed:
| [4] |
where (1–Y)2 is the squared oxygen extraction, Hct is the fractional hematocrit and A1, A2, A3 and A4 are empirically determined constants. Figure 5a demonstrates the hyperplane fit to the bilinear model, illustrating the excellent agreement across the entire range of hematocrits and squared oxygen extractions. Model coefficients were A1=77.5, A2=27.8, A3=6.95, A4=2.34 for a τcmpg of 10ms and were A1=167, A2=20.8, A3=10.3, A4=2.15 for τcmpg of 20ms using [4] and the measured blood saturation and hematocrit. The overall model r2 was 0.962; prediction error grew with measured R2 value and was best described by a coefficient of variation (6.5%), with 95% confidence intervals of ± 12.7%. The bilinear model residual was regressed against additional variable used with previous models including HCT2,HCT*(1−Y), and (1−Y) with no improved model accuracy.
Figure 5.

Human bilinear model comparison with existing bovine and neonatal hemoglobin calibrations. Top and bottom panels correspond to model accuracy at hematocrits above and below 30%, respectively. The left and right panels correspond to predicted R2 and saturation respectively. At hematocrits above 30% the three models are unbiased, although the bovine model has greater scatter. However, at hematocrits below 30% the bovine and neonatal empirical relaxation models underestimate oxygen saturation and demonstrate unacceptable variance.
This calibration compares favorably with the existing transverse relaxation models using bovine blood and neonatal cord blood14,15. Figure 5 (left) (compares the bilinear, bovine and neonatal calibrations. Separate comparisons are shown for hematocrit greater and less than 30% respectively.
Figure 5 (right) demonstrates the oxygen saturation predicted by TRUST with the oxygen saturations measured by the co-oximeter for all three models. Table 1 summarizes error statistics across the models for both R2 and oximetry estimates. The human bilinear calibration and the calibration from neonatal blood are unbiased and have equivalent accuracy for hematocrits greater than 30%, but the bilinear calibration is much more robust for hematocrits less than 30%. Both human models markedly outperform predictions from the bovine model at all hematocrits. The 95% confidence intervals for noninvasive oximetry can easily be derived from Table 1. For hematocrits greater than 30% they are ± 5.7% (bilinear, neonatal) and ± 9.2% (bovine) respectively. For anemic patients, the uncertainty increases to ± 8.1% (bilinear), ± 16% (neonatal) and ± 27.4% (bovine) respectively; units are in absolute saturation differences.
Table 1.
Error statistics of measured vs predicted R2 and O2 saturation. The bilinear and neonatal models predict O2 saturation similarly well with comparable standard deviation and mean squared error at hematocrits above 30%. The bovine model demonstrates a slight bias in O2 saturation and has 50% larger confidence intervals compared with the other two calibrations. At hematocrits below 30% both the bovine and neonatal models have large negative bias and considerable variance in model predictions. The proposed bilinear model maintains accuracy across this range.
| R2 Relaxation (1/s) | O2 Saturation (%) | ||||||
|---|---|---|---|---|---|---|---|
| Mean Error | Standard Deviation | Mean Squared Error | Mean Error | Standard Deviation | Mean Squared Error | ||
| Human | −0.165 | 0.975 | 0.958 | 0.037 | 2.86 | 8.00 | |
| Hematocrit ≥ 30% | Bovine | 0.522 | 1.26 | 1.83 | 1.78 | 4.56 | 23.5 |
| Neonatal | 0.146 | 0.984 | 0.968 | 0.537 | 2.84 | 8.19 | |
| Human | 0.153 | 1.64 | 2.68 | 0.424 | 4.40 | 19.1 | |
| Hematocrit < 30% | Bovine | −6.01 | 3.91 | 51.1 | −24.0 | 13.7 | 759 |
| Neonatal | −1.92 | 2.58 | 10.2 | −9.93 | 8.069 | 162 | |
In vivo TRUST measurements are summarized in Figure 6. The mean hematocrit was 39.8 ± 3.6% in healthy control subjects and 29.7 ± 2.0% in anemic patients. The mean derived venous saturation in healthy controls was 61 ± 6%, 64 ± 6% and 62 ± 6% using the human bilinear, bovine and neonatal empirical models respectively. The mean venous saturation in anemic patients was 71 ± 6%, 69 ± 5% and 71 ± 5% using the human bilinear, bovine and neonatal empirical models respectively (Figure 6). The bovine and neonatal models overestimated predicted saturations made by the bilinear model at high hematocrits and underestimated at low hematocrits (Figure 6). The bias was much worse for the bovine model, ranging from −6% to 6% (absolute saturation differences), while it ranged from −1% to +3% for the neonatal model.
Figure 6.

Bland-Altman analysis of in- vivo TRUST measurements. Left panel is oxygen saturation measured in healthy controls and anemic patients using human bilinear, bovine and neonatal models. The saturation in healthy controls was 60.6 ± 6.3%, 63.8 ± 6.7% and 62.4 ± 6.2% using the human bilinear, bovine and neonatal empirical models respectively. The mean saturation in anemic patients was 69.8 ± 6.0%, 68.2 ± 4.8% and 70.1 ± 5.3%, respectively. There was a statistical difference between healthy controls and anemic patients (P<.05), using all models. The right panel depicts the difference between the human bilinear model and the bovine and neonatal models with respect to hematocrit. There is a positive saturation bias introduced by both models at higher hematocrits and a negative saturation bias at low hematocrits. The neonatal model performance is more similar to the human bilinear model than the bovine model.
Discussion
This study is the first to validate T2b oximetry measurements in adult human blood over a broad range of saturations and hemoglobin concentrations in multiple individuals. We demonstrate that more than 96% of the variability in blood R2 can be described by a bilinear model using hematocrit and the squared oxygen extraction, even with hematocrit values into the teens. We further demonstrate that existing T2b calibrations are highly inaccurate for hematocrits below 30% and should not be used in anemic patient populations21. In fact, the commonly used bovine calibration has sizable bias even for patients with normal hematocrit values. Lastly, we are the first to derive realistic 95% confidence intervals for T2b oximetry calibration curves (Table 1) and demonstrate that the bilinear model is fundamentally more accurate than existing calibrations, with 2–3 fold tighter confidence intervals at hematocrits <30%.
Despite the severe disagreement observed at lower hematocrits, our data showed considerable overlap with existing literature at higher hematocrits, increasing the overall confidence in the both T2b oximetry calibration and TRUST. We replicated the linear relationship between R2 and hematocrit in fully saturated blood that has been previously described5. R2 was highly linear with the square of oxygen extraction, (1−Y)2 5,13. The slope of this relationship, K, was proportional to hematocrit. Most importantly, our calibration was unbiased with respect to both the bovine and neonatal blood TRUST calibration for hematocrits greater than 30%14,15. This implies that mean oximetry values and cerebral metabolic rates previously published using these calibrations are reasonably accurate, despite errors in individual values.
Furthermore, the bilinear model facilitates a robust fit that can be generalized to most clinical situations. The bovine calibration was derived over a 35–55% hematocrit range. The neonatal calibration was derived over a broader hematocrit range (25%–52%) however there were very few samples at the lower hematocrits. Patients with chronic anemia often have hematocrits in the low twenties22,23. Existing empirical models extrapolate poorly to this hematocrit range because they are highly nonlinear and have six degrees of freedom making them vulnerable to overfitting14. This precludes their use in anemic populations and also suggests that the underlying physical model assumptions may be incorrect. Not only did the proposed bilinear model fit hematocrits well below 30%, but it also outperformed the bovine model in the hematocrit range for which it was optimized (35%–55%).
Interestingly, our current results agree more closely with data from human cord blood than the bovine calibration. Lu and colleagues, noting differences between the neonatal and bovine calibrations, speculated that neonatal and adult blood were magnetically distinct15. The present work suggest an alternative hypothesis, namely that bovine blood is an imperfect surrogate for human blood. Several previous studies have implied that bovine blood is magnetically indistinguishable from human blood7,13,14,24. Although diffusion characteristics of bovine blood may be similar to human blood,25 bovine red blood cells have a mean corpuscular volume that is half that of human blood cell26, have a slower sedimentation rate27 and do not aggregate28. All of these effects modify the length-scale of magnetic inhomogeneities that diffusing water protons encounter prior to echo formation17, potentially contributing to T2b differences in cows and humans. Previous calibration studies using bovine blood did not observe significant T2 drift or sedimentation over a six minute interval, in marked contrast to the present study, further emphasizing differences between bovine and human blood9. The Bland-Altman comparisons (Figure 6) demonstrate anticipated differences in oxygen saturation using the three models. Although the overall bias is modest, the human - bovine model bias systematically rises more than twelve absolute percentage points from a hematocrit of 25–40%. In contrast, the human model and neonatal model bias rises only four percentage points over the same range; a difference that could easily be explained by a model mismatch, rather than fundamental magnetic differences in neonatal and adult human blood.
The measurement of human blood in vitro under physiologic conditions was challenging. Temperature and pH need to be carefully controlled. While macroscopic blood sedimentation could be controlled by imaging quickly, red cell aggregation begins within seconds after agitation. The rapid T2 increases were consistent with the time courses found in red cell aggregation and rouleaux formation29. A flowing system could potentially reduce these effects, but would not eliminate T2 drift unless the flow was fairly vigorous. Furthermore, flowing systems require unacceptably high blood volumes and are vulnerable to flow artifacts during image acquisition. In vivo, blood enters the sagittal sinus within seconds following complete disaggregation in the capillary vasculature. We chose to address aggregation and sedimentation by agitating the blood sample immediately preceding image acquisition, using a longitudinal imaging plane that conserved average hematocrit (in contrast to a plane to the tube) and correcting T2 drift by linear extrapolation (supporting figure S2).
Despite a closed system, there remained a small residual air volume in the upper portion of imaging phantom that produced local susceptibility gradients in the blood pool. These gradients may have caused us to slightly underestimate the true T2b in vitro. We minimized the influence of this effect by reducing the EPI factor and manually avoiding these regions during segmentation. We were unable to demonstrate any T2 gradient between the top and the bottom of the ROI, with an average difference equal to 0.5%± 5.1%
Other in vitro confounders include red cell ex vivo age, pH, carboxyhemoglobin level and temperature. Red cell integrity and metabolic status are well preserved over twelve hours of storage in refrigerated conditions. Blood pH was maintained in the physiological range for venous samples by including 5% CO2 in both the oxygenating and deoxygenating gases. Temperature was tightly controlled at 37° C by heating the gases and the imaging chamber. Alterations in any of these parameters can influence red cell shape, permeability and or oxygen dissociation30.
Despite the excellent empirical performance of the bilinear model, this study has several limitations. Firstly, the coefficients introduced by this work are specific to the T2 preparation module and readout used in the aforementioned methods. The precise manner in which T2 weighting is applied and data is readout will change the relative influences of T2*, contributing directly to pulse sequence specific model coefficients. In light of this fact, we used the most commonly reported TRUST sequence with and without blood tagging. Furthermore, we insured that the readout in our in vitro calibration curve generation matched the readout of the TRUST measurements performed in patients. Despite, limited applicability of the exact coefficients proposed in this work, the precision of this model suggest the underlying T2b bilinear model structure will have utility in future works. Secondly, this study only examined the relaxation characteristics of subjects with AA hemoglobin. It remains possible that other hemoglobin variants, HgbS HgbF, HgbE etc have unique relaxation model coefficients and even model structures. Thirdly, we are presenting an in vitro calibration model that can be used predict in vivo saturation. This work does not address the absolute accuracy of TRUST measurements but rather the resulting bias arising from improper T2b oximetry calibrations (Figure 6). In vivo measurements should be rigorously compare against a clinical gold standard. Despite controlling for several important physiological blood parameters including pH, temperature and aggregation, it remains possible that additional confounders including B1 inhomogeneity and eddy current formation could cause disparities between in vivo and in vitro measurement conditions. Fourthly, repeated aspiration and circulation of blood produced some sample hemolysis which will elongate T2b relaxation18. We minimized hemolysis by limiting studies to three cycles through the membrane oxygenator and randomized the order that different hematocrits (lower or higher) were studied. Next, we cannot exclude nonlinear dependencies of R2 on hematocrit and saturation even though we were unable to observe them in the present study. Lastly, this study makes no attempt to resolve the biophysical origin of the R2 in whole blood. Future research should interrogate the theoretical and empirical effects of corpuscular volume, red cell aggregation and rouleaux formation effects on transverse relaxation properties because these physical phenomena will cast insights into the relative merits of Luz Meiboom and diffusion models of red cell relaxation.
Conclusion
This work introduces an empirical bilinear model of transverse relaxation of human blood. This model has superior statistical performance over existing empirical models utilizing bovine and cord blood over a wider range of hematocrits. This bilinear model should supplant existing calibration curve models for TRUST oximetry. This framework is also relevant to several other T2 based oximetry approaches including TRUPC31, QUIXOTIC32 and VSEAN33, although the coefficients could vary with technique.
Supplementary Material
Supporting Figure S1) Representative TRUST blood images during a single elongated modified TRUST series. Separate effective echo times and imaging start times are depicted on the vertical and the horizontal axes, respectively. There is an appreciable air susceptibility artifact in the upper portion of the blood phantom and thus regions of interest, depicted by the orange polygon, were drawn to avoid these areas. No blood sedimentation was observed within the first two minutes but obvious separation was present at longer time scales.
Supporting Figure S2) Graph demonstrates the change in T2b values as a function of time. There was a nonlinear increase in T2 across the series. The T2 drift was oxygenation and hematocrit dependent and required more than 15 minutes to reach equilibrium. Supporting Figure 2b shows the T2 drift associated with the standard six dynamic TRUST sequence used in the calibration experiments. Linear regression was used to fit the T2 drift over the first 160 seconds and extrapolation was used to derive T2b at the time of agitation, which occurred 30 seconds prior to initiating image acquisition (Figure2b, blue cross). The extrapolated T2b was 11.3 ±13.4% shorter than the T2b calculated by averaging all six dynamics.
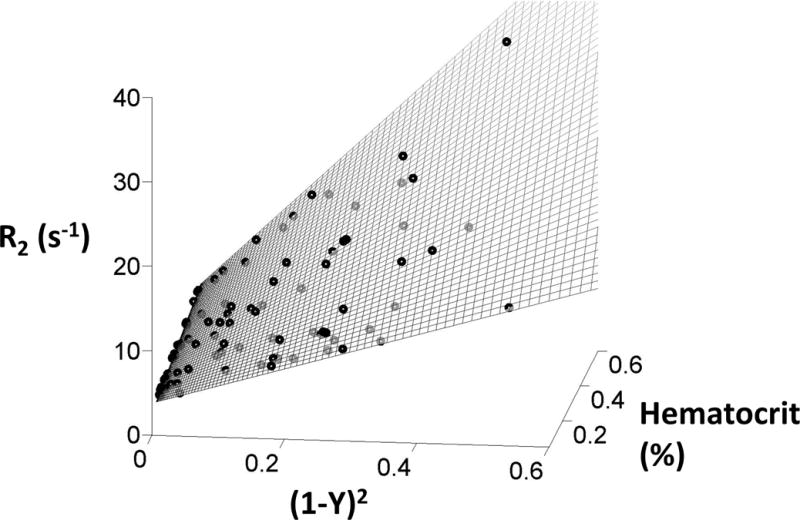
Figure 4.

Hyperplane resulting from the bilinear model fit of the experimental data. R2 is plotted with respect to the squared oxygen extraction, (1−Y)2 and hematocrit. The experimental data are displayed as black circles and the bilinear model is represented by the mesh.
Acknowledgments
Authors would like to thank Hanzhang Lu for the generous release of the research patch and pulse sequence, Jon Chia of Philips Healthcare for research support, Ana Munoz and Anne Nord for patient recruitment and administrative assistance and all the research subjects, patients and families that partook in this research. This work was supported by the NHLBI of the NIH (1U01HL117718-01). Adam Bush is sponsored through a NHLBI minority supplement (1U01HL117718-01).
References
- 1.Lu H, Ge Y. Quantitative evaluation of oxygenation in venous vessels using T2-Relaxation-Under-Spin-Tagging MRI. Magn Reson Med. 2008;60(2):357–363. doi: 10.1002/mrm.21627. [DOI] [PMC free article] [PubMed] [Google Scholar]
- 2.Liu P, Dimitrov I, Andrews T, et al. Multisite evaluations of a T2 -relaxation-under-spin-tagging (TRUST) MRI technique to measure brain oxygenation. Magn Reson Med. 2016;75(2):680–687. doi: 10.1002/mrm.25627. [DOI] [PMC free article] [PubMed] [Google Scholar]
- 3.Xu F, Ge Y, Lu H. Noninvasive quantification of whole-brain cerebral metabolic rate of oxygen (CMRO2) by MRI. Magn Reson Med. 2009;62(1):141–148. doi: 10.1002/mrm.21994. [DOI] [PMC free article] [PubMed] [Google Scholar]
- 4.Liu P, Xu F, Lu H. Test-retest reproducibility of a rapid method to measure brain oxygen metabolism. Magn Reson Med. 2013;69(3):675–681. doi: 10.1002/mrm.24295. [DOI] [PMC free article] [PubMed] [Google Scholar]
- 5.Wright GA, Hu BS, Macovski A. 1991 I.I. Rabi Award. Estimating oxygen saturation of blood in vivo with MR imaging at 1.5 T. J Magn Reson Imaging. 1991;1(3):275–283. doi: 10.1002/jmri.1880010303. [DOI] [PubMed] [Google Scholar]
- 6.Lin AL, Qin Q, Zhao X, Duong TQ. Blood longitudinal (T1) and transverse (T2) relaxation time constants at 11.7 Tesla. MAGMA. 2012;25(3):245–249. doi: 10.1007/s10334-011-0287-2. [DOI] [PMC free article] [PubMed] [Google Scholar]
- 7.Golay X, Silvennoinen MJ, Zhou J, et al. Measurement of tissue oxygen extraction ratios from venous blood T(2): increased precision and validation of principle. Magn Reson Med. 2001;46(2):282–291. doi: 10.1002/mrm.1189. [DOI] [PubMed] [Google Scholar]
- 8.Silvennoinen MJ, Clingman CS, Golay X, Kauppinen RA, van Zijl PC. Comparison of the dependence of blood R2 and R2* on oxygen saturation at 1.5 and 4.7 Tesla. Magn Reson Med. 2003;49(1):47–60. doi: 10.1002/mrm.10355. [DOI] [PubMed] [Google Scholar]
- 9.Krishnamurthy LC, USA UoTSMCAIRCDT, USA UoTaADoBEAT et al. Dependence of blood T2 on oxygenation at 7 T: In vitro calibration and in vivo application. Magnetic Resonance in Medicine. 2016;71(6):2035–2042. doi: 10.1002/mrm.24868. [DOI] [PMC free article] [PubMed] [Google Scholar]
- 10.Stefanovic B, Pike GB. Human whole-blood relaxometry at 1.5 T: Assessment of diffusion and exchange models. Magn Reson Med. 2004;52(4):716–723. doi: 10.1002/mrm.20218. [DOI] [PubMed] [Google Scholar]
- 11.Chen JJ, Pike GB. Human whole blood T2 relaxometry at 3 Tesla. Magn Reson Med. 2009;61(2):249–254. doi: 10.1002/mrm.21858. [DOI] [PubMed] [Google Scholar]
- 12.Spees WM, Department of Radiology WU, St. Louis, Missouri. Yablonskiy DA, et al. Water proton MR properties of human blood at 1.5 Tesla: Magnetic susceptibility, T1, T2, T *2, and non-Lorentzian signal behavior. Magnetic Resonance in Medicine. 2016;45(4):533–542. doi: 10.1002/mrm.1072. [DOI] [PubMed] [Google Scholar]
- 13.Zhao JM, Clingman CS, Narvainen MJ, Kauppinen RA, van Zijl PC. Oxygenation and hematocrit dependence of transverse relaxation rates of blood at 3T. Magn Reson Med. 2007;58(3):592–597. doi: 10.1002/mrm.21342. [DOI] [PubMed] [Google Scholar]
- 14.Lu H, Xu F, Grgac K, Liu P, Qin Q, van Zijl P. Calibration and validation of TRUST MRI for the estimation of cerebral blood oxygenation. Magn Reson Med. 2012;67(1):42–49. doi: 10.1002/mrm.22970. [DOI] [PMC free article] [PubMed] [Google Scholar]
- 15.Liu P, Chalak LF, Krishnamurthy LC, et al. T1 and T2 values of human neonatal blood at 3 Tesla: Dependence on hematocrit, oxygenation, and temperature. Magn Reson Med. 2015 doi: 10.1002/mrm.25775. [DOI] [PMC free article] [PubMed] [Google Scholar]
- 16.Luz Z, Meiboom S. Nuclear Magnetic Resonance Study of the Protolysis of Trimethylammonium Ion in Aqueous Solution—Order of the Reaction with Respect to Solvent. 2004 [Google Scholar]
- 17.Jensen JH, Chandra R. NMR relaxation in tissues with weak magnetic inhomogeneities. Magn Reson Med. 2000;44(1):144–156. [PubMed] [Google Scholar]
- 18.Thulborn KR, Waterton JC, Matthews PM, Radda GK. Oxygenation dependence of the transverse relaxation time of water protons in whole blood at high field. Biochim Biophys Acta. 1982;714(2):265–270. doi: 10.1016/0304-4165(82)90333-6. [DOI] [PubMed] [Google Scholar]
- 19.Kiselev VG, Institute of Medicine RCJG, D-52425 Jülich, Germany, Institute of Physics SA, 220602 Minsk, Byelorussia. Posse S, Institute of Medicine RCJG, D-52425 Jülich, Germany Analytical Theory of Susceptibility Induced NMR Signal Dephasing in a Cerebrovascular Network. Physical Review Letters. 1998;81(25):5696. [Google Scholar]
- 20.Golay X, Stuber M, Pruessmann KP, Meier D, Boesiger P. Transfer insensitive labeling technique (TILT): application to multislice functional perfusion imaging. J Magn Reson Imaging. 1999;9(3):454–461. doi: 10.1002/(sici)1522-2586(199903)9:3<454::aid-jmri14>3.0.co;2-b. [DOI] [PubMed] [Google Scholar]
- 21.Jordan LC, Gindville MC, Scott AO, et al. Non-invasive imaging of oxygen extraction fraction in adults with sickle cell anaemia. Brain. 2016 doi: 10.1093/brain/awv397. [DOI] [PMC free article] [PubMed] [Google Scholar]
- 22.Detterich JA, Sangkatumvong S, Kato R, et al. Patients with sickle cell anemia on simple chronic transfusion protocol show sex differences for hemodynamic and hematologic responses to transfusion. Transfusion. 2013;53(5):1059–1068. doi: 10.1111/j.1537-2995.2012.03961.x. [DOI] [PMC free article] [PubMed] [Google Scholar]
- 23.Detterich JA, Kato RM, Rabai M, Meiselman HJ, Coates TD, Wood JC. Chronic transfusion therapy improves but does not normalize systemic and pulmonary vasculopathy in sickle cell disease. Blood. 2015;126(6):703–710. doi: 10.1182/blood-2014-12-614370. [DOI] [PMC free article] [PubMed] [Google Scholar]
- 24.Lu H, Clingman C, Golay X, van Zijl PC. Determining the longitudinal relaxation time (T1) of blood at 3.0 Tesla. Magn Reson Med. 2004;52(3):679–682. doi: 10.1002/mrm.20178. [DOI] [PubMed] [Google Scholar]
- 25.Benga G, Borza T. Diffusional water permeability of mammalian red blood cells. Comp Biochem Physiol B Biochem Mol Biol. 1995;112(4):653–659. doi: 10.1016/0305-0491(95)00116-6. [DOI] [PubMed] [Google Scholar]
- 26.Comparative Study of Hematological Parameters According Strain, Age, Sex, Physiological Status and Season in Iranian Cattle. 2016 [Google Scholar]
- 27.Popel AS, Johnson PC, Kameneva MV, Wild MA. Capacity for red blood cell aggregation is higher in athletic mammalian species than in sedentary species. J Appl Physiol (1985) 1994;77(4):1790–1794. doi: 10.1152/jappl.1994.77.4.1790. [DOI] [PubMed] [Google Scholar]
- 28.Baumler H, Neu B, Mitlohner R, Georgieva R, Meiselman HJ, Kiesewetter H. Electrophoretic and aggregation behavior of bovine, horse and human red blood cells in plasma and in polymer solutions. Biorheology. 2001;38(1):39–51. [PubMed] [Google Scholar]
- 29.Barshtein G, Wajnblum D, Yedgar S. Kinetics of linear rouleaux formation studied by visual monitoring of red cell dynamic organization. Biophys J. 2000;78(5):2470–2474. doi: 10.1016/S0006-3495(00)76791-9. [DOI] [PMC free article] [PubMed] [Google Scholar]
- 30.Jensen FB, Institute of Biology UoSD, Odense, Denmark Red blood cell pH, the Bohr effect, and other oxygenation-linked phenomena in blood O2 and CO2 transport. Acta Physiologica Scandinavica. 2016;182(3):215–227. doi: 10.1111/j.1365-201X.2004.01361.x. [DOI] [PubMed] [Google Scholar]
- 31.Krishnamurthy LC, USA UoTSMCAIRCDT, USA UoTaADoBEAT et al. Vessel-specific quantification of blood oxygenation with T2-relaxation-under-phase-contrast MRI. Magnetic Resonance in Medicine. 2016;71(3):978–989. doi: 10.1002/mrm.24750. [DOI] [PMC free article] [PubMed] [Google Scholar]
- 32.Bolar DS, Rosen BR, Sorensen AG, Adalsteinsson E. QUantitative Imaging of eXtraction of oxygen and TIssue consumption (QUIXOTIC) using venular-targeted velocity-selective spin labeling. Magn Reson Med. 2011;66(6):1550–1562. doi: 10.1002/mrm.22946. [DOI] [PMC free article] [PubMed] [Google Scholar]
- 33.Guo J, Department of Bioengineering UoC, San Diego, La Jolla, California, USA. Wong EC, Department of Radiology UoC, San Diego, La Jolla, California, USA, Department of Psychiatry UoC, San Diego, La Jolla, California, USA Venous oxygenation mapping using velocity-selective excitation and arterial nulling. Magnetic Resonance in Medicine. 2016;68(5):1458–1471. doi: 10.1002/mrm.24145. [DOI] [PMC free article] [PubMed] [Google Scholar]
Associated Data
This section collects any data citations, data availability statements, or supplementary materials included in this article.
Supplementary Materials
Supporting Figure S1) Representative TRUST blood images during a single elongated modified TRUST series. Separate effective echo times and imaging start times are depicted on the vertical and the horizontal axes, respectively. There is an appreciable air susceptibility artifact in the upper portion of the blood phantom and thus regions of interest, depicted by the orange polygon, were drawn to avoid these areas. No blood sedimentation was observed within the first two minutes but obvious separation was present at longer time scales.
Supporting Figure S2) Graph demonstrates the change in T2b values as a function of time. There was a nonlinear increase in T2 across the series. The T2 drift was oxygenation and hematocrit dependent and required more than 15 minutes to reach equilibrium. Supporting Figure 2b shows the T2 drift associated with the standard six dynamic TRUST sequence used in the calibration experiments. Linear regression was used to fit the T2 drift over the first 160 seconds and extrapolation was used to derive T2b at the time of agitation, which occurred 30 seconds prior to initiating image acquisition (Figure2b, blue cross). The extrapolated T2b was 11.3 ±13.4% shorter than the T2b calculated by averaging all six dynamics.