

Abstract
There is a complex quantitative relationship between the concentrations of antibiotics and the growth and death rates of bacteria. Despite this complexity, in most cases only a single pharmacodynamic parameter, the MIC of the drug, is employed for the rational development of antibiotic treatment regimens. In this report, we use a mathematical model based on a Hill function—which we call the pharmacodynamic function and which is related to previously published Emax models—to describe the relationship between the bacterial net growth rates and the concentrations of antibiotics of five different classes: ampicillin, ciprofloxacin, tetracycline, streptomycin, and rifampin. Using Escherichia coli O18:K1:H7, we illustrate how precise estimates of the four parameters of the pharmacodynamic function can be obtained from in vitro time-kill data. We show that, in addition to their respective MICs, these antibiotics differ in the values of the other pharmacodynamic parameters. Using a computer simulation of antibiotic treatment in vivo, we demonstrate that, as a consequence of differences in pharmacodynamic parameters, such as the steepness of the Hill function and the minimum bacterial net growth rate attained at high antibiotic concentrations, there can be profound differences in the microbiological efficacy of antibiotics with identical MICs. We discuss the clinical implications and limitations of these results.
Fundamental to the rational design (35, 55) of effective antibiotic treatment protocols are accurate measures of the absorption, distribution, and decay of the drug in treated patients (pharmacokinetics) and the functional relationship between the concentration of the antibiotic and the rate of growth or death of the target bacteria (pharmacodynamics). Typically the pharmacodynamics of antibiotics are studied in vitro by exposing exponentially growing bacteria to a range of drug concentrations and monitoring the changes in density of viable cells over time and thereby generating time-kill curves (7, 9, 16, 17, 23, 25, 31, 50-52, 54, 58, 61). From these data, the growth or death rates of the bacteria at different concentrations of antibiotics can be estimated and the functional relationship between bacterial growth (or death) and the concentration of the antibiotic can thereby be determined. We refer to this relationship as the pharmacodynamic function. The pharmacodynamic function can then be used in combination with pharmacokinetic data to investigate the efficacy of antibiotic treatment. Frequently the pharmacodynamic relationship is reduced to a single parameter, the MIC (3, 14, 15, 20, 21, 27, 37, 39-41, 46, 56), even though antibiotics with the same MIC can have very different pharmacodynamic functions (1, 44).
In this study, we examined the pharmacodynamic relationship between antibiotic concentration and bacterial growth and death rates. We generated time-kill curves for Escherichia coli exposed to antibiotics of five different classes: rifampin, ampicillin, ciprofloxacin, streptomycin, and tetracycline. These time-kill curves were fitted to a pharmacodynamic model related to previously used Emax models (also referred to as Zhi models) (6, 8, 10, 13, 18, 19,24, 28, 32, 36, 42-44, 47-49, 53, 57, 59, 60). We compared estimates of the four parameters of our pharmacodynamic model across all five antibiotics. Using a mathematical model of antibiotic treatment in vivo, we demonstrate that these pharmacodynamic parameters can profoundly affect the microbiological efficacy of treatment.
MATERIALS AND METHODS
Bacteria and media.
E. coli O18:K1:H7 (which we refer to as CAB1) used here was originally isolated from a child with meningitis and was supplied by Craig A. Bloch (4, 5). Bacteria were grown in 10 ml of Luria-Bertani (LB) broth at 37°C with aeration at 200 rpm in 50-ml flasks. Total cell densities were estimated from CFU per milliliter by dilution (in 0.85% saline) and plating on LB agar. The lower level of detection of this measurement is 10 CFU/ml.
Antibiotics.
Stock solutions of the five antibiotics used were prepared as follows: 10 mg of intravenous ciprofloxacin solution (Bayer) per ml, ampicillin (Sigma) dissolved in sterile distilled water to a concentration of 25 mg/ml, rifampin (Sigma) dissolved in methanol to a concentration of 10 mg/ml, streptomycin (Sigma) dissolved in sterile distilled water to a concentration of 40 mg/ml, and tetracycline (Sigma) dissolved in 50% ethanol to a concentration of 25 mg/ml. Appropriate dilutions of the stock solutions were made in LB broth immediately before use.
MIC estimation.
The MICs of the five antibiotics for CAB1 were estimated in 96-well microtiter plates with LB broth. Approximately 105 bacteria from an overnight LB culture were put into wells with a twofold dilution series of the antibiotics ranging over the indicated concentrations: ciprofloxacin, 0.03 to 4 μg/ml; ampicillin, 0.5 to 64 μg/ml; streptomycin, 0.5 to 64 μg/ml; rifampin, 0.5 to 64 μg/ml; and tetracycline, 0.5 to 64 μg/ml. The MICs for these bacterial suspensions were determined from the well with the lowest concentration of the antibiotic that was not visibly turbid after 20 h of incubation at 37°C.
Time-kill curves.
Overnight cultures were diluted 1:10,000 into fresh, 37°C LB broth and incubated for 2 h, at which time they were growing exponentially, and then introduced into flasks containing different concentrations of the antibiotics. The cultures were incubated with aeration at 37°C. Samples were taken at 10-min intervals for 1 h. Viable cell densities in these samples were estimated from colony counts by dilution in 0.85% saline and plating on LB agar. The time-kill experiment was carried out two times.
Modeling the relationship between bacterial net growth and antibiotic concentration.
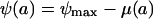
As our model of the net growth rate of the bacterial population, ψ (which can be positive or negative), exposed to an antibiotic concentration, a, we assume the following relationship:
 |
(1) |
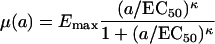
Hereby, ψmax is the growth rate of the bacterial population in the absence of antibiotics, and μ(a) is the death rate of the bacterial population exposed to an antibiotic concentration a, which we assume to be a Hill function:
 |
(2) |
Emax designates the maximum antibiotic-mediated death rate; EC50 is the antibiotic concentration at which the death rate is at half of its maximum, Emax/2; and κ denotes the Hill coefficient, which is a measure of the steepness of the sigmoid relationship between μ and a. All the rates above [ψ(a), ψmax, μ(a), and Emax] are measured as the change per hour in the logarithm of bacterial density to the base 10.
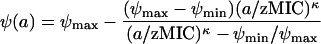
Defining the minimum net growth rate of the bacterial population at high antibiotic concentrations as ψmin = ψmax − Emax and the pharmacodynamic MIC, zMIC, by requiring ψ(zMIC) = 0, we can rewrite equation 1:
 |
(3) |
Figure 1 illustrates the contribution of these four parameters to the relationship between antibiotic concentration and bacterial growth (equation 3). Our pharmacodynamic model is related to previously published pharmacodynamic models referred to as Emax models (6, 8, 10, 13, 18, 19, 24, 28, 32, 36, 42-44, 47-49, 53, 57, 59, 60).
FIG. 1.

Our pharmacodynamic function (equation 3) describes how the bacterial growth rate, ψ, depends on the antibiotic concentration, a. The parameter κ determines the steepness of the curve.
Fitting procedure.
The net growth rates of the bacterial population were derived from the increase or decrease in the density of viable bacteria during the first 60 min of exposure to the antibiotic. In the present investigation we estimated the bacterial net growth rate as the coefficient of a linear regression of the logarithm (to the base 10) of the bacterial density as a function of time. We fixed the intercept of the regression by “forcing” the regression lines through the first measurement (0 min) of the bacterial density at a given antibiotic concentration. The pharmacodynamic function (equation 3) was fitted to the estimated bacterial net growth rates by using the least square algorithm nls() of the R language for statistical computing (29) (see also www.r-project.org). A demonstration of the algorithm that we used to fit the pharmacodynamic function (equation 3) and of how to obtain parameter estimates is available at http://userwww.service.emory.edu/∼rregoes/pharmacodynamics/. This website includes instructions for readers to analyze their own time-kill data.
Simulations.
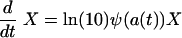
Our model for the changes in the density, X, of a bacterial population under antibiotic treatment is given by the differential equation
 |
(4) |
where ψ is the pharmacodynamic function given by equation 3 and a(t) is the antibiotic concentration at time t (the pharmacokinetics). [The factor ln(10) is required to transform the growth rate ψ that is based on the logarithm of the bacterial density to the base 10 into a rate based on the natural logarithm.] For the pharmacokinetics, we assume that a host receives a dose of a0 = 5 × the MIC every 8 h, which decays exponentially to a minimum concentration of 0.5 × MIC, or, in formula:
 |
(5) |
whereby 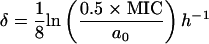 is the decay rate of the antibiotic. Equation 4 was solved numerically by using Mathematica 4.1 (56a).
RESULTS
Time-kill curves.
In Fig. 2 we present the pattern of growth and decline of CAB1 at different concentrations of the five antibiotics. For all five antibiotics, the onset of the bactericidal effect is dependent on the concentration of the antibiotic. Moreover, the rate at which the bacteria were killed declined with the time after exposure. For all antibiotics, the time-kill curves leveled off and the bacterial net growth rate approached zero within the first 60 min or later (data not shown).
FIG. 2.

Time-kill curves of E. coli CAB1 exposed to five different classes of antibiotics in various concentrations. (A) Ciprofloxacin, 0 to 2 μg/ml; (B) ampicillin, 0 to 256 μg/ml; (C) rifampin, 0 to 96 μg/ml; (D) streptomycin, 0 to 256 μg/ml; (E) tetracycline, 0 to 128 μg/ml. The geometric means of the bacterial densities obtained from two independent experiments are shown.
Estimating the parameters of the pharmacodynamic function from the time-kill curves.
As our model for the relationship between the bacterial net growth rate, ψ (which can be positive or negative), and the antibiotic concentration, a, we used the pharmacodynamic function (see Materials and Methods for equation 3 and its derivation):
 |
This model is equivalent to an Emax model (6, 8, 10, 13, 18, 19, 24, 28, 32, 36, 42-44, 47-49,53, 57, 59, 60) with four parameters. The pharmacodynamic function was fitted to the bacterial net growth rates determined from the in vitro time-kill curves.
The rates of bacterial death induced by a given antibiotic can be calculated from the decline in the density of viable bacteria over a defined period of time. Here we calculate this rate as the slope of the logarithm of the bacterial density as a function of time. As our time interval for this calculation we used the first 60 min of exposure to the antibiotic. This time interval was long enough to allow statistically meaningful estimation of the bacterial net growth rate for a given antibiotic concentration (there are seven measurements of the bacterial density during the first 60 min after exposure to the antibiotics).
The pharmacodynamic function (equation 3) was then fitted to the estimated bacterial net growth rates (Fig. 3), and estimates of the four parameters ψmax, ψmin, κ, and zMIC were obtained. For all five antibiotics, the pharmacodynamic function fit remarkably well (see adjusted R2 values in Fig. 3), explaining a significant fraction of the variation in bacterial net growth rates (see P values in Fig. 3).
FIG. 3.

Fitting the pharmacodynamic function (equation 3) to the time-kill curves. (A) Ciprofloxacin; (B) ampicillin; (C) rifampin; (D) streptomycin; (E) tetracycline. Adjusted R2 values and P values (as determined by an F test) are shown.
In Table 1, we list the estimates of these parameters and compare the pharmacodynamic MICs (zMIC) to those determined by a twofold dilution protocol (see Materials and Methods). As can be seen in Table 1, the zMICs estimated from fitting the pharmacodynamic function (equation 3) do not differ from the MIC measurements by more than a factor of two. Thus, the estimates of zMICs are within the range anticipated from the twofold dilution procedure employed to estimate the MICs.
TABLE 1.
Parameter estimates and their standard errorsa
| Drug | ψmax (h−1) | ψmin (h−1) | κ | zMIC (μg/ml) | MICb (μg/ml) |
|---|---|---|---|---|---|
| Ciprofloxacin | 0.88 ± 0.16 | −6.5 ± 0.3 | 1.1 ± 0.1 | 0.017 ± 0.005 | 0.03 |
| Ampicillin | 0.75 ± 0.21 | −4.0 ± 0.8 | 0.75 ± 0.19 | 3.4 ± 1.1 | 8.00 |
| Rifampin | 0.70 ± 0.23 | −4.3 ± 0.5 | 2.5 ± 0.8 | 12.0 ± 1.9 | 8.00 |
| Streptomycin | 0.89 ± 0.41 | −8.8 ± 1.0 | 1.9 ± 0.5 | 18.5 ± 3.3 | 32.00 |
| Tetracycline | 0.81 ± 0.42 | −8.1 ± 3.6 | 0.61 ± 0.27 | 0.67 ± 0.68 | 1.00 |
Calculated using a local quadratic approximation to the nonlinear least squares predictor.
Determined by a twofold dilution protocol.
The Hill coefficient κ is a measure of how strongly the death rate changes in response to changes in the concentration of the antibiotic around the MIC (Fig. 1). The estimates for κ vary between different antibiotics. For ciprofloxacin the estimate of κ is approximately 1. For ampicillin and tetracycline the estimates of κ are less than 1, while for rifampin and streptomycin κ is estimated to be larger than 1 (Table 1). Thus, there are significant differences in the steepness of the pharmacodynamic functions for these five different antibiotics. Moreover, the estimates of the minimum bacterial net growth rate, ψmin, which the antibiotic can induce, also differ among the five antibiotics, ranging from −4.0 h−1 for ampicillin to −8.8 h−1 for streptomycin (Table 1). As we show below, the differences in these pharmacodynamic parameters may significantly affect the microbiological efficacy.
The contribution of the shape of the pharmacodynamic function to the microbiological efficacy of treatment.
To explore and illustrate the contribution of the different pharmacodynamic parameters to the microbiological efficacy of treatment, we use a simple mathematical model of the changes in density of bacteria with different pharmacodynamic functions with the same pharmacokinetics. The modeling approach that we use to describe antibiotic treatment in vivo is similar to that employed in previous studies (33, 34). To determine the contribution of a given pharmacodynamic parameter to the microbiological efficacy, we simulate treatment with two hypothetical antibiotics that differ only with regard to the pharmacodynamic parameter in question (κ and ψmin).
Our model for the changes in the density, X, of a bacterial population under treatment is given by the differential equation (see equation 4 in Materials and Methods):
 |
Here, ψ is the pharmacodynamic function given by equation 3, and a(t) is the antibiotic concentration at time t (the pharmacokinetics). For the pharmacokinetics, we assume that a host receives a dose of 5× MIC every 8 h, which decays exponentially to a minimum concentration of 0.5× MIC (Fig. 4A).
FIG. 4.

Simulation of the effect of treatment on the bacterial decline for three hypothetical antibiotics that differ in the shape parameter κ and ψmin. (A) Pharmacokinetics which we assume to be identical for each hypothetical antibiotic. (B) Bacterial decline under treatment with an antibiotic characterized by κ = 1 (solid line), κ = 3 (dashed line), and κ = 0.5 (dotted line). (Furthermore we assumed that ψmax = 1 h−1 and ψmin = −3h−1.) (C) Bacterial decline under treatment with an antibiotic characterized by ψmin = −3 h−1 (solid line), ψmin = −6 h−1 (dashed line), and ψmin = −9 h−1 (dotted line). (Furthermore we assumed that ψmax = 1 h−1 and κ = 1.) It is obvious that, in addition to the MIC, the other parameters of the pharmacodynamic function (equation 3) are an important determinant of treatment efficacy.
To evaluate the contribution of the parameters governing the shape of the pharmacodynamic function, we consider three antibiotics with the same MIC that differ in the value of the Hill coefficient, κ, or in the value of the minimum bacterial net growth rate at high antibiotic concentrations, ψmin. As can be seen in Fig. 4B, the greater the value of κ (a measure of the steepness of the pharmacodynamic function), the greater the rate of decline in the bacterial density. And, as illustrated in Fig. 4C, the lower the minimum bacterial net growth rate ψmin, the greater the rate of decline in the bacterial density. The values used for the simulations in Fig. 4 are in the range of the parameter estimates that we obtained for the five different antibiotics (Table 1).
DISCUSSION
In this study, we used the pharmacodynamic function to describe the relationship between the rates of growth or death of bacteria and the concentrations of antibiotics of different classes. The pharmacodynamic function that we propose is related to previously published Emax models (6, 8, 10, 13, 18, 19, 24, 28, 32, 36, 42-44, 47-49, 53, 57, 59, 60). The pharmacodynamic function is characterized by four parameters that describe (i) the maximum growth rate of the bacteria in the absence of the antibiotic, ψmax; (ii) the minimum bacterial net growth rate at high antibiotic concentrations, ψmin; (iii) the pharmacodynamic MIC, zMIC; and (iv) the Hill coefficient, κ, which determines how strongly the bacterial growth or death rate responds to changes in the antibiotic concentration.
The pharmacodynamic function that we propose is a simple Hill function. Hill functions (known also as Emax models) have been used previously to describe the pharmacodynamic relationship between bacterial net growth rates and antibiotic concentrations (6, 8, 10, 13,18, 19, 24, 28, 32, 36, 42-44, 47-49, 53, 57, 59, 60). (Some studies use Hill functions, or Emax models, to describe the relationship between empirical pharmacokinetic-pharmacodynamic [PK-PD] indices and treatment outcome [21, 30, 36, 39]. These studies are therefore not directly related to ours.) The previously published Emax models differ in terms of the number of model parameters. Our pharmacodynamic function has four parameters, such as in the studies by Bouvier d'Yvoire and Maire (8) and Louie et al. (36). Although there are studies in which one or more of these parameters are omitted, we believe that all four parameters are necessary to describe the pharmacodynamic relationship. We showed that the three parameters that characterize the interaction between the antibiotic and the bacteria—ψmin, zMIC, and κ—vary across antibiotic classes. Since we used only one bacterial strain in our time-kill experiments, the fourth parameter, ψmax, which measures the growth rate of the bacterial population in the absence of antibiotics, was not found to vary significantly. If one considers the effect of antibiotics on bacterial strains that differ in their growth rates, however, the incorporation of ψmax as a model parameter is essential.
By fitting the pharmacodynamic function to the time-kill data, we obtained estimates of all four parameters for each of these antibiotics. We also independently estimated the MICs of these antibiotics in vitro by a twofold dilution protocol. The estimates of the pharmacodynamic MICs (zMIC) are within the range of those determined by the dilution method, but because they are not constrained by a twofold dilution series, they are, arguably, more precise. As can be seen in Fig. 3, the shapes of the pharmacodynamic functions differ among antibiotics of different classes. The differences in the form of the pharmacodynamic functions are reflected in the shape-determining parameters, zMIC, κ, and ψmin (Table 1).
In considering the actual values of the parameters estimated here (Table 1), it should be noted that the strain of E. coli, O18:K1:H7, and culture medium, LB broth, used here are not those specified by the NCCLS protocol for MIC determination for E. coli (45), strain ATCC 25922 and Müller-Hinton broth, respectively. This strain of E. coli and this culture medium were used here because they are used in a larger in vivo as well as in vitro study of the population dynamics of antibiotic and phage therapy (11) of which this investigation is one part and might therefore be different from those that would have been obtained with the standard NCCLS protocol. The purpose of this investigation, however, was to explore and illustrate the use of the pharmacodynamic function to analyze in vitro time-kill data and to investigate the variance of pharmacodynamic parameters across different classes of antibiotics, rather than to generate standard estimates of the MIC or other pharmacodynamic parameters.
What do the parameters of the pharmacodynamic function tell us about the microbiological efficacy of antibiotics? For two of the parameters, the answer to this question is straightforward. The lower the MIC of an antibiotic, the lower the dose needed for treatment, and the lower the value of ψmin, the greater the rate of killing at high antibiotic concentrations. The influence of the parameter κ on the microbiological efficacy is more complex. The parameter κ is a measure of the sensitivity of the response of the bacteria to changes in the concentration of the antibiotic. This can be seen in Fig. 1, where we plot pharmacodynamic functions that differ only in κ. If the antibiotic concentration is above the MIC, antibiotics with high values of κ induce higher mortality in bacteria than do antibiotics with low κ. Just the opposite occurs when the concentration of the antibiotic is below the MIC, in which case the antibiotic with the lowest κ has the largest inhibitory effect on the rate of growth. Using a mathematical model for bacterial growth during treatment, we found that the parameters which characterize the pharmacodynamic function may have a profound effect on the microbiological efficacy of treatment. Assuming a pharmacokinetic profile in which the antibiotic concentration was above the MIC most of the time, the simulations predict that antibiotics with high Hill coefficients κ are more effective than antibiotics with low values of κ (all three other parameters being equal). Considering the minimum bacterial net growth rate at high antibiotic concentrations, ψmin, our simulations predicted that antibiotics with the lowest value of ψmin are most effective (again all three other parameters being equal).
The parameter κ may provide a theoretical background for empirical PK-PD indices that previously have been proposed to guide antibiotic therapy. For concentration-dependent drugs like fluoroquinolones and aminoglycocides (and rifampin) a high ratio of maximum concentration to MIC (Cmax/MIC ratio) (of above 8 to 10) is a predictor of a successful treatment outcome (3, 21, 40). In contrast, for time-dependent drugs (including β-lactams and tetracyclines) a long time above MIC (T/MIC ratio) or a large ratio of the area under the pharmacokinetic curve to MIC (AUC/MIC) is predictive of a successful treatment outcome (14). Interestingly, our estimates of the parameter κ were higher for the concentration-dependent antibiotics (ciprofloxacin, rifampin, and streptomycin) than for the time-dependent antibiotics (ampicillin and tetracycline), i.e., for the five antibiotics that we studied the concentration-dependent drugs are characterized by a steeper pharmacodynamic function. The steeper the pharmacodynamic function, the more dramatically bacterial killing increases as a consequence of an increase in the antibiotic concentration. For antibiotics with high values of κ, increasing Cmax/MIC may therefore be the most effective way to improve treatment outcome. Thus, the concentration dependence of ciprofloxacin, rifampin, and streptomycin could be a direct consequence of the high values of κ of these antibiotics. If, on the other hand, the pharmacodynamic relationship of an antibiotic is characterized by a low κ, increases of the antibiotic concentration may only marginally increase bacterial killing. For such antibiotics, the time above MIC may therefore be the most important correlate of efficacy, which would explain the association of low values of κ and time dependence. These verbal arguments relating the parameters of the pharmacodynamic function to empirical PK-PD indices can be studied formally by mathematical simulation of antibiotic treatment, assuming a pharmacokinetic profile as in Fig. 4A and a pharmacodynamic relationship governed by a pharmacodynamic function like ours (13).
It should be noted that, in fitting these functions and estimating these parameters, we are not considering the details of the time-kill kinetics. For all of the antibiotics that we studied, the onset of killing is dependent on their concentration. And, as is well known for some antibiotics and bacteria, the rate at which the bacteria are killed declines with time (12, 14, 16, 19, 22, 23, 26, 38). This decline in the killing rate is likely to be due to adaptive resistance (2)—a mechanism by which the bacterial population becomes increasingly refractory to the antibiotic for physiological reasons, rather than due to inherited resistance. These properties of the kill curves may also have an effect on the course of treatment, which is not considered here.
What do the results of this study mean for the design of antibiotic treatment protocols and the development of new antibiotics? A short answer to this question is that the shape of the pharmacodynamic functions can be important. These functions contain information about the effect of antibiotics on bacterial growth that are not captured by MICs or other single pharmacodynamic parameters. In particular, the pharmacodynamic function captures the effect of an antibiotic over a wide range of antibiotic concentrations. As a consequence of differences in the shape of these pharmacodynamic functions, antibiotics with the same MICs and pharmacokinetics may differ profoundly in their microbiological efficacy. For this currently more theoretical than empirical reason we believe and recommend that, rather than relying solely on MICs or other single parameters as representatives of pharmacodynamics of antibiotics, the entire pharmacodynamic function should be considered for the development of antibiotic treatment protocols and the design of new antibiotics. Having said that, it remains important that there is more to antibiotic therapy than the microbiological efficacy considered in this report. Toxic and other effects of the antibiotics on the physiology of the treated patient certainly have to be considered. Moreover, the constitutive and inducible immune defenses also influence the outcome of treated as well as untreated infections and thereby contribute to the efficacy of antibiotic treatment protocols in ways that may not be captured by purely pharmacodynamic and pharmacokinetic considerations.
Acknowledgments
We thank E. R. Garrett for his pioneering and inspiring work on the pharmacodynamics of antibiotics.
We gratefully acknowledge the support of the Deutsche Forschungsgemeinschaft, Re 1618/2-1, and the U.S. National Institutes of Health, AI 49334 (R.R.R.); the Spanish Pneumococcal Infection Study Network, G03/103 (F.B.); the Wellcome Trust (B.R.L.); and the U.S. National Institutes of Health, GM33782 (B.R.L.).
REFERENCES
- 1.Andes, D., and W. A. Craig. 2002. Animal model pharmacokinetics and pharmacodynamics: a critical review. Int. J. Antimicrob. Agents 19:261-268. [DOI] [PubMed] [Google Scholar]
- 2.Barclay, M. L., and E. J. Begg. 2001. Aminoglycoside adaptive resistance: importance for effective dosage regimens. Drugs 61:713-721. [DOI] [PubMed] [Google Scholar]
- 3.Blaser, J., B. B. Stone, M. C. Groner, and S. H. Zinner. 1987. Comparative study with enoxacin and netilmicin in a pharmacodynamic model to determine importance of ratio of antibiotic peak concentration to MIC for bactericidal activity and emergence of resistance. Antimicrob. Agents Chemother. 31:1054-1060. [DOI] [PMC free article] [PubMed] [Google Scholar]
- 4.Bloch, C. A., and C. K. Rode. 1996. Pathogenicity island evaluation in Escherichia coli K1 by crossing with laboratory strain K-12. Infect. Immun. 64:3218-3223. [DOI] [PMC free article] [PubMed] [Google Scholar]
- 5.Bloch, C. A., G. M. Thorne, and F. M. Ausubel. 1989. General method for site-directed mutagenesis in Escherichia coli O18ac:K1:H7: deletion of the inducible superoxide dismutase gene, sodA, does not diminish bacteremia in neonatal rats. Infect. Immun. 57:2141-2148. [DOI] [PMC free article] [PubMed] [Google Scholar]
- 6.Bonapace, C. R., L. V. Friedrich, J. A. Bosso, and R. L. White. 2002. Determination of antibiotic effect in an in vitro pharmacodynamic model: comparison with an established animal model of infection. Antimicrob. Agents Chemother. 46:3574-3579. [DOI] [PMC free article] [PubMed] [Google Scholar]
- 7.Boswell, F. J., J. M. Andrews, R. Wise, and A. Dalhoff. 1999. Bactericidal properties of moxifloxacin and post-antibiotic effect. J. Antimicrob. Chemother. 43(Suppl. B):43-49. [DOI] [PubMed] [Google Scholar]
- 8.Bouvier d'Yvoire, M. J. Y., and P. H. Maire. 1996. Dosage regimens of antibacterials. Clin. Drug Investig. 11:229-239. [Google Scholar]
- 9.Bowker, K. E., M. Wootton, C. A. Rogers, R. Lewis, H. A. Holt, and A. P. MacGowan. 1999. Comparison of in-vitro pharmacodynamics of once and twice daily ciprofloxacin. J. Antimicrob. Chemother. 44:661-667. [DOI] [PubMed] [Google Scholar]
- 10.Boylan, C. J., K. Campanale, P. W. Iversen, D. L. Phillips, M. L. Zeckel, and T. R. Parr, Jr. 2003. Pharmacodynamics of oritavancin (LY333328) in a neutropenic-mouse thigh model of Staphylococcus aureus infection. Antimicrob. Agents Chemother. 47:1700-1706. [DOI] [PMC free article] [PubMed] [Google Scholar]
- 11.Bull, J. J., B. R. Levin, T. DeRouin, N. Walker, and C. A. Bloch. 2002. Dynamics of success and failure in phage and antibiotic therapy in experimental infections. BMC Microbiol. 2:35. [DOI] [PMC free article] [PubMed] [Google Scholar]
- 12.Carret, G., J. P. Flandrois, and J. R. Lobry. 1991. Biphasic kinetics of bacterial killing by quinolones. J. Antimicrob. Chemother. 27:319-327. [DOI] [PubMed] [Google Scholar]
- 13.Corvaisier, S., P. H. Maire, M. Y. Bouvier d'Yvoire, X. Barbaut, N. Bleyzac, and R. W. Jelliffe. 1998. Comparisons between antimicrobial pharmacodynamic indices and bacterial killing as described by using the Zhi model. Antimicrob. Agents Chemother. 42:1731-1737. [DOI] [PMC free article] [PubMed] [Google Scholar]
- 14.Craig, W. A. 1998. Pharmacokinetic/pharmacodynamic parameters: rationale for antibacterial dosing of mice and men. Clin. Infect. Dis. 26:1-10. [DOI] [PubMed] [Google Scholar]
- 15.Craig, W. A. 2001. Does the dose matter? Clin. Infect. Dis. 33(Suppl. 3):S233-S237. [DOI] [PubMed] [Google Scholar]
- 16.Craig, W. A., and S. C. Ebert. 1991. Killing and regrowth of bacteria in vitro: a review. Scand. J. Infect. Dis. Suppl. 74:63-70. [PubMed] [Google Scholar]
- 17.Dalhoff, A. 1999. Pharmacodynamics of fluoroquinolones. J. Antimicrob. Chemother. 43(Suppl. B):51-59. [DOI] [PubMed] [Google Scholar]
- 18.Dalla Costa, T., A. Nolting, K. Rand, and H. Derendorf. 1997. Pharmacokinetic-pharmacodynamic modelling of the in vitro antiinfective effect of piperacillin-tazobactam combinations. Int. J. Clin. Pharmacol. Ther. 35:426-433. [PubMed] [Google Scholar]
- 19.Delacher, S., H. Derendorf, U. Hollenstein, M. Brunner, C. Joukhadar, S. Hofmann, A. Georgopoulos, H. G. Eichler, and M. Muller. 2000. A combined in vivo pharmacokinetic-in vitro pharmacodynamic approach to simulate target site pharmacodynamics of antibiotics in humans. J. Antimicrob. Chemother. 46:733-739. [DOI] [PubMed] [Google Scholar]
- 20.Drusano, G. L., and W. A. Craig. 1997. Relevance of pharmacokinetics and pharmacodynamics in the selection of antibiotics for respiratory tract infections. J. Chemother. 9(Suppl. 3):38-44. [PubMed] [Google Scholar]
- 21.Drusano, G. L., D. E. Johnson, M. Rosen, and H. C. Standiford. 1993. Pharmacodynamics of a fluoroquinolone antimicrobial agent in a neutropenic rat model of Pseudomonas sepsis. Antimicrob. Agents Chemother. 37:483-490. [DOI] [PMC free article] [PubMed] [Google Scholar]
- 22.Firsov, A. A., S. N. Vostrov, A. A. Shevchenko, S. H. Zinner, G. Cornaglia, and Y. A. Portnoy. 1998. MIC-based interspecies prediction of the antimicrobial effects of ciprofloxacin on bacteria of different susceptibilities in an in vitro dynamic model. Antimicrob. Agents Chemother. 42:2848-2852. [DOI] [PMC free article] [PubMed] [Google Scholar]
- 23.Fung-Tomc, J. C., E. Gradelski, L. Valera, B. Kolek, and D. P. Bonner. 2000. Comparative killing rates of fluoroquinolones and cell wall-active agents. Antimicrob. Agents Chemother. 44:1377-1380. [DOI] [PMC free article] [PubMed] [Google Scholar]
- 24.Garrett, E. R. 1971. Drug action and assay by microbial kinetics. Prog. Drug Res. 15:271-352. [Google Scholar]
- 25.Gerber, A. U., P. Wiprachtiger, U. Stettler-Spichiger, and G. Lebek. 1982. Constant infusions vs. intermittent doses of gentamicin against Pseudomonas aeruginosa in vitro. J. Infect. Dis. 145:554-560. [DOI] [PubMed] [Google Scholar]
- 26.Guerillot, F., G. Carret, and J. P. Flandrois. 1993. Mathematical model for comparison of time-killing curves. Antimicrob. Agents Chemother. 37:1685-1689. [DOI] [PMC free article] [PubMed] [Google Scholar]
- 27.Gustafsson, I., E. Lowdin, I. Odenholt, and O. Cars. 2001. Pharmacokinetic and pharmacodynamic parameters for antimicrobial effects of cefotaxime and amoxicillin in an in vitro kinetic model. Antimicrob. Agents Chemother. 45:2436-2440. [DOI] [PMC free article] [PubMed] [Google Scholar]
- 28.Hyatt, J. M., D. E. Nix, C. W. Stratton, and J. J. Schentag. 1995. In vitro pharmacodynamics of piperacillin, piperacillin-tazobactam, and ciprofloxacin alone and in combination against Staphylococcus aureus, Klebsiella pneumoniae, Enterobacter cloacae, and Pseudomonas aeruginosa. Antimicrob. Agents Chemother. 39:1711-1716. [DOI] [PMC free article] [PubMed] [Google Scholar]
- 29.Ihaka, R., and R. Gentleman. 1996. R: a language for data analysis and graphics. J. Comput. Graphical Stat. 5:299-314. [Google Scholar]
- 30.Kim, M. K., W. Zhou, P. R. Tessier, D. Xuan, M. Ye, C. H. Nightingale, and D. P. Nicolau. 2002. Bactericidal effect and pharmacodynamics of cethromycin (ABT-773) in a murine pneumococcal pneumonia model. Antimicrob. Agents Chemother. 46:3185-3192. [DOI] [PMC free article] [PubMed] [Google Scholar]
- 31.Lacy, M. K., W. Lu, X. Xu, P. R. Tessier, D. P. Nicolau, R. Quintiliani, and C. H. Nightingale. 1999. Pharmacodynamic comparisons of levofloxacin, ciprofloxacin, and ampicillin against Streptococcus pneumoniae in an in vitro model of infection. Antimicrob. Agents Chemother. 43:672-677. [DOI] [PMC free article] [PubMed] [Google Scholar]
- 32.Leggett, J. E., B. Fantin, S. Ebert, K. Totsuka, B. Vogelman, W. Calame, H. Mattie, and W. A. Craig. 1989. Comparative antibiotic dose-effect relations at several dosing intervals in murine pneumonitis and thigh-infection models. J. Infect. Dis. 159:281-292. [DOI] [PubMed] [Google Scholar]
- 33.Levin, B. R. 1999. Mathematical models of the emergence and spread of antibiotic resistance; p. 39-50. In A. Andremenot, C. Brun-Buisson, and J. E. McGowan (ed.), Antibiotic therapy and the control of antibiotic resistance in hospitals. 6th Maurice Rapin Colloquium. Elsevier, Paris, France.
- 34.Lipsitch, M., and B. R. Levin. 1997. The population dynamics of antimicrobial chemotherapy. Antimicrob. Agents Chemother. 41:363-373. [DOI] [PMC free article] [PubMed] [Google Scholar]
- 35.Liu, P., M. Muller, and H. Derendorf. 2002. Rational dosing of antibiotics: the use of plasma concentrations versus tissue concentrations. Int. J. Antimicrob. Agents 19:285-290. [DOI] [PubMed] [Google Scholar]
- 36.Louie, A., P. Kaw, W. Liu, N. Jumbe, M. H. Miller, and G. L. Drusano. 2001. Pharmacodynamics of daptomycin in a murine thigh model of Staphylococcus aureus infection. Antimicrob. Agents Chemother. 45:845-851. [DOI] [PMC free article] [PubMed] [Google Scholar]
- 37.MacGowan, A., C. Rogers, and K. Bowker. 2000. The use of in vitro pharmacodynamic models of infection to optimize fluoroquinolone dosing regimens. J. Antimicrob. Chemother. 46:163-170. [DOI] [PubMed] [Google Scholar]
- 38.MacGowan, A. P., M. Wootton, A. J. Hedges, K. E. Bowker, H. A. Holt, and D. S. Reeves. 1996. A new time-kill method of assessing the relative efficacy of antimicrobial agents alone and in combination developed using a representative β-lactam, aminoglycoside and fluoroquinolone. J. Antimicrob. Chemother. 38:193-203. [DOI] [PubMed] [Google Scholar]
- 39.Madaras-Kelly, K. J., B. E. Ostergaard, L. B. Hovde, and J. C. Rotschafer. 1996. Twenty-four-hour area under the concentration-time curve/MIC ratio as a generic predictor of fluoroquinolone antimicrobial effect by using three strains of Pseudomonas aeruginosa and an in vitro pharmacodynamic model. Antimicrob. Agents Chemother. 40:627-632. [DOI] [PMC free article] [PubMed] [Google Scholar]
- 40.Marchbanks, C. R., J. R. McKiel, D. H. Gilbert, N. J. Robillard, B. Painter, S. H. Zinner, and M. N. Dudley. 1993. Dose ranging and fractionation of intravenous ciprofloxacin against Pseudomonas aeruginosa and Staphylococcus aureus in an in vitro model of infection. Antimicrob. Agents Chemother. 37:1756-1763. [DOI] [PMC free article] [PubMed] [Google Scholar]
- 41.Montgomery, M. J., P. M. Beringer, A. Aminimanizani, S. G. Louie, B. J. Shapiro, R. Jelliffe, and M. A. Gill. 2001. Population pharmacokinetics and use of Monte Carlo simulation to evaluate currently recommended dosing regimens of ciprofloxacin in adult patients with cystic fibrosis. Antimicrob. Agents Chemother. 45:3468-3473. [DOI] [PMC free article] [PubMed] [Google Scholar]
- 42.Mouton, J. W., M. N. Dudley, O. Cars, H. Derendorf, and G. L. Drusano. 2002. Standardization of pharmacokinetic/pharmacodynamic (PK/PD) terminology for anti-infective drugs. Int. J. Antimicrob. Agents 19:355-358. [DOI] [PubMed] [Google Scholar]
- 43.Mouton, J. W., A. A. Vinks, and N. C. Punt. 1997. Pharmacokinetic-pharmacodynamic modeling of activity of ceftazidime during continuous and intermittent infusion. Antimicrob. Agents Chemother. 41:733-738. [DOI] [PMC free article] [PubMed] [Google Scholar]
- 44.Mueller, M., A. de La Peña, and H. Derendorf. 2004. Issues in pharmacokinetics and pharmacodynamics of anti-infective agents: kill curves versus MIC. Antimicrob. Agents Chemother. 48:369-377. [DOI] [PMC free article] [PubMed] [Google Scholar]
- 45.NCCLS. 2000. Methods for dilution antimicrobial susceptibility tests for bacteria that grow aerobically; approved standard, 5th ed. Technical report. NCCLS, Wayne, Pa.
- 46.Nicolau, D. P. 2001. Predicting antibacterial response from pharmacodynamic and pharmacokinetic profiles. Infection 29(Suppl. 2):11-15. [PubMed] [Google Scholar]
- 47.Nix, D. E., J. H. Wilton, J. Hyatt, J. Thomas, L. C. Strenkoski-Nix, A. Forrest, and J. J. Schentag. 1997. Pharmacodynamic modeling of the in vivo interaction between cefotaxime and ofloxacin by using serum ultrafiltrate inhibitory titers. Antimicrob. Agents Chemother. 41:1108-1114. [DOI] [PMC free article] [PubMed] [Google Scholar]
- 48.Nolting, A., T. Dalla Costa, K. H. Rand, and H. Derendorf. 1996. Pharmacokinetic-pharmacodynamic modeling of the antibiotic effect of piperacillin in vitro. Pharm. Res. 13:91-69. [DOI] [PubMed] [Google Scholar]
- 49.Nolting, A., and H. Derendorf. 1995. Pharmacokinetic/pharmacodynamic modeling of antibiotics, p. 363-388. In H. Derendorf and G. Hochhaus (ed.), Handbook of pharmacokinetic/pharmacodynamic correlation. CRC Press, Boca Raton, Fla.
- 50.Odenholt, I., T. Cars, and E. Lowdin. 2000. Pharmacodynamic studies of trovafloxacin and grepafloxacin in vitro against Gram-positive and Gram-negative bacteria. J. Antimicrob. Chemother. 46:35-43. [DOI] [PubMed] [Google Scholar]
- 51.Odenholt, I., E. Lowdin, and O. Cars. 1997. Studies of the killing kinetics of benzylpenicillin, cefuroxime, azithromycin, and sparfloxacin on bacteria in the postantibiotic phase. Antimicrob. Agents Chemother. 41:2522-2526. [DOI] [PMC free article] [PubMed] [Google Scholar]
- 52.Odenholt, I., E. Lowdin, and O. Cars. 2001. Pharmacodynamics of telithromycin in vitro against respiratory tract pathogens. Antimicrob. Agents Chemother. 45:23-29. [DOI] [PMC free article] [PubMed] [Google Scholar]
- 53.Staneva, M., B. Markova, I. Atanasova, and D. Terziivanov. 1994. Pharmacokinetic and pharmacodynamic approach for comparing two therapeutic regimens using amikacin. Antimicrob. Agents Chemother. 38:981-985. [DOI] [PMC free article] [PubMed] [Google Scholar]
- 54.Thonus, I. P., P. Fontijne, and M. F. Michel. 1982. Ampicillin susceptibility and ampicillin-induced killing rate of Escherichia coli. Antimicrob. Agents Chemother. 22:386-390. [DOI] [PMC free article] [PubMed] [Google Scholar]
- 55.Vinks, A. A. 2002. The application of population pharmacokinetic modeling to individualized antibiotic therapy. Int. J. Antimicrob. Agents 19:313-322. [DOI] [PubMed] [Google Scholar]
- 56.Wright, D. H., G. H. Brown, M. L. Peterson, and J. C. Rotschafer. 2000. Application of fluoroquinolone pharmacodynamics. J. Antimicrob. Chemother. 46:669-683. [DOI] [PubMed] [Google Scholar]
- 56a.Wolfram Research, Inc. 2001. Mathematica, version 4.1. Wolfram Research, Inc., Champaign, Ill.
- 57.Yano, Y., T. Oguma, H. Nagata, and S. Sasaki. 1998. Application of logistic growth model to pharmacodynamic analysis of in vitro bactericidal kinetics. J. Pharm. Sci. 87:1177-1183. [DOI] [PubMed] [Google Scholar]
- 58.Yourassowsky, E., M. P. Van der Linden, and F. Crokaert. 1989. Correlation between growth curves and killing curves of Escherichia coli in the presence of fleroxacin and ampicillin. Chemotherapy 35:423-430. [DOI] [PubMed] [Google Scholar]
- 59.Zhi, J., C. H. Nightingale, and R. Quintiliani. 1986. A pharmacodynamic model for the activity of antibiotics against microorganisms under nonsaturable conditions. J. Pharm. Sci. 75:1063-1067. [DOI] [PubMed] [Google Scholar]
- 60.Zhi, J. G., C. H. Nightingale, and R. Quintiliani. 1988. Microbial pharmacodynamics of piperacillin in neutropenic mice of systematic infection due to Pseudomonas aeruginosa. J. Pharmacokinet. Biopharm. 16:355-375. [DOI] [PubMed] [Google Scholar]
- 61.Zinner, S. H., D. Gilbert, and M. N. Dudley. 1998. Activity of trovafloxacin (with or without ampicillin-sulbactam) against enterococci in an in vitro dynamic model of infection. Antimicrob. Agents Chemother. 42:72-77. [DOI] [PMC free article] [PubMed] [Google Scholar]