

Abstract
The bactericidal pharmacodynamics of antibiotics against Escherichia coli were analyzed by a concentration-killing curve (CKC) approach, and the novel parameters median bactericidal concentration (BC50) and bactericidal intensity (r) for bactericidal potency were proposed. By using the agar plate method, about 500 E. coli cells were inoculated onto Luria-Bertani plates containing a series of antibiotic concentrations, and after 24 h of incubation at 37°C, all the viable colonies were enumerated. This resulted in a sigmoidal CKC that could be perfectly fitted (R2 > 0.9) with the function N = N0/[1 + er(x − BC50)], where N is number of colonies surviving on each plate with an x series of concentrations of an antibiotic, and N0 represents the meaningful inoculum size. Construction of the CKC method was based on the bactericidal effect of each antibiotic against the bacterial strain versus the concentration in two dimensions and may be a more valid, accurate, and reproducible method for estimating the bactericidal effect than the endpoint minimum bactericidal concentration (MBC) method. Mathematically, the CKC approach was point symmetrical toward its inflexion (BC50, N0/2); thus, 2BC50 could replace MBC. The parameter BC1 can be defined as BC50 + [ln(N0 − 1)/r], which is the drug concentration at which only one colony survived and which is the least critical value of MBC in the CKC. The variate r, which determined the tangent slope on inflexion when N0 was limited, could estimate the bactericidal intensity of an antibiotic. This verified that the CKC approach may be useful in studies with other classes of antibiotics and has considerable value as a tool for the accurate and proper administration of antibiotics.
Over the last century, antibiotics have enjoyed widespread application in the treatment of bacterial diseases (24). The correct estimation of bactericidal potency, an important parameter of pharmacology, is a critical issue for the safe and proper use of antibiotics (2, 29); and a number of alternative methods and standards, including those described by the National Committee for Clinical Laboratory Standards and the European Committee on Antimicrobial Susceptibility Testing (39), have been developed. All such methods are based on a similar principle, whereby bactericidal effectiveness, the MIC, or the minimum bactericidal concentration (MBC), or derivatives thereof, are determined by measurement of the diameter of the zone of growth inhibition (the disk diffusion method and E-test), culture turbidity (the broth dilution and microdilution methods), and colony formation in agar plate (agar dilution tests). All these assays are carried out following incubation of target inocula for an optimal time in liquid or agar media containing ranges of antibiotic concentrations (3, 14, 30). The presence either of resistant mutants or of variations in susceptibility results by diffusion and the superior growth of highly fit drug-resistant bacterial cells in antibiotic-containing broth, so the broth dilution method often significantly overestimates the MBC (21). Disk diffusion methods with agar medium (E-test and Kirby-Bauer method) avoid this problem, but the diameter of the zone of growth inhibition, which is only a relative value, must be associated with the MBC to determine absolute bactericidal potency. Colony counting by the agar dilution method is a relatively reliable approach. When a pure bacterial population is inoculated onto an agar medium containing a given concentration of drug and is incubated at a suitable temperature, the number of viable bacteria from the initial inoculum that survive over a range of drug concentrations and that are separated from one another in space by dispersion on agar medium appear directly as microscopically visible colonies, and the incubation time does not influence the final number of CFU per plate after 24 h. In the present study, we have preferred the use of MBC, the eradication concentration, as determined by the agar dilution method. Although the MBC is similar to or interchangeable with the MIC in the clinical setting, the elimination of the pathogen is clearly the more relevant outcome.
The MBC is recognized as the standard quantitative index of bactericidal potency, yet two problems are frequently encountered when replicated estimates are obtained by standard National Committee for Clinical Laboratory Standards protocols (28, 30). The first relates to the accuracy of the measurement. The unusual exponentially increasing interval in the agar dilution series of a drug leads to a wide confidence interval in the MBC estimate. For example, when the range of antibiotic concentrations is in an exponentially increasing series (e.g., 1, 2, 4, 8, 16, 32, 64, and 128 μg/ml) for a test in which a plate contains a concentration of 128 μg/ml and produces no CFU, the MBC is 128 μg/ml; however, it is not possible to confirm in which medium with drug levels between 64 and 128 μg/ml any CFU would be formed. The actual MBC is therefore not determined, and this will result in confusion for the proper administration of antibiotics, because the MIC or the MBC is the most basic parameter in pharmacokinetics and pharmacodynamics. In order to achieve better precision, the MIC or the MBC has been determined by applying doubling dilutions starting with close concentrations of 3, 4, and 5 μg/ml (15).
The second problem relates to the distribution of the natural population itself. Because the number of CFU is determined by the counting method on agar, it is influenced by the inoculum size, sampling, dilution, and culture conditions; so each replicated experiment may produce a different MBC estimate (28, 31). In addition, any spontaneous mutants and/or the few preexisting resistant cells in the large population inoculated will be selectively enriched when antibiotic concentrations fall inside the mutant selection window, i.e., the concentration range extending from the MIC for wild-type bacteria to the single-step mutant prevention concentration (11). The uncertainty surrounding mutation and the methodology makes for so much confusion in conventional MBC estimates that compromise breakpoints of susceptible, intermediate, and resistant is commonly applied, in which the intermediate breakpoint provides an inkling of the MBC (14, 28). The overuse of antibiotics on the basis of a false MBC (usually a concentration higher than the actual MBC) results in two undesirable consequences: drug toxicity and side effects and strong selection for antibiotic resistance (4, 33).
The MBC measurement is a one-dimensional endpoint determination based on a qualitative “yes” or “no” presumption; but concentration-killing experiments with gentamicin, penicillin, and enoxacin have shown that the true response to concentration fits a sigmoidal pattern, and this has clearly exposed a trend in the gradual reduction in the number of surviving CFU per plate. Viewing the problem from a bactericidal pharmacodynamics perspective, we have explored the relationship between drug concentration and killing potency and selected the metrics median bactericidal concentration (BC50) and bactericidal intensity (r) to deliver an accurate and reproducible index for estimating bactericidal potency.
MATERIALS AND METHODS
Derivation of a new equation fitting the concentration-killing curve (CKC).
There are many possible ways of fitting concentration-response data, but the optimum method will both fit experimental data well and reflect reasonable biological assumptions. When a bacterial population of a shaking culture of more than 106 CFU is inoculated onto agar plates containing various concentrations of antibiotics, various killing and regrowth curves are generated (9); this is probably because of the presence of preexisting or de novo-generated antibiotic-resistant mutants in the culture. As a consequence, prediction of the parameters of antimicrobial activity from the time-kill curves will be misleading, as it is not possible to separate the behavior of the wild-type bacterial strain from that of the resistant one(s). Moreover, from a pharmacokinetics point of view, a steady bactericidal concentration cannot be deduced if the drug concentrations on the concentration-time curve vary. For example, when sustained concentrations greater than five times the MIC are used in a two-compartment pharmacokinetic model mimicking human serum drug concentrations, continuous administration is more efficacious than intermittent dosing. Pharmacokinetic-pharmacodynamic models that describe bacterial growth and killing in the presence of antibiotics with pharmacokinetics that mimic those in humans have been developed (26, 27). This approach is suitable for description of the development of mutations in inocula exposed to antibiotics in vivo.
In pure inocula equivalent to about 500 CFU, the frequency of spontaneous mutants is extremely low, and hence, these should not disturb the initial CFU counts on antibiotic-containing plates. In addition, during incubation, the number of preexisting or de novo mutants among the viable colonies that form on agar would be limited, and thus, the occurrence and regrowth of mutants would not change the colony counts present. The present method targets the actual number of viable clones in the initial inoculum following exposure to certain concentrations of an antibiotic in vitro, and we have adopted the method to determine the steady-state bactericidal effect by counting the numbers of surviving colonies.
The formation of viable colonies depends on two heterogeneous processes, the growth and the death of each cell in the inoculum, which occur sequentially and which then progress in parallel. The number of colonies present in the presence of different concentrations of an antibiotic depends on the balance between the growth rate and the death rate (17, 27). A similar situation is encountered in other biological systems, such as antigen-antibody and concentration-receptor systems. In general, the quantitative aspects of the interaction can be studied by dynamic approaches (7, 20, 34). Following the methods and bacterial growth theory given above, we have constructed a relevant model for accurate estimation of the potency of an antibiotic.
Assume that the initial population size (the number of CFU per plate) is N0, in which each cell can grow to form a viable colony on agar medium in the absence of antibiotic. When N0 cells are introduced into media containing a series of concentrations of antibiotics (x), a series of N survivor colonies are obtained, with N < N0. A plot of N versus x generates a sigmoidal curve (Fig. 1). With certain concentrations of antibiotics in the agar medium, the more effects from the antibiotics from which each cell suffers, the higher the rate of mortality is, the less the rate of viability is, and the less N is; and this reflects the specific viability rate, (1/N0)/(dN/dx), which would be negatively correlated with the instantaneous mortality rate, 1 − (N/N0).
FIG. 1.

Contrast between CKC and MBC methods. ⋄, CKC, which is a monotonously degressive line with an inflection (10, 250) and two asymptotes: N equal to 0 and N equal to N0. The inflexions show that half of the inocula were killed at a concentration less than the BC50, and its tangent slope is −rN0/4. BC1 indicates the concentration at which only one colony survives, and 2BC50 indicates the point (BC50, 0) symmetrical to (0, N0). By the CKC method, the two-dimensional CKC and its parameters, BC50, BC1, and r, are obtained, and the dynamic law and changes in details are obtained. •, MBC results as >1 or 0 CFU/plate, not the numbers of CFU. Some of the inocula survive at concentrations of 1, 2, 4, 8, and 16 μg/ml; and all are killed at a concentration of 32 μg/ml. The jumps in the one-dimensional data do not allow specific MBC to be identified, nor do they allow a description of the details of bactericidal dynamics.
For given values of N and x,
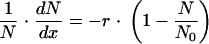 |
(1) |
where the constant r is ≥0.
By integration,
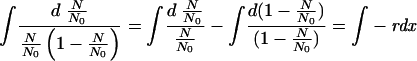 |
(2) |
This resolves to
 |
(3) |
It is straightforward to define BC50, by analogy with the median effective concentration (EC50) in the validated and frequently used sigmoidal concentration-response equations (25, 29), as the antibiotic concentration that provokes a bactericidal response equivalent to half of N0. Thus, the constant C is equal to rBC50, and equation 3can be reduced to equation 4, which generates the curve shown in Fig. 1:
 |
(4) |
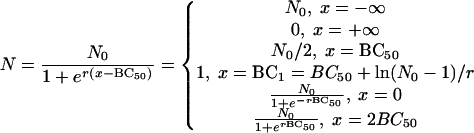
After differentiation of equation 4 and by letting second derivative N′′ equal 0, the only inflexion of the curve occurs at (BC50, N0/2). The inflexion describes the concentration at which bactericidal potency lies midway between 0 and N0, namely, BC50, and reflects the condition in which the viability of the bacteria decreases at the fastest rate. BC50 is independent of both N0 and r. Thus, it is a more stable index for the bactericidal effect than the MBC. The slope of the tangent to the curve at the inflexion is −rN0/4, and this is a measure of the bactericidal intensity, because when N0 is limited to about 500 CFU/plate, the maximum decreasing rate of N is proportional to r. Thus, BC50 and r in equation 4 are indicators of the bactericidal concentration and the bactericidal intensity, respectively.
For the conventional determination of the MBC, no bacterial colonies should be viable at the critical concentration, the MBC. The present data (as modeled in Fig. 1), however, show that as the antibiotic concentration increases, the number of CFU per plate gradually decreases from N0 to 0 asymptotically to the lines N equal to N0 and N equal to 0. Thus, theoretically, no true value of MBC can exist. Hence, as an approximation for MBC, we have taken the concentration BC1, at which only one colony survived, since an N value <1 implies that no bacterium survives.
From equation 4 and Fig. 1, it is clear that the curve is symmetrical about its inflexion point (BC50, N0/2), because
 |
Hence the point 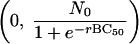 is symmetrical with the point
 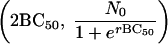 . These approximate to (0, N0) and (2BC50, 0), respectively, and so 2BC50 can be taken as the MBC. Because BC1 (or 2BC50) is closely related to MBC, it can replace MBC as a diagnostic.
Study design.
The susceptibilities of Escherichia coli O1 strain CVCC249 to gentamicin, penicillin, and enoxacin were measured by the conventional MBC method (30), and the strain was purified by serial passages until colony formation on MBC plates was abolished. After 24 h of incubation at 37°C, one pure colony was isolated and was dispersed by shaking in a flask with beads, diluted with physiological salt solution, and maintained at 4°C to obtain a uniform control inoculum of about 5,000 CFU/ml. An enoxacin-resistant strain, isolated from E. coli O1 strain CVCC249 cultured in plates containing a gradient of enoxacin concentrations, was processed in the same manner. The antibiotics were diluted to a monotonic gradient according to a predefined MBC, and 1 ml was added to each plate. Then, 15 ml of sterilized Luria-Bertani agar, maintained at 50°C, was poured into each plate. After several tilting circular movements to fully mix the medium, all plates were left to dry on a sterile bench at room temperature for 12 h. Finally, 100 μl of inoculum was spread over the surface of each plate, and the plates were incubated at 37°C for 24 h before the number of visible colonies per plate, i.e., the number of CFU per plate, was counted.
Data analysis.
The concentrations of gentamicin, penicillin, and enoxacin and the corresponding number of CFU per plate were used for pharmacodynamic analysis with Graph Pad Prism (version 4.0) software (25). CKC were constructed by plotting the number of CFU per plate (N) versus the concentration (x), and equation 4 was used to fit the sigmoidal CKC.
RESULTS
Determination of bactericidal potencies of different antibiotics against E. coli by CKC approach.
Although gentamicin, penicillin, and enoxacin kill E. coli by disruption of independent biochemical pathways, the dynamics of their bactericidal behaviors are similar. It can therefore be concluded that the CKC and the equation for CKC are generalizable to various antibiotic-bacterial strain combinations. As shown in Fig. 2, 3, 4, 5, and 6, the CKCs were similar both in tendency and in shape; and by using the variates BC50, BC1, and r, it was possible to predict an accurate value of bactericidal potency and thereby confirm which antibiotic has stronger bactericidal potency against E. coli O1.
FIG. 2.

CKC of gentamicin for susceptible strain E. coli O1.
FIG. 3.

CKC of penicillin for susceptible strain E. coli O1.
FIG. 4.

CKC of enoxacin for susceptible strain E. coli O1.
FIG. 5.

CKC of gentamicin for resistant strain E. coli O1.
FIG. 6.

CKC of enoxacin for susceptible strain E. coli O1 with a large inoculum.
Determination of bactericidal potency of enoxacin against different susceptible E. coli strains by CKC approach.
As shown in Fig. 4 and Fig. 5, the BC50 for the resistant strain was nearly 60 times higher than that for the sensitive one, and correspondingly, r was 90 times lower.
Determination of makeup of inocula composed of a mixture of different susceptible E. coli strains.
It is relatively straightforward to select resistant strains from within a culture of susceptible ones by using an antibiotic-containing medium. However, it is difficult to determine the ratio of reverted strains to susceptible strains present in a background of resistant strains by conventional methods for MBC determination. The inocula depicted in Fig. 4 and 5 were cultured simultaneously in enoxacin-containing media. Figure 7 shows an overlap between two sigmoidal curves that was distinct from the single sigmoidal curves generated by cultures of each of two pure strains. On the other hand, the CKC for a pure population is symmetrical, as shown above. According to the curve shape and the parameters N0, r, and BC50, it was possible to confirm the presence in the medium of two strains that differed in their susceptibilities to enoxacin at a ratio of about 5:3. This method therefore also provides a way to analyze the development and reversal of drug resistance.
FIG. 7.

CKC of enoxacin for mixed inocula of E. coli O1. ⋄, susceptible strain; ○, resistant strain.
Reproducibility of CKC approach.
The inoculum size for MBC determination is commonly 104 to 105 CFU, which is difficult to count in a plate (28). A 1,000-fold increase in the inoculum size has been calculated to increase the broth MIC by approximately fivefold (19, 35). However, the inoculum size has only a weak net effect on the antibacterial effects of ampicillin sulbactam, and trovafloxacin against E. coli (8, 10). However, in the present study, the inoculum size had little impact on the estimate of BC50. The bactericidal potency of enoxacin against a susceptible strain of E. coli at an inoculum ranging from 400 to 500 CFU/plate was determined with 10 replicates under a set of fixed conditions (data for Fig. 4). These experiments delivered an estimate for BC50 of 0.45 to 0.43 μg/ml, consistent with the average value 0.44 μg/ml (Fig. 4 and 8). Doubling of the inoculum size had little effect (Fig. 6). Therefore, we suggest that the method is both accurate and reproducible. The low coefficient of variation for BC50 implies that it requires only a single determination. In contrast, reproducibility levels tend to be low for MBCs. Although the inoculum size here is not consistent with that used by the conventional method, it is obvious for MBCs that vary over a wide range from 0.6 to 0.8 μg/ml (data from Fig. 4).
FIG. 8.

Change of BC50 versus inoculum size from 10 replicates (data are from Table 1).
Comparison of MBC, BC50, r, and BC1.
MBC is the minimum concentration at which no cell survives; that is, if N is equal to 0, according to the CKC function, x (MBC) cannot be determined as the minimum point. We have developed a fitted CKC equation (equation 4) and assigned each metric some biological meaning. What is left to derive is a theoretical basis for MBC. Many biological reactions show asymptotic effects, and commonly, EC50 is selected as an effect index, by analogy with Km (enzyme kinetics), the elimination half-life in pharmacokinetics, the EC50 in the frequently used sigmoidal maximum bactericidal effect (Emax) model, and the median toxic concentration and the median lethal concentration in pharmacodynamics (29, 33). In the present study, BC50 has been used to estimate bactericidal potency. As indicated in Table 1, MBC, BC50, r, and BC1 were derived from Fig. 2 to 6. BC50 and r are direct parameters of CKC, but they independently represent the median bactericidal concentration and the bactericidal intensity, respectively.
TABLE 1.
Comparison of MBC, BC50, and BC1 in various CKCs
| CKC | BC50 (μg/ml) | r | BC1 (μg/ml) | MBC range (μg/ml) | BC1/BC50 |
|---|---|---|---|---|---|
| Gentamicin for susceptible E. coli | 1.00 | 13.55 | 1.45 | 1.2-1.9 | 1.45 |
| Penicillin for susceptible E. coli | 130.3 | 0.16 | 171.1 | 166-186 | 1.31 |
| Enoxacin for susceptible E. coli | 0.44 | 20.34 | 0.74 | 0.6-0.8 | 1.68 |
| Enoxacin for resistant E. coli | 25.54 | 0.24 | 50.53 | 35-42 | 1.98 |
| Enoxacin for susceptible E. coli | 0.45 | 22.38 | 0.74 | 0.6-0.8 | 1.64 |
BC1, which is equal to BC50 + [ln(N0 − 1)/r], deduced from N0, BC50, and r, is the concentration of antibiotic at which only one colony survives; and in practice, BC1 is the lowest critical value of MBC over the range 0 < N < 1. BC1 is usually approximately twice the value of BC50 when r is small but is less than 2BC50 as r increases. The steep slope (rN0/4) at the inflexion point means that 2BC50 is much higher than BC1, so BC1 is a better alternative for MBC when the MBC occupies a wide range.
DISCUSSION
The CKC approach seems quite suitable for estimation of bactericidal pharmacodynamics.
It is generally recognized that in tests of the susceptibility of a bacterial population growing on agar challenged with an antibiotic(s), less susceptible colonies are designated as displaying resistance (28). In this context, the term “less or decreased susceptibility” is perhaps more appropriate as a description of the bacterial phenotype. Genetically, the phenotype can be the outcome of a gene mutation(s) or metabolic changes (18). The problem is how to distinguish these two different scenarios. Multiplex PCR assays can be useful for detection of the presence of antibiotic resistance genes (12, 22). However, this approach is not suited for the detection of resistance genes associated with multiple point mutations, and in this situation, resistant colonies need to be isolated and retested by the MIC test before DNA analysis (5). However, the CKC approach is effective in distinguishing the two possible scenarios. For example, as the concentration of enoxacin increased beyond 0.5 μg/ml (the BC50), the number of viable colonies per plate continuously decreased with an increase in the enoxacin concentration (Fig. 4). Did the survivors arise from a gene mutation or from physiological adaptation to metabolic changes? Mutations rarely occur under normal cultivation conditions: typically, 1 in ∼108 cells carries a detectable mutation in a given gene (38). The presence of an antibiotic is not necessary for the occurrence of antibiotic resistance mutations (36). Thus, the frequency of antibiotic resistance mutations in 500 cells is likely to be less than 10−6, so the occurrence of viable colonies during the CKC test is more likely to have been derived from physiological factors rather than from a gene mutation. As mentioned above, if a mutation occurs during incubation, it must have arisen from DNA doubling and is conditionally expressed after cell division. Only until the growth of wild-type cells increases to about 108 cells may a given mutation occur, and the mutated cells would be present among wild-type colonies and could not form new colonies by diffusion on the agar plate. The situation is quite different from that in liquid culture.
In general, whenever a mutation arises, it does not affect the number of surviving CFU from an inoculum of a given genotype challenged with a given concentration of drug, and in this way an accurate MBC can be obtained. Based on the same reasoning, variations in drug susceptibility can also be detected by the CKC method. This may be an important indicator for prediction of the probability of clinical success, because at concentrations greater than BC1 (or 2BC50), the wild-type population will have been killed and so the mutation for antibiotic resistance has no chance to propagate.
The biochemical mechanism of antibiotic bactericidal action and the molecular mechanism of antibiotic resistance have been well studied (23, 24, 32). Good quantitative analyses of the pharmacodynamics of antibiotics have been undertaken, in which time-kill curves and the postantibiotic effect are used to estimate the time-killing effect, while MIC and MBC are usually used to estimate the concentration-killing effect. The MIC at which 50% of isolates are inhibited (MIC50), the MIC90, and the MIC99 have sometimes been determined (6, 26, 29, 33, 37). However, information on the dynamics of the direct bactericidal effects of antibiotics on bacteria is fragmentary. Some problems, described below, arise when experimental data are fitted to conventional models.
The logistic equation 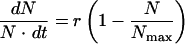 is used to describe microbial growth under limiting conditions, where 1 − (N/Nmax) is the retarding factor, Nmax is the maximum growth, N is the instantaneous growth, and t is time (17). From the model described by this equation, the change in bacterial number with time (the specific growth rate, r) cannot reflect the retarding factor of the drug concentration.
The interaction between a disinfectant and a bacterial population usually depends on the irreversible denaturation of bacterial cell proteins, which leads to rapid cell death. By plotting the survival rate for the colonies (y) against the concentration of disinfectant (x), the disinfection process can be well modeled by the following negative exponent function: y = (ab)/(b + x), where a and b represent the maximum bactericidal effect and median bactericidal concentration, respectively. On the other hand, the interaction between an antibiotic and a bacterial population usually reduces the cell growth rate rather than kills cells through the inhibition of vital enzyme activity and/or vital enzyme synthesis. The rate of colony survival decreases gradually at lower antibiotic concentrations but decreases rapidly at the threshold concentration range. Concentration-response models, including the Emax model, fit this sigmoidal curve and allow the EC50 of the bactericidal effect to be deduced, as shown below by using the data from Fig. 4.
The sigmoidal concentration-response (variable slope) equation is given by
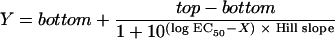 |
where concentration X is the logarithm of the concentration, and Y is the response (i.e., the number of bacteria killed; Y starts at the bottom, which is the minimum number of cells killed, and goes to the top, which is the maximum number of cells killed, in a sigmoidal shape); EC50 is the antibiotic concentration that provokes a response halfway between the baseline and the maximum (top) (25).
The Emax equation is given by
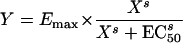 |
where Emax is the maximum bactericidal effect, i.e., all bacteria are killed; X is the drug concentration; EC50 is the concentration at which 50% of the maximum effect is measured; and s is the Hill slope or sigmoidicity coefficient (29).
The concentration-response equation and the Emax model are frequently used in general pharmacodynamics, but they both have serious shortcomings when they are applied to the interactions of bacteria with antibiotics (Table 2).
TABLE 2.
Comparison of three models used to describe the interaction between enroxacin and E. colia
| Model | Equation | Parameters
|
Goodness of fit
|
||||||||||||
|---|---|---|---|---|---|---|---|---|---|---|---|---|---|---|---|
| N0 (CFU/plate) | BC50 (μg/ml) | r | bottom (CFU/plate) | top (CFU/plate) | EC50 (μg/ml) | Hill slope | Emax (CFU/plate) | s | R2 | ASS | Sy.x | 95% CI of EC50/BC50 | % CVb of EC50/BC50 | ||
| CKC | 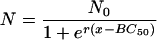 |
465 ± 6 | 0.440 ± 0.0036 | 20.34 ± 1.278 | 0.960 | 131,372 | 36.80 | 0.4328-0.4469 | 1.60 | ||||||
| Sigmoidal concn- response curve | 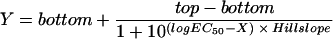 |
7 ± 8 | 482 ± 10 | 0.441 ± 0.0052 | 8.43 ± 0.758 | 0.949 | 247,030 | 46.15 | 0.4303-0.4510 | 2.34 | |||||
| Emax | 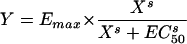 |
0.438 ± 0.0052 | 490 ± 11 | 8.25 ± 0.725 | 0.950 | 264,024 | 47.50 | 0.4279-0.4485 | 2.35 | ||||||
Data are from Fig. 4.
Relative CV = (high value of 95% CI − lower value of 95% CI)/(2× mean value).
First, the concentration (i.e., the log concentration of an antibiotic) starts from the minimum value, not from zero, i.e., a control with no antibiotics, because the irrational number log 0 is an out-of-fit calculation. This false increment added by bottom made Y start far above the 0 value. Therefore, more than 6 CFU/plate was killed with no antibiotics, which is against the findings obtained experimentally. EC50 is defined as the drug concentration that provokes a response halfway between the baseline response and the maximum response. EC50 will increase falsely when the 0 value is ignored and so heightens the baseline. In fact, when bottom is equal to 0, the concentration-response equation is equivalent to the Emax model, and the latter is more concise.
Second, MBC is already globally applied, so a new proposed means of determination of antibiotic potency and a standard for antibiotic potency are certainly required to analyze the link between antibiotic potency and MBCs. We cannot directly obtain the MBC information intuitively from the concentration-response curve.
Last, and most important, although a similar value of BC50 or EC50 can be obtained by each of the three models, the CKC has the smallest absolute sum of squares (ASS), standard deviation of the residuals (Sy.x), 95% confidence interval (CI), and coefficient of variation (CV; in percent), which means that the CKC method is statistically the more stable and accurate method.
The most important aspect of model design in biology is to ensure that the model is based on explicit biological assumptions and is mathematically tractable. We have introduced two concepts into the new equation (equation 4): the EC50 of the concentration-response equation and the retarding factor of the logistic equation. Therefore, the new equation is an improvement over both the concentration-response equation and the logistic equation. The equation for CKC is a variation of the logistic function and is consistent with the growth curves of bacteria in batch culture. Overall, the culture parameters (identity of drug, level of nutrition, metabolic product accumulation, and pH) are all equivalent as independent variables in the logistic equation. The growth curve represents the integration of these parameters with time. Further research on the biological bases of these growth functions will help our understanding of the interaction between bacterial populations and their environment from a dynamic point of view.
The mathematical and biological basis of CKC.
Although the equation fits CKC closely, revealed why MBC could not be accurately determined, and substantially described the biological meanings of BC50, N0, r, and BC1, what is its biological basis? Although the inocula were derived from a single cell, subsequent cell generations may not remain in phase during the process of subculture, and so some physiological diversity may develop. Care in the conduct of experimental procedures can be used to ensure the even distribution of the drug within each plate and to equalize the inoculum size and its distribution over the plate. In principle, a given MBC should be required for an antibiotic to kill a bacterium; otherwise, all the bacteria will survive and form a colony. However, the data and fitted curves from our experiments show that the bactericidal curve follows a sigmoidal behavior. We assume that, besides the genetic and physiological diversity, fluctuations in statistics may be operational at the micrometer scale of bactericidal action (13).
At the scale of a plate with a diameter of 9 cm, both drug molecules and bacteria are distributed evenly, and this can be demonstrated by the distribution of colonies. At the micrometer scale of a bacterial cell, however, the behaviors of individual drug molecules of nanometer size are governed by random thermal motion. When the drug concentration is low, there is only a small probability that a drug molecule and a given cell will come into the close physical contact required for the drug to kill the cell; but even at such low drug concentrations, these small numbers of drug molecules have very little chance to accumulate locally up to a lethal concentration. On the other hand, when the drug concentration is high, the chance of cell escape, and, therefore, the chance of cell survival, is low; but still, many drug molecules may concentrate elsewhere in the culture, leaving only a small probability of forming a drug-free cavity for cell survival. This is the reason why replicate measurements of MBCs are so variable. As the drug concentration increases, the probability that drug molecules reach a lethal concentration increases as a function modeled by a smooth sigmoidal curve. Therefore, we may imagine that the sigmoidal curve is derived from the tangent of the inflexion that is depressed from two ends by a fluctuation in statistics, i.e., the retarding factor.
However, the present study is limited to one aspect of in vitro experiments, and further research that includes pharmacokinetic-pharmacodynamic models is required (27). As reported by Aviles et al. (1), an in vitro dynamic system could constitute a powerful investigational tool prior to assessment of the efficacy of an anti-infective agent in animals and humans. We can therefore consider the advances in this area (16).
Acknowledgments
This work was carried out at the State Key Laboratory of Microbial Technology, Shandong University, Jinan, China, and was supported by Science & Technology Development grant 012100104 from the Department of Science and Technology of Shandong Province.
We acknowledge Lushan Wang, Lei Chen, and Yanliang Lin for performing the assays and Robert Koebner for linguistic correction of the manuscript.
REFERENCES
- 1.Aviles, P., C. Falcoz, M. J. Guillén, R. San Roman, F. Gómez De Las Heras, and D. Gargallo-Viola. 2001. Correlation between In vitro and in vivo activities of GM 237354, a new sordarin derivative, against Candida albicans in an in vitro pharmacokinetic-pharmacodynamic model and influence of protein binding. Antimicrob. Agents Chemother. 45:2746-2754. [DOI] [PMC free article] [PubMed] [Google Scholar]
- 2.Branson, E. 2001. Clinical relevance of minimum inhibitory concentrations. Aquaculture 196:289-296. [Google Scholar]
- 3.Christfilogiannis, P. 2001. Current inoculation methods in MIC determination. Aquaculture 196:297-302. [Google Scholar]
- 4.Drlica, K. 2003. The mutant selection window and antimicrobial resistance. J. Antimicrob. Chemother. 52:11-17. [DOI] [PubMed] [Google Scholar]
- 5.Dubin, D. T., J. E. Fitzgibbon, M. D. Nahvi, and J. F. John. 1999. Topoisomerase sequences of coagulase-negative staphylococcal isolates resistant to ciprofloxacin or trovafloxacin. Antimicrob. Agents Chemother. 43:1631-1637. [DOI] [PMC free article] [PubMed] [Google Scholar]
- 6.Ernst, J. E., E. E. Roling, C. R. Petzold, D. J. Keele, and M. E. Klepser. 2002. In vitro activity of micafungin (FK-463) against Candida spp.: microdilution, time-kill, and postantifungal-effect studies. Antimicrob. Agents Chemother. 46:3846-3853. [DOI] [PMC free article] [PubMed] [Google Scholar]
- 7.Feldman, H. A. 1972. Mathematical theory of complex ligand-binding system of equilibrium. Anal. Biochem. 48:317-338. [DOI] [PubMed] [Google Scholar]
- 8.Firsov, A. A., M. Ruble, D. Gilbert, D. Savarino, B. Manzano, A. A. Medeiros, and S. H. Zinner. 1997. Net effect of inoculum size on antimicrobial action of ampicillin-sulbactam: studies using an in vitro dynamic model. Antimicrob. Agents Chemother. 41:7-12. [DOI] [PMC free article] [PubMed] [Google Scholar]
- 9.Firsov, A. A., S. N. Vostrov, A. A. Shevchenko, and G. Cornagla. 1997. Parameters of bacterial killing and regrowth kinetics and antimicrobial effect examined in terms of area under the concentration-time curve relationships: action of ciprofloxacin against Escherichia coli in an in vitro dynamic model. Antimicrob. Agents Chemother. 41:1281-1287. [DOI] [PMC free article] [PubMed] [Google Scholar]
- 10.Firsov, A. A., S. N. Vostrov, O. Kononenko, S. H. Zinner, and Y. A. Portnoy. 1999. Prediction of the effects of inoculum size on the antimicrobial action of trovafloxacin and ciprofloxacin against Staphylococcus aureus and Escherichia coli in an in vitro dynamic model. Antimicrob. Agents Chemother. 43:498-502. [DOI] [PMC free article] [PubMed] [Google Scholar]
- 11.Firsov, A. A., S. N. Vostrov, I. Y. Lubenko, K. Drlica, Y. A. Portnoy, and S. H. Zinner. 2003. In vitro pharmacodynamic evaluation of the mutant selection window hypothesis using four fluoroquinolones against Staphylococcus aureus. Antimicrob. Agents Chemother. 47:1604-1613. [DOI] [PMC free article] [PubMed] [Google Scholar]
- 12.Franklin, R. C. 1999. Genetic methods for assessing antimicrobial resistance. Antimicrob. Agents Chemother. 43:199-212. [DOI] [PMC free article] [PubMed] [Google Scholar]
- 13.Gamow, G. 2002. One, two, three… infinity: facts and speculations of science. Recension translated by Y. N. Bao. Science Press, Beijing, China.
- 14.Gunnar, K., D. F. J. Brown, F. W. Goldstein, A. P. MacGowan, J. W. Mouton, A. Österlund, A. Rodloff, M. Steinbakk, P Urbaskova, and A. Vatopoulos. 2003. European harmonization of MIC breakpoints for antimicrobial susceptibility testing of bacteria. J. Antimicrob. Chemother. 52:145-148. [DOI] [PubMed] [Google Scholar]
- 15.Hyatt, J. M., D. E. Nix, and J. J. Schentag. 1994. Pharmacokinetics and pharmacodynamic activities of ciprofloxacin against strains of Streptococcus pneumoniae, Staphylococcus aureus, and Pseudomonas aeruginosa for which MICs are similar. Antimicrob. Agents Chemother. 38:2730-2737. [DOI] [PMC free article] [PubMed] [Google Scholar]
- 16.Jacqueline, C., B. Eric, P. Lucia, B. David, H. Antoine, C. Jocelyne, K. Marie-France, P. Gilles, and D. Bugnon. 2002. In vivo efficacy of continuous infusion versus intermittent dosing of linezolid compared to vancomycin in a methicillin-resistant Staphylococcus aureus rabbit endocarditis model. Antimicrob. Agents Chemother. 46:3706-3711. [DOI] [PMC free article] [PubMed] [Google Scholar]
- 17.Jensen, A. L. 1975. Comparison of logistic equation for population growth. Biometric 31:853-862. [PubMed] [Google Scholar]
- 18.Junichi, M., Y. Hisashi, M. Junko, F. Yoshiko, K. Sumiko, M. Shinzaburo, T. Yozo, W. Yasuo, and N. Hirokazu. 1997. Characteristics of quinolone-induced small colony variants in Staphylococcus aureus. J. Antimicrob. Chemother. 39:697-705. [DOI] [PubMed] [Google Scholar]
- 19.Lass-Flörl, C., C. Speth, G. Kofler, M. P. Dierch, E. Gunsilius, and R. Würzner. 2003. Effect of increasing inoculum sizes of Aspergillus hyphae on MICs and MFCs of antifungal agents by broth microdilution method. Int. J. Antimicrob. Agents 21:229-233. [DOI] [PubMed] [Google Scholar]
- 20.Lin, S., I. Y. Hsiao, and S. M. Hsu. 1997. Determination of the dissociation constant of phosvitin-anti-phosphoserine interaction by affinity capillary electrophoresis. Anal. Biochem. 254:9-17. [DOI] [PubMed] [Google Scholar]
- 21.Liu, Y. Q., Y. Z. Zhang, S. G. Liu, J. L. Jin, and P. J. Gao. 2003. Comparative inhibitory effects of sanhuang, berberine and gentamicin against E. coli. Chin. J. Environ. Biol. 9:302-306. [Google Scholar]
- 22.Martineau, F., F. J. Picard, N. Lansac, C. Ménard, P. H. Roy, M. Ouellette, and M. G. Bergeron. 2000. Correlation between the resistance genotype determined by multiplex PCR assays and the antibiotic susceptibility patterns of Staphylococcus aureus and Staphylococcus epidermidis. Antimicrob. Agents Chemother. 44:231-238. [DOI] [PMC free article] [PubMed] [Google Scholar]
- 23.McDermott, P. F., R. D. Walker, and D. G. White. 2003. Antimicrobials: modes of action and mechanisms of resistance. Int. J. Toxicol. 22:135-143. [DOI] [PubMed] [Google Scholar]
- 24.Morton, N. S. 2000. Impact of antimicrobial agents and chemotherapy from 1972 to 1998. Antimicrob. Agents Chemother. 44:2009-2016. [DOI] [PMC free article] [PubMed] [Google Scholar]
- 25.Motulsky, H. J., and A. Christopoulos. 2003. Fitting models to biological data using linear and nonlinear regression. A practical guide to curve fitting. Graph Pad Software Inc., San Diego, Calif.
- 26.Mouton, J. W., and J. G. D. Hollander. 1994. Killing of Pseudomonas aeruginosa during continuous and intermittent infusion of ceftazidime in an in vitro pharmacokinetic model. Antimicrob. Agents Chemother. 38:931-936. [DOI] [PMC free article] [PubMed] [Google Scholar]
- 27.Mouton, J. W., A. A. T. M. M. Vinks, and N. C. Punt. 1997. Pharmacokinetic-pharmacodynamic modeling of activity of ceftazidime during continuous and intermittent infusion. Antimicrob. Agents Chemother. 41:733-738. [DOI] [PMC free article] [PubMed] [Google Scholar]
- 28.Mouton, J. W. 2002. Breakpoints: current practice and future perspectives. Int. J. Antimicrob. Agents 19:323-331. [DOI] [PubMed] [Google Scholar]
- 29.Mouton, J. W., M. N. Dudley, O. Cars, H. Derendorf, and G. L. Drusano. 2002. Standardization of pharmacodynamics (PK/PD) terminology for anti-infective drugs. Int. J. Antimicrob. Agents 19:355-358. [DOI] [PubMed] [Google Scholar]
- 30.National Committee for Clinical Laboratory Standards. 2002. Performance standards for antimicrobial disk and dilution susceptibility tests for bacteria isolated from animals: approved standard, 2nd ed. NCCLS document M31-A2. National Committee for Clinical Laboratory Standards, Wayne, Pa.
- 31.Pfaller, M. A., R. N. Jones, and D. H. Walter. 2001. Proposed quality control guidelines for National Committee for Clinical Laboratory Standards susceptibility tests using the veterinary antimicrobial agent tiamulin. Diagn. Microbiol. Infect. Dis. 40:67-70. [DOI] [PubMed] [Google Scholar]
- 32.Poole, K. 2002. Mechanisms of bacterial biocide and antibiotic resistance. Appl. Microbiol. 31:55S-64S. [PubMed] [Google Scholar]
- 33.Rang, H. P., M. M. Dale, and J. M. Ritter. 1999. Pharmacology, 4th ed. Churchill Livingstone, Edinburgh, Scotland.
- 34.Rovati, G. E., D. Rodbard, and P. J. Munson. 1988. DESIGN: computerized optimization of experimental design for estimating Kd and Bmax in ligand binding experiments. I. Homologous and heterologous binding to one or two classes of sites. Anal. Biochem. 174:636-649. [DOI] [PubMed] [Google Scholar]
- 35.Smith, P., M. P. Hiney, and O. B. Samuelsen. 1994. Bacterial resistance to antimicrobial agents in fish farming: a critical evaluation of method and meaning. Annu. Rev. Fish Dis. 4:273-313. [Google Scholar]
- 36.Sniegowski, P. D. 1995. A test of the directed mutation hypothesis in Escherichia coli MCS2 using replica plating. J. Bacteriol. 177:1119-1120. [DOI] [PMC free article] [PubMed] [Google Scholar]
- 37.Spangler, S. K., M. R. Jacobs, and P. C. Appelbaum. 1997. MIC and time-kill studies of antipneumococcal activity of GV 118819X (sanfetrinem) compared with those of other agents. Antimicrob. Agents Chemother. 41:148-155. [DOI] [PMC free article] [PubMed] [Google Scholar]
- 38.Stanier, R. Y., J. L. Ingraham, M. L. Wheelis, and P. R. Painter. 1986. The microbial world, 5th ed., p. 238. Prentice-Hall, Englewood Cliffs, N.J.
- 39.Wheat, P. F. 2001. History and development of antimicrobial susceptibility testing methodology. J. Antimicrob. Chemother. 48:1-4. [DOI] [PubMed] [Google Scholar]