Abstract
Background
BK virus infection remains an important cause of loss of allograft function after kidney transplantation. We sought to determine whether polyfunctional T cells secreting multiple cytokines simultaneously, which have been shown to be associated with viral control, could be detected early after start of BK viremia, which would provide insight into the mechanism of successful antiviral control.
Methods
Peripheral blood mononuclear cells collected during episodes of BK viral replication were evaluated by multiparameter flow cytometry after stimulation by overlapping peptide pools of BK virus antigen to determine frequency of CD8+ and CD4+ T cells expressing 1 or more cytokines simultaneously, as well as markers of T cell activation, exhaustion, and maturation.
Results
BK virus controllers, defined as those with episodes of BK viremia of 3 months or less, had an 11-fold increase in frequency of CD8+ polyfunctional T cells expressing multiple cytokines, as compared with patients with prolonged episodes of BK viremia. Patients with only low level BK viremia expressed low frequencies of polyfunctional T cells. Polyfunctional T cells were predominantly of the effector memory maturation subtype and expressed the cytotoxicity marker CD107a.
Conclusions
Noninvasive techniques for immune assessment of peripheral blood can provide insight into the mechanism of control of BK virus replication and may allow for future patient risk stratification and customization of immune suppression at the onset of BK viremia. 5
Introduction
BK virus associated nephropathy (BKN) is an important cause of loss of allograft function after kidney transplantation with prevalence ranging from 1–10% (1). BK viremia occurs with an incidence of 13 to 22% and may cause ureteric stricture after kidney transplantation (2). However, even with utilization of PCR-based diagnostic methods, BKN continues to negatively impact graft function (3). Without an effective, nonnephrotoxic antiviral, the mainstay of therapy is reduction in immunosuppression, which is not universally effective (1,4,5). A central question in the field, therefore, is why some patients are able to control viral replication, while others experience persistent BK viremia with progression to BKN (6). In addition, treatment via reduction in immunosuppression may trigger acute rejection (5).
Previous studies measuring the cellular immune response to BK virus antigen have shown an association between increased interferon-γ (IFN-γ) expression and control of BK viremia (7,8). These studies, however, are limited by use of Elispot technology, which permits examination of a single cytokine, thereby lacking the ability to characterize the cell type responding to BK virus antigen. Use of flow cytometry to analyze intracellular cytokine secretion provides simultaneous identification of surface markers and measurement of multiple cytokines, for a richer evaluation of the antiviral immune response (9).
BK virus stimulation performed using overlapping peptide pools representing the 5 expressed BK virus proteins tAg, TAg, VP-1, VP-2, and VP-3 has demonstrated improved sensitivity to detect polyfunctional T cell response as compared with single antigen stimulation (10). However, this approach has not been tested in real time at the onset of BK viremia. Both polyfunctional T cell response and C107a expression have been shown to play a role in control of other chronic viral infections including CMV, hepatitis C, and HIV (11–14). In contrast, persistent uncontrolled viral infection is associated with exhaustion, with expression of programmed cell death 1 (PD-1) inhibitory receptor related to the inability to control infection (15,16) .
We characterized the anti-T cell BK virus response concurrent with BK viremia to better understand immune mechanisms of viral control and promote exploration of noninvasive testing methods to monitor development of effective BK virus immune response.
Materials and Methods
Study population
We identified 22 patients with BK viremia detected by routine surveillance with samples available for testing who were enrolled in in an observational study approved by the UCLA Institutional Review Board. Blood samples were drawn during clinic visits; a total of 1–4 blood samples were obtained during periods of BK viremia, with an average of 2 samples per patient. Peripheral blood mononuclear cells (PBMCs) were isolated using previous published methods and frozen to allow for batched testing (9). Time points were classified as previremia, early viremia (first sample collected after viremia onset), midviremia (subsequent samples during viremia), or postviremia.
Clinical care
Induction immunosuppression with antithymocyte globulin (ATG) was utilized for patients at increased risk for rejection (panel reactive antibodies >20%, history of donor specific antibodies, positive crossmatch, cold ischemia time > 24 hours, or donation after cardiac death); others received basiliximab. Maintenance immunosuppression was with tacrolimus, mycophenolate mofetil (MMF), and prednisone. MMF and prednisone doses were similar in each patient, and tacrolimus was started at equivalent doses per kg body weight with similar target drug levels in each patient (Table 1). Patients received valganciclovir prophylaxis for CMV for 6 months for high risk (donor positive, recipient negative) and 3 months for low risk (recipient positive) patients. BK virus PCR was performed monthly for the first 6 months, at months 9 and 12, and then annually up to 5 years posttransplantation (Nanogen BK virus ASR). BK virus surveillance of the urine was not routinely done. Patients with BK virus PCR levels >1000 copies/ml underwent a stepwise reduction of immunosuppression starting with discontinuation of MMF administration, followed by decrease in tacrolimus dosing to 1-half of previous level. Ciprofloxacin or leflunomide were added for persistent viremia or biopsy-proven BKN at the discretion of the treating physician.
Table 1.
Demographic characteristics of patients analysed
| Controller (n=10) |
Non- controller (n=8) |
Low level viremia (n=4) |
p- value† |
|
|---|---|---|---|---|
| Age, median (range) (yrs) | 51.5 (28–62) | 51.5 (30–65) | 50.5 (36–58) | 0.638 |
| Sex (% female) | 30.0 | 37.5 | 50.0 | 0.779 |
| Diabetes | 40.0 | 37.5 | 0.0 | 0.318 |
| Deceased donor | 70.0 | 50.0 | 50.0 | 0.314 |
| Class I PRA (mean) (SD) (%) | 25.2 (40.7) | 6.0 (11.1) | 0.0 (0.0) | 0.240 |
| Class II PRA (mean) (SD) (%) | 9.5 (20.1) | 0.9 (2.5) | 0.0 (0.0) | 0.347 |
| Number of HLA mismatches (mean) (SD) | 3.7 (1.6) | 5.0 (1.2) | 3.5 (2.7) | 0.210 |
| Induction ATG (%) | 50.0 | 25.0 | 50.0 | 0.518 |
| Acute Rejection (%) | 10.0 | 25.0 | 25.0 | 0.662 |
| Median tacrolimus Level (range) | 9.1 (6.1–13.1) | 10.0 (4.1–12.6) | 9.2 | 0.784 |
| Median cyclosporine Level | N/A | N/A | 813 | N/A |
| Median daily MMF dose, mg (range) | 1500 (0–2000) | 500 (0–2000) | 1000 (0–2000) | 0.932 |
| Median daily prednisone dose, mg (range) | 5 (5–15) | 5 (2–18) | 5 (5) | 1.000 |
Abbreviations: yrs, years; SD: Standard deviation; MMF: mycophenolate mofetil. Only one patient was on cyclosporine at the time of BK viremia start.
p-value is for Kruskal-Wallis for numeric data, chi square for categorical data
Length of episode of viremia was defined from first level detectable at >625 copies/ml to the last level detectable at >625 copies/ml. Low level viremia was defined in patients whose BK PCR never exceeded 1000 copies/ml. Patients were defined as controllers if BK viremia returned to <625 copies/ml within 3 months of the first detectable viral load, and as noncontrollers if viremia extended for greater than 3 months, following the definition of Trydzenskaya et al (10). Days of viremia were calculated at the end of the study observation period. Biopsies were performed for unexplained rise in serum creatinine (SCr), and diagnosis of BK virus associated nephropathy and acute rejection was determined based on the Banff 2007 classification of renal allograft pathology (17). There were 9 blood samples collected prior to onset of BK viremia and 44 samples available for analysis collected during viremia or up to 3 months after viremia including 19 from BK virus controllers and 19 from noncontrollers, with an additional 6 samples analyzed from patients with low level viremia. Expression of BK-virus specific T cells was analyzed for samples collected during or immediately after resolution of BK viremia.
Flow cytometry
Thawed PBMCs were allowed to rest overnight at 37°C prior to incubation for 8 hours in the presence of monoclonal anti-CD28 and anti-CD49a antibodies (CD28/CD49d, BD Biosciences) and Brefeldin A (Golgi plug, BD Biosciences); a minimum of 50,000 lymphocytes were analyzed in each experiment. Positive control was incubation with Staphylococcus enterotoxin B (SEB) (Sigma). Samples were only used if they exceeded 0.5% IFN-γ+/TNF-α+ CD3+ cells after SEB stimulation; 8 samples were not utilized due to failing to meet this standard. Negative control was performed with absence of antigen-specific stimulation, incubating in otherwise identical conditions. Thawed PBMCs were incubated with overlapping 15 amino acid peptide pools representing BK virus proteins tAg, TAg, VP-1, VP-2, and VP-3 (JPT Peptide Technologies) at a concentration of 5ug/ml. Cells were stained for surface markers and then fixed and permeabilized for intracellular cytokine staining. The following fluorochrome-tagged antibodies were used: PCP-Cy5-CD3, PE-CF 594-CD4, APC-H7-CD8, FITC-IFNγ A700-TNFα, PE-IL-2, PE-Cy7-CCR7, Qdot655-CD45RA, APC-CD56, BV421-CD107a. Live cells were identified using Aqua fluorescence live/dead stain (Life Technologies); lymphocyte populations were identified based on appearance on light scatter parameters, followed by gating on CD3+ expression. Detection was performed using the BD LSR Fortessa (BD) flow cytometer with data analysis by FlowJo software. Boolean gating was used to determine the frequencies of single-, double-, and triple-cytokine secreting cells (representative experiment shown in Supplemental Figure 1). Frequency of BK-specific T cells was calculated by subtracting the frequency of cells detected in the absence of stimulation, to correct for background staining. Samples from 18 patients were evaluated by anti-CD107a antibody (BioLegend). Samples from 13 patients were analyzed by PD-1 antibody (BioLegend). Total frequency of polyfunctional cells was determined by summing the total number of all double and triple positive CD4+ or CD8+ T cells secreting IFN-γ, TNF-α, and/or IL-2, adjusting to prevent counting cell populations more than once. Maturation subtyping used CD45RA+/ CCR7+ to define the naïve cell population, CD45RA-/ CCR7+ for central memory, CD45RA-/ CCR7- for effector memory, and CD45RA+/ CCR7- for the terminally differentiated effector memory T cell population.
Statistical analysis
JMP Pro Version 10.0 was used to perform Kruskal-Wallis or Wilcoxon rank sum test, as appropriate, for all numeric continuous variables, as these exhibited a nonparametric distribution. Other statistical analyses were performed using SAS Enterprise Guide 5.1. Logistic regression was performed by backwards elimination with a specified stay significance level of 0.05, which was also used for generation of ROC curves. Mixed effect analysis used variance components covariance structure in an unstructured model, with restricted maximal likelihood estimation. Logarithmic transformation was performed to correct for skewness of the data prior to logarithmic regression analysis, with 0.1 added to each value prior to transformation so that zero values would not result in missing data. Primary comparison was performed to analyze differences between BK virus controllers versus noncontrollers. Correction for multiple comparisons was not performed due to the small size and exploratory nature of this study. A p-value of 0.05 or less was considered statistically significant. Because of the limitations of the relatively small sample size, descriptive analyses were also included where appropriate.
Results
Patient characteristics
There was no significant difference between BK virus controllers, noncontrollers, and those with only low level viremia by patient age, deceased versus living donor, and treatment for rejection (Table 1). Pre-transplant percentage of Class I and Class II PRA, degree of HLA mismatch, median tacrolimus level, MMF dosing, and use of ATG for induction also did not differ significantly between patient groups, although it is possible that with a larger patient group, an association might be seen.
Higher peak copy number of BK virus was seen in the noncontroller as compared with the controller group (p=0.015) (Table 2). Median time of viremia start was similar between controller and controllers’ groups (57.5 and 53.0 days, respectively) but longer in low level viremia patients (196.5 days after transplantation). Both absolute lymphocyte count (ALC) and SCr were similar at onset of BK viremia in all 3 groups. By definition, noncontrollers had longer episodes of BK viremia, with a median length of viremia of 154 days as compared with 45.5 days for controllers. Noncontrollers were more likely to be treated with drugs directed at viral replication (ciprofloxacin or leflunomide), with 87.5% receiving treatment as compared with only 30% of controllers (p=0.007). There was no significant difference in IFN-γ/TNF-α expression after positive control SEB stimulation between patient groups (Supplemental Figure 2).
Table 2.
Characteristics of episodes of BK viremia by patient group.
| Controller (n=10) |
Non- controller (n=8) |
Low level viremia (n=4) |
p-value† | |
|---|---|---|---|---|
| Peak viremia, median (range)(copies/ml) | 10,073 (1,055–87,470) | 207,030 (2,704–4,537,376) | 625 (625–793) | 0.001 |
| Time post transplant at onset of viremia, median (range) (days) | 57.5 (21–273) | 53.0 (18–285) | 196.5 (61–351) | 0.071 |
| ALC at onset viremia, 103/µL, median (range) | 1.4 (0.2–2.1) | 0.6 (0.4–1.0) | 1.6 (0.8–2.4) | 0.081 |
| SCr at onset viremia, mg/dL, median (range) | 1.5 (0.7–2.0) | 1.9 (0.4–2.6) | 1.3 (0.6–1.8) | 0.262 |
| Days viremia, median (range) § | 45.5 (28–88) | 154.0 (101–723) | 30.0 (15–49) | ¶ |
| Immunosuppression reduced (%) | 100.0 | 100.0 | 25.0 | <0.001 |
| Received Drugs for BK treatment (%) | 30.0 | 87.5 | 0.0 | 0.007 |
| Underwent Kidney biopsy during viremia % | 50.0 | 87.5 | 0.0 | 0.015 |
| Incidence BKN (%) | 0.0 | 25.0 | 0.0 | 0.146 |
| Loss of graft function (%) † | 0.0 | 12.5 | 0.0 | 0.400 |
p-value is for Kruskal-Wallis test for numeric data, chi square for categorical data for all 3 categories.
Not analyzed for statistical significance as groups are defined by length of viremia.
Days viremia at end of observation period, 3 noncontrollers still exhibited detectable viremia at this time.
Loss of graft function defined as need to return to dialysis
Frequency of BK-virus specific CD4+ and CD8+ cells
BK virus-specific intracellular cytokine secretion was evaluated from time points during early, mid, and first month after viremia resolution. Frequencies of monofunctional IFN-γ positive BK virus specific CD4+ T cells were higher for controllers versus noncontrollers with a median frequency of 0.05% versus 0%, respectively (p=0.02). For IFN-γ positive CD8+ T cells there was a trend towards higher median frequencies in the controller versus noncontroller groups that did not reach statistical significance, with a median frequency of 0.11% versus 0.04%, respectively (p=0.07) (Figure 1A and B). No statistically significant difference was seen for TNF-α or IL-2 monofunctional T cells. For low level viremia patients, frequencies of IFN-γ positive CD8+ T cells were similar to those observed in controllers (median frequency 0.16%).
Figure 1. Increased frequency of IFN-γ secreting T cells in BK virus controllers versus noncontrollers after viremia start.
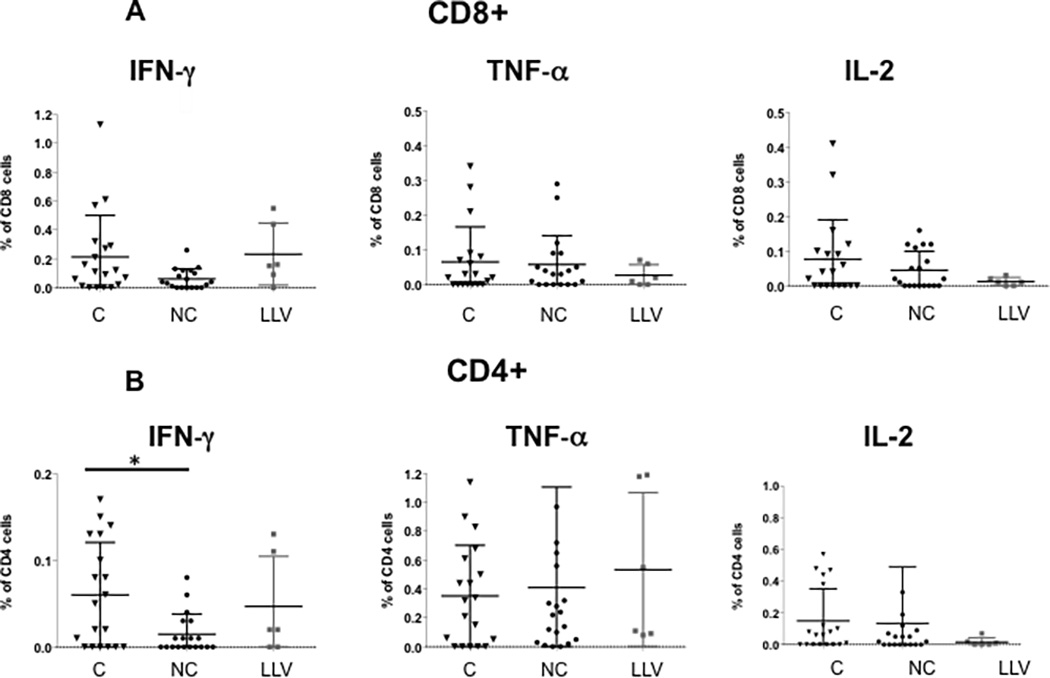
PBMCs were incubated with overlapping peptide pools representing all 5 BK virus expressed proteins and analyzed by intracellular cytokine analysis. Panel A shows frequency of BK virus-specific CD8+ T cells expressing single cytokines IFN-γ, TNF-α, and IL-2. Panel B shows frequency of BK virus-specific CD4+ T cells expressing single cytokines IFN-γ, TNF-α, and IL-2. Double asterisk indicates p<0.01, single asterisk indicates p<0.05. Controllers are indicated by triangles, noncontrollers by circles, and patients with low level viremia by grey squares.
Analysis of double cytokine secreting cells showed statistically significantly higher levels in controllers as compared with noncontrollers and low level viremia patients for CD8+ IFN-γ/TNF-α with a median frequency of 0.11% versus 0.01% and 0.02%, respectively (p=0.006). For TNF-α/IL-2 T cells a similar pattern was observed (p=0.02) (Figure 2A). For double cytokine secreting CD4+ T cells, there was no difference between groups (Figure 2B).
Figure 2. Increased frequency of double-cytokine and total polyfunctional CD8+ T cells in BK virus controllers versus noncontrollers after viremia start.
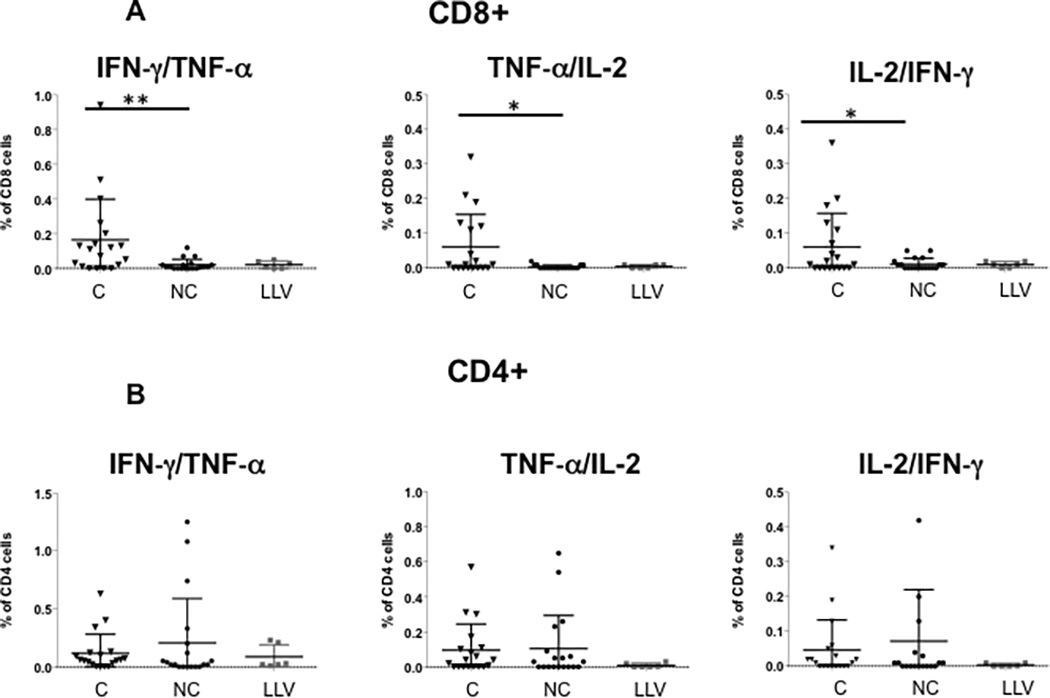
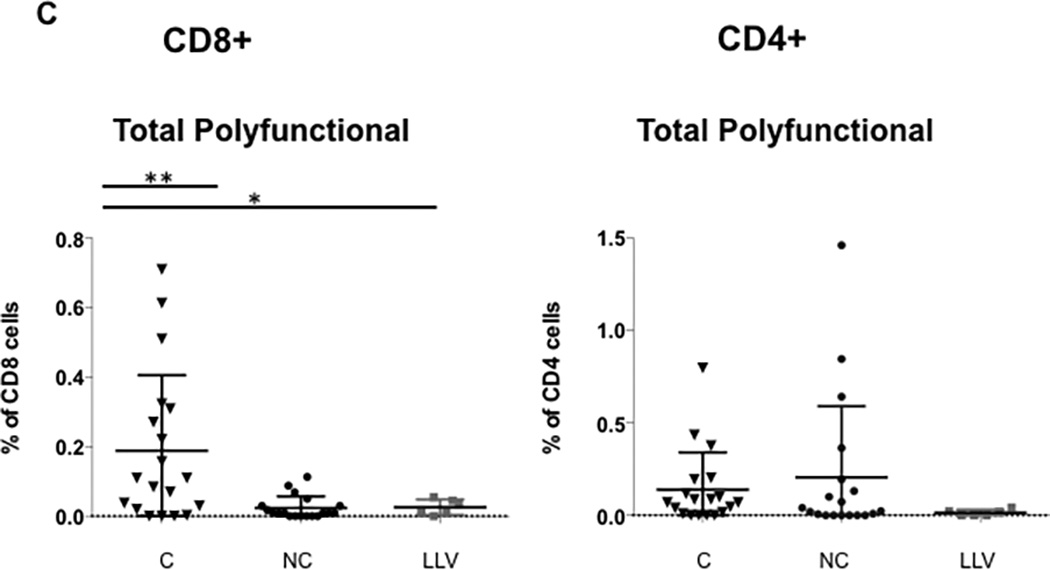
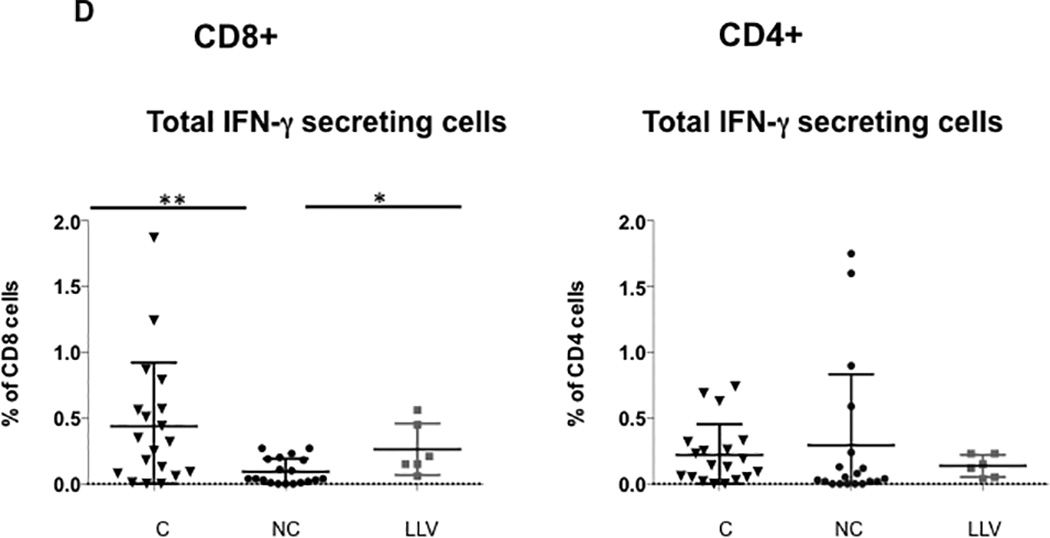
Panel A shows the frequency of BK virus-specific CD8+ T cells expressing at least two cytokines simultaneously. Panel B shows the frequency of BK virus-specific CD4+ T cells expressing at least two cytokines simultaneously. Panel C shows frequency of BK virus-specific total polyfunctional CD8+ T cells (sum of double and triple cytokine secreting cells) and total polyfunctional CD4+ T cells. Double asterisk indicates p<0.01, single asterisk indicates p<0.05. Controllers are indicated by triangles, noncontrollers by circles, and patients with low level viremia by grey squares. Panel D shows the frequency of the total population of CD8+ or CD4+ T cells secreting IFN-γ, regardless of single, double, or triple-cytokine secretion status.
The frequency of the total polyfunctional CD8+ T cells (sum of all double and triple cytokine secreting cells) was significantly higher in the controller group, with a median of 0.11% as compared with 0.01% for noncontrollers (11-fold increase) and 0.02% (5.5-fold increase) for low level viremia patients (p=0.004 controller versus noncontroller) (Figure 2C). Although most controllers had persistently elevated frequencies of total polyfunctional cells during BK viremia, in 7 patients this elevation was only transiently detected, with total CD8+ polyfunctional T cell frequencies of <0.1% occurring just before or after higher levels, suggesting that the appearance of polyfunctional T cells was time-limited.
To correct for the effect of measuring multiple samples from each sample, a mixed effect model was used, and also demonstrated a significant association between frequency of polyfunctional CD8+ T cells and controller versus noncontroller status (p=0.002). In addition, restricting analysis to 1 sample per patient (first sample collected after viremia start), there was still a significant increase in total polyfunctional CD8+ T cells in controllers (0.09%) as compared with noncontrollers (0.01%) (p=0.025). Frequency of total polyfunctional CD8+ T cells was not associated with tacrolimus level either at initial diagnosis of BK viremia or at subsequent time points (data not shown).
The frequency of BK virus specific CD8+ T cells expressing IFN-γ in any combination (monofunctional plus polyfunctional cells) was also enriched in controllers as compared with nonconcontrollers (0.32% compared with 0.04%, p=0.007) (Figure 2D). In comparison to total polyfunctional CD8+ T cells, there was not statistically significant difference between the controller and low level viremia groups. There was no significant difference in frequency of BK virus specific CD4+ T cells expressing IFN-γ (Figure 2D).
Expressing the percentage of each combination of cytokine secretion as a pie chart demonstrates the greater richness of polyfunctional CD8+ T cell expression in the controller as opposed to the noncontroller patients (Figure 3A). In addition, expressing single-, double-, and triple-cytokine secreting T cells as percentage of total BK virus specific T cells similarly demonstrated a statistically significant increase in in IFN-γ/TNF-α and TNF-α/ IL-2- secreting cells in the controllers versus noncontroller groups (Figure 3B).
Figure 3. Increased percentage of double-cytokine expressing CD8+ T cells in controllers versus noncontrollers.
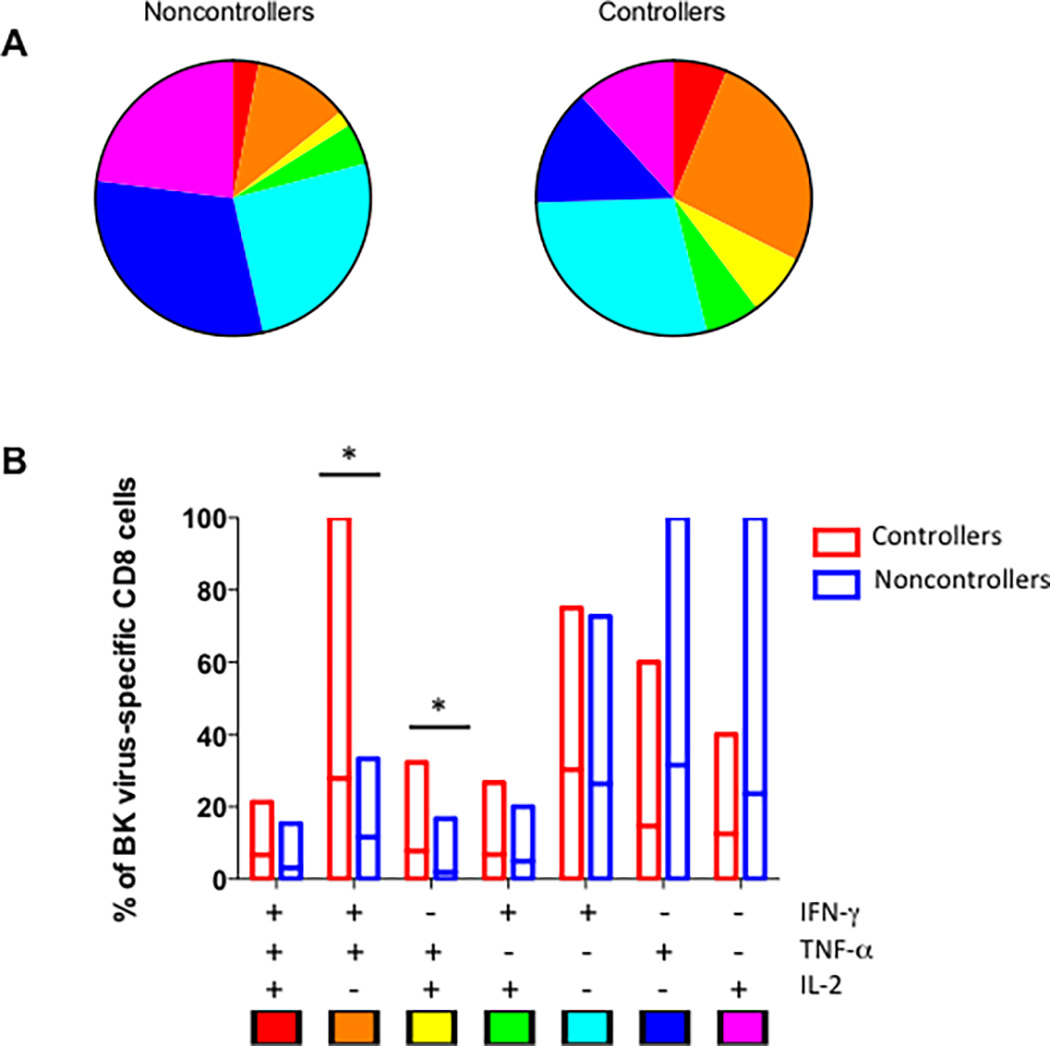
Panel A shows the breakdown of all BK virus specific CD8+ T cells for controllers (right) and noncontrollers (left) by percentage of triple, double, and single cytokine secreting cells by each combination of cytokines. Key is indicated at the bottom of panel B. Panel B shows the mean and range of percentages for each combination of cytokine expression patter in bar graph form, with controllers shown in red and noncontrollers in blue. Single asterisk indicates p<0.05 by Wilcoxon test.
For CD4+ total polyfunctional T cells, higher median frequencies were seen in controllers (0.07%) versus noncontrollers (0.02%) or low level viremia patients (0.01%), but this difference did not reach statistical significance, and interestingly, some of the highest frequencies were seen in the noncontroller group (Figure 2C). When only triple cytokine secreting cells were analyzed, higher median frequencies were seen in the CD8+ or CD4+ T cells in controllers versus noncontrollers, with a trend towards statistical significance for CD8+ cells (p=0.06) (Supplemental Figure 3). Analysis of NK cell cytokine expression after BK virus antigen stimulation revealed only modest stimulation over background levels, with no difference in frequency of cytokine expression in controller versus noncontroller patients (data not shown).
Attempt at prediction of controller status
Analysis of the frequency of total polyfunctional CD8+ T cells by logistic regression revealed that this attribute was associated with controller status, with OR 2.56 (95% confidence interval 1.33–4.93, p=0.005). When other patient attributes with potential influence on virus control based on previous studies, namely, type of induction, living versus deceased transplant, and patient age, were added to the logistic regression model by backward elimination, only log total polyfunctional CD8+ T cells was retained in the final model (Table 3). This analysis is limited by the small sample size, and is included primarily as a test of the strength of the immunologic analysis in combination with demographic characteristics.
Table 3.
Logistic regression analysis of controller status.
| Single variable | p-value | Multi-variable | p-value | |
|---|---|---|---|---|
| BK virus specific polyfunctional CD8+ T cells | 2.56 (1.33–4.93) | 0.005 | 2.56 (1.33–4.93) | 0.005 |
| Age | 0.96 (0.91–1.02) | 0.169 | 1.00 (.93–1.07) | 0.941 |
| Induction (basiliximab v ATG) | 2.52 (0.65–9.83) | 0.183 | 1.75 (0.33–9.30) | 0.512 |
| Living versus deceased donor | 2.41 (0.64–9.03) | 0.193 | 2.26 (0.44–11.5) | 0.327 |
Odds ratio (OR) is indicated followed by 95% confidence interval. Variables with p-value <0.05 highlighted in bold.
BK virus specific T cells in the absence of BK viremia
Analysis of 4 patients with no evidence of BK viremia with blood samples collected at similar time points after transplantation demonstrated very low levels of BK virus specific polyfunctional T cells, at levels similar to the noncontroller and low level viremia patient groups, with median frequency of total polyfunctional CD4+ and CD8+ T cells of 0.02% and 0.03%, respectively. BK virus-specific monofunctional T cells were also found in low frequency in the peripheral blood of these patients, with <0.01% IFN-γ and TNF-α positive CD8+ and CD4+ cells, and IL-2-expressing CD4+ and CD8+ T cells of 0.09% and 0.05%, respectively.
Time course of BK virus-specific T cell development
Pre-viremia CD4+ and CD8+ T cells expressed a very low to undetectable frequency of polyfunctional BK virus specific cells (Figure 4). However, by the time of the first blood sample with detectable BK viremia, polyfunctional CD8+ T cells could be detected in significantly higher frequency in controllers as compared with noncontrollers (Figure 4). Mid-viremia samples showed the highest frequency of polyfunctional CD8+ T cells (median frequency 0.21%), which decreased but were still detectable during post-viremia (median frequency 0.10%). Polyfunctional CD8+ T cells were detected at a median of 22 days after onset of viremia, and peaked at 47 days after onset of viremia. There was a median number of 12 days between the first appearance of CD8+ polyfunctional T cells and decrease in BK viremia, and 1 day between the peak level of CD8+ polyfunctional T cells and BK viremia decrease (data not shown).
Figure 4. Increased frequency of polyfunctional T cells in BK virus controllers versus noncontrollers over time.
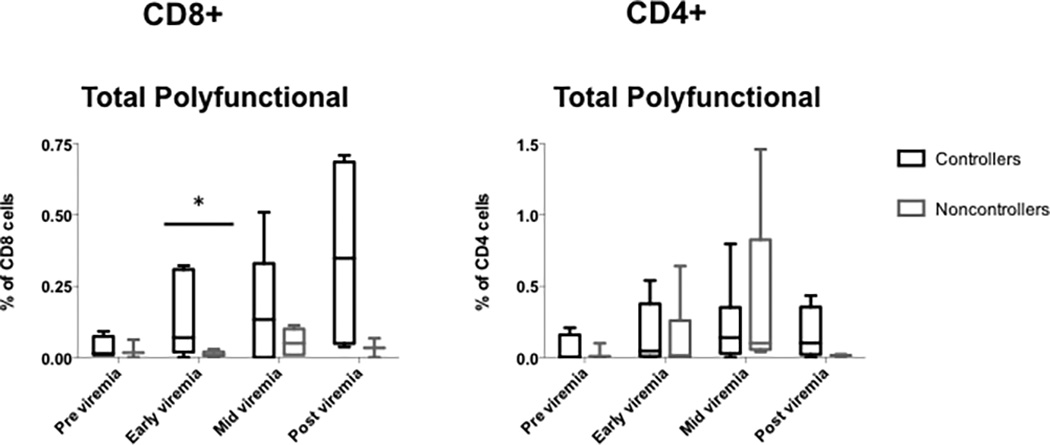
PBMCs were incubated with overlapping peptide pools representing all 5 BK virus expressed proteins and analyzed by intracellular cytokine analysis. Differences in frequency of CD4+ and CD8+ T cells were seen over time in the controller versus noncontroller or low level viremia groups. Box and whiskers plot drawn using the Tukey method. Panel A, total polyfunctional CD8+ T cells. Panel B, total polyfunctional CD8+ T cells. Single asterisk indicates p<0.05 by Wilcoxon test. Controllers are indicated in black, and noncontrollers in grey.
An inverse relationship was observed between the frequency of total polyfunctional CD8+ cells and days of BK viremia (p=0.032), with higher frequency of polyfunctional cells associated with shorter length of viremia regardless of controller status classification. This association was not seen for total polyfunctional CD4+ cells. In confirmatory analysis, a mixed effect model accounting for repeated measures per patient also showed significant relationship between days of BK viremia and frequency of total polyfunctional CD8+ cells (p=0.002), and this association remained when patient age, donor type (living versus deceased), and induction type (basiliximab versus ATG) were added to the model (p=0.005). For patients who never demonstrated a CD8+ total polyfunctional T cell frequency of >0.1%, median length of viremia was 103 days, as compared with 45.5 days for those with CD8+ total polyfunctional T cell frequency of >0.1%, although this difference did not reach statistical significance (p=0.092).
BK virus control and markers of activation and exhaustion
The cytotoxicity marker CD107a was detected in BK virus specific CD3+ cells expressing two cytokines (IFN-γ and TNF-α) in 71.2% of controller as compared with 31.4% of noncontroller patients (p=0.03) (Figure 5A). This difference was no longer statistically significant when sub-setted for CD8+ double cytokine secreting T cells, although a trend remained towards higher CD107a secretion in controllers compared with noncontrollers (95.4% versus 41.7%). No difference was seen in the frequency of CD107a expression for IFN-γ or TNF-α single cytokine secreting CD3+, CD8+, and CD4+ T cells (data not shown). PD-1 expression, in contrast, did not differ by controllers or noncontroller status secreting two cytokines (Figure 5B), or for IFN-γ or TNF-α single cytokine secreting CD3+, CD8+, and CD4+ T cells, although there was a trend towards increased PD-1 expression in TNF-α secreting CD4+ T cells (data not shown). Non-BK virus specific PD-1 expression also did not differ by patient group (Figure 5C).
Figure 5. Increased frequency of CD3+, CD8+, and CD4+ T cells expressing CD107a and PD-1 in BK virus controllers versus noncontrollers.
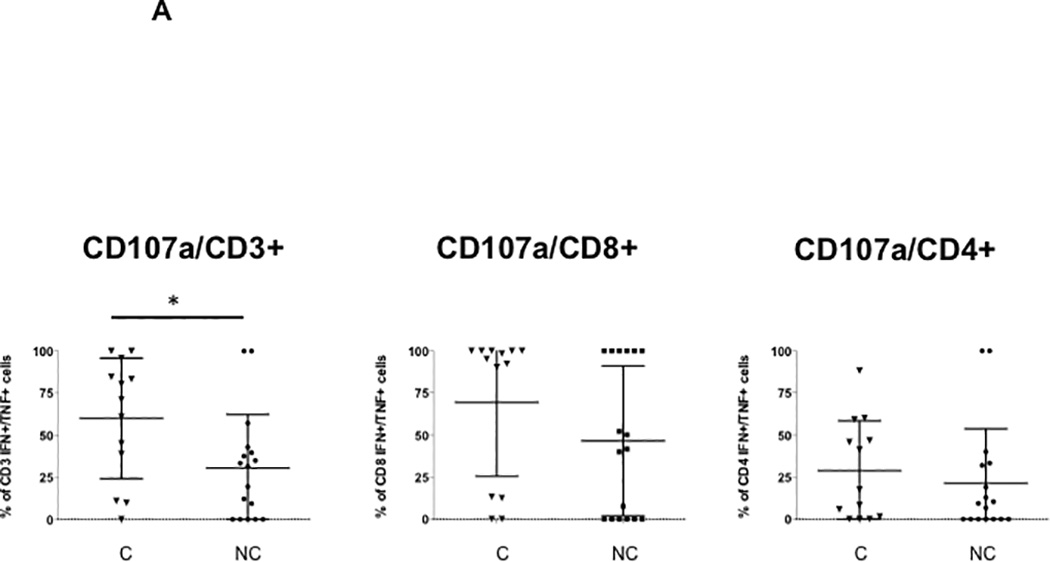

PBMCs were incubated with overlapping peptide pools representing all 5 BK virus expressed proteins and analyzed by intracellular cytokine analysis. Panel A shows the percentage of CD107a positive BK virus-specific cells expressing IFN-γ and TNF-α is shown for CD3+, CD8+, and CD4+ T cells, as indicated. Panel B shows the percentage of PD-1 positive BK virus-specific cells expressing IFN-γ and TNF-α. Panel C shows total percentage of total PD1+ CD8+ or CD4+ T cells. Controllers are indicated by triangles, and noncontrollers by circles.
BK virus control and maturation phenotype
Among BK virus-specific CD8+ and CD4+ cells secreting IFN-γ and TNF-α in controllers, the most common maturation type was effector memory (Figure 6A), analyzing T cells collected during both the pre- and during viremia time points. Noncontrollers are not shown because the very low frequencies of double-cytokine expressing T cells made evaluation of maturation subgroups unreliable.
Figure 6. T cell maturation phenotype for BK virus specific and non-BK virus specific T cells.

In Panel A, PBMCs from controllers were incubated with overlapping peptide pools representing all 5 BK virus expressed proteins and analyzed by intracellular cytokine analysis. Cells expressing IFN-γ and TNF-α after BK virus stimulation were evaluated by cell surface staining to differentiate CD4+ and CD8+ T cells into naïve, central memory, effector memory, and terminally differentiated cell types for CD8+ and CD4+ T cells. In Panel B, cell surface staining was used to differentiate CD4+ and CD8+ T cells into naïve, central memory, effector memory, and terminally differentiated cell types without prior antigen stimulation to evaluate the total T cell population. Controllers are indicated in black and noncontrollers in grey.
Analysis of maturation phenotype independent of BK virus specificity revealed a preponderance of native CD8+ and CD4+ T cells in both controllers and noncontrollers (Figure 6B). Analysis by patient age revealed an inverse relationship between recipient age and percentage of naïve CD4+T cells (p=0.002) and a direct relationship between recipient age and percentage of central memory T cells (p=0.011), irrespective of controller versus noncontroller status.
Discussion
Our studies may be the first to demonstrate a significant difference in the BK virus immune response early after start of BK viremia in viral controllers compared with noncontrollers by analysis of polyfunctional BK virus-specific CD8+ T cells. This difference was measurable at BK virus diagnosis, prior to reduction in immunosuppression. This observation provides insight into the mechanism of BK virus control in kidney transplant recipients, and noninvasive monitoring of T cell characteristics shows promise in prediction of protective antiviral immunity (18). This observation is distinct from that seen in previously studies of BK virus specific T cells where blood samples were evaluated months of resolution of viral replication (10). In addition, the use of flow cytometry with multiple antigens used for stimulation may provide the ability to detect differences between clinical groups earlier in the course of viremia as compared with use of single cytokine Elispot testing, a strategy which has led to detection of anti-BK virus response peaking at 25 weeks after BK virus reactivation (19).
This data suggests a model of BK virus control where monofunctional cytokine expressing T cells are effective in suppressing low levels of BK viremia, but for control of higher levels (>1000 copies/ml) of viral replication, polyfunctional CD8+ T cells expressed early after start of viremia are essential for BK virus clearance and avoidance of the persistent allograft inflammation which leads to BKN, fibrosis, and ultimately loss of allograft function. Studies of gene expression during BK viremia and BKN have shown upregulation of cytotoxic T cell as well as NK cell-associated transcripts (20). In contrast to the predominantly CD8+ T cell response observed in our study, other investigators have found the polyfunctional CD4+ T cell response to be upregulated during viral replication (21,22), which may be related to measurement of T cell function after resolution of viremia, as CD4+ has been shown to be associated with maintenance of viral control (13). Other studies may have lacked the power to observe the polyfunctional CD8+ response as patient samples were grouped solely by phase of viremia and not by controller versus noncontroller patient status (22). Another component of the effective anti BK virus response appears to be CD107a expression. Conversely, PD-1 expression was not increased in T cells from noncontrollers as compared with controllers.
In BK-virus specific monofunctional T cells, IFN-γ was the cytokine more commonly expressed in controllers and patients with low level viremia as compared with noncontrollers. One limitation of our study, however, is the relatively low number of patients with only low level viremia included in our analysis, as we were primarily interested in the difference between controllers and noncontrollers. Another limitation is the lack of virologic data regarding BK virus strains, which may also have led to different levels and durations of BK viremia (1).
The observation that increase in BK-virus specific polyfunctional CD8+ expression leads to the question of why some patients possess the ability to efficiently mount this antiviral response immediately after viremia start. The explanation does not appear to lie in the patients’ net state of immunosuppression, as the use of induction with ATG was similar in both groups and all patients received the same immunosuppression protocols, and no association was seen between tacrolimus levels and length of viremia or frequency of BK virus-specific polyfunctional CD8+ T cells. In addition, no difference was seen in positive SEB control response in controller as compared with noncontrollers. One possible explanation is that greater avidity of binding between recipient CD8+ T cell receptor and allograft MHC class I/BK virus antigen complex, leading to increased frequency in simultaneous expression of inflammatory cytokines. This hypothesis is supported by the observation that an increase in HLA mismatch is associated with more graft loss due to BKN (1,23). However, in this patient group, there a statistically significant difference in degree of HLA mismatch between controllers and noncontrollers was not observed (Table 1). Examination of changes in gene expression associated with development of polyfunctional CD8+ T cell response may shed further light on the mechanism of development of these cells.
Another limitation of this study is the relatively small number of patients analyzed. However, as a pilot study in investigating possible mechanism of difference in patient ability to control BK virus replication, we feel that our observations suggest the importance of performing a larger, multicenter study with more standardized blood sample collection including pretransplantation blood sample analysis. We have attempted to mitigate the limitation of small sample size through batched analysis of samples to minimize intra-experimental variation, subtraction of the background frequency of cytokine-expressing cells for each data point, decreasing the impact of variation due to background levels of cytokine secretion, and the use of a homogenous patient population from a single center, undergoing uniform protocols for immune suppression, antiviral prophylaxis, BK virus surveillance, and response to detectable BK viremia. The ability to detect a T cell profile predictive of ability to limit BK virus replication early after onset of viremia and prior to decrease in immunosuppression is a potentially important tool for patient management and individualized adjustment of immunosuppression based on anti-BK virus immune response. Patient absolute lymphocyte count (ALC) and peak BK viremia may additionally provide clues regarding a patient’s ability to control BK virus replication (Table 2). In addition, pre-transplant evaluation may detect differences in response prior to initiation of immunosuppression. A larger multicenter study should be performed to determine whether these observations hold true in larger patient group.
Reaching a better understanding of the mechanism of BK virus control and development of a polyfunctional CD8+ response will advance the study of BK virus infection and open the door for vaccination strategies, as well as the future possibility of immune modulation to promote antiviral immune response without increasing risk of allo-antibody formation and allograft rejection.
Supplementary Material
Panel A depicts the gating strategy for identification of CD4+ and CD8+ T cells. Lymphocytes (“Lymph”) were subdivided into live lymphocytes, and this population was further divided into CD3+ and CD3- populations. CD3+ cells were further gated on CD8+ and CD4+ to identify these sub-populations. Panel B depicts the gating strategy for cytokine detection in the absence of stimulation (“Unstimulated”), after SEB stimulation (“SEB”), or after incubation with overlapping peptide pools of BK virus antigen (“BK peptides”), using a representative experiment on the CD3+ population. X-axis and y-axis fluorochrome-conjugated antibodies are indicated. Circled quadrant indicates cells identified as secreting both IFN-γ and TNF-α. These cells were gated on TNF-α to identify the triple-cytokine secreting T cell population.
The frequency of CD3+ T cells expressing two cytokines simultaneously after SEB stimulation is shown. Line indicates mean of each dataset. Controllers are indicated in triangles, noncontrollers by circles, and patients with low level viremia by squares.
The frequency of BK virus-specific CD8+ or CD4+ T cells expressing 3 cytokines simultaneously is shown. Line indicates mean of each dataset. Controllers are indicated in triangles, noncontrollers by circles, and patients with low level viremia by squares.
Acknowledgments
J.S. participated in research design, performance of the research, data analysis and writing of the article. E.R. participated in research design, data analysis and writing of the article. Y.K. participated in research design, performance of the research, and data analysis. T.S., F.K., and N.H. participated in performance of the research. D.G. participated in research design and data analysis. E.L., U.R., E.H., P.P., S.B., G.D., J.V., and H.G. participated in performance of the research and writing of the article.
This work was funded in part by NIH Clinical and Translational Science Institute grant UL1TR000124.
Abbreviations
- BKN
BK virus-associated nephropathy
- IFN
interferon
- TNF
tumor necrosis factor
- IL
interleukin
- PD-1
programmed cell death 1
Footnotes
The authors declare no conflicts of interest.
References
- 1.Hirsch HH, Brennan DC, Drachenberg CB, et al. Polyomavirus-Associated Nephropathy in Renal Transplantation: Interdisciplinary Analyses and Recommendations. Transplantation. 2005;79(10):1277–1286. doi: 10.1097/01.tp.0000156165.83160.09. [DOI] [PubMed] [Google Scholar]
- 2.Bennett SM, Broekema NM, Imperiale MJ. BK polyomavirus: emerging pathogen. Microbes and Infection. Microbes Infect. 2012;30(61):1–12. doi: 10.1016/j.micinf.2012.02.002. [DOI] [PMC free article] [PubMed] [Google Scholar]
- 3.Knight RJ, Gaber LW, Patel SJ, et al. Screening for BK Viremia Reduces But Does Not Eliminate the Risk of BK Nephropathy. Transplantation. 2013;95(7):949–954. doi: 10.1097/TP.0b013e31828423cd. [DOI] [PubMed] [Google Scholar]
- 4.Pham P-T, Schaenman J, Pham P-C. BK Virus Screening and Management Following Kidney Transplantation: An Update. Curr Opin Organ Transplant. 2012;2(3) doi: 10.1097/MOT.0000000000000101. [DOI] [PubMed] [Google Scholar]
- 5.Hirsch HH, Randhawa P AST Infectious Diseases Community of Practice. BK Polyomavirus in Solid Organ Transplantation. Am J Transplant. 2013;13(s4):179–188. doi: 10.1111/ajt.12110. [DOI] [PubMed] [Google Scholar]
- 6.Cannon RM, Ouseph R, Jones CM, Hughes MG, Eng M, Marvin MR. BK viral disease in renal transplantation. Curr Opin Organ Transplant. 2011;16(6):576–579. doi: 10.1097/MOT.0b013e32834cd666. [DOI] [PubMed] [Google Scholar]
- 7.Binggeli S, Egli A, Schaub S, et al. Polyomavirus BK-Specific Cellular Immune Response to VP1 and Large T-Antigen in Kidney Transplant Recipients. Am J Transplant. 2007;7(5):1131–1139. doi: 10.1111/j.1600-6143.2007.01754.x. [DOI] [PubMed] [Google Scholar]
- 8.Ginevri F, Azzi A, Hirsch HH, et al. Prospective Monitoring of Polyomavirus BK Replication and Impact of Pre-Emptive Intervention in Pediatric Kidney Recipients. Am J Transplant. 2007;7(12):2727–2735. doi: 10.1111/j.1600-6143.2007.01984.x. [DOI] [PubMed] [Google Scholar]
- 9.Freer G, Rindi L. Intracellular cytokine detection by fluorescence-activated flow cytometry: Basic principles and recent advances. Methods. 2013;61(1):30–38. doi: 10.1016/j.ymeth.2013.03.035. [DOI] [PubMed] [Google Scholar]
- 10.Trydzenskaya H, Sattler A, Müller K, et al. Novel approach for improved assessment of phenotypic and functional characteristics of BKV-specific T-cell immunity. Transplantation. 2011;92(11):1269–1277. doi: 10.1097/TP.0b013e318234e0e5. [DOI] [PubMed] [Google Scholar]
- 11.Owen RE, Heitman JW, Hirschkorn DF, et al. HIV+ elite controllers have low HIV-specific T-cell activation yet maintain strong, polyfunctional T-cell responses. AIDS. 2010;24(8):1095–1105. doi: 10.1097/QAD.0b013e3283377a1e. [DOI] [PMC free article] [PubMed] [Google Scholar]
- 12.Techakriengkrai N, Tansiri Y, Hansasuta P. Poor HIV control in HLA-B*27 and B*57/58 noncontrollers is associated with limited number of polyfunctional Gag p24-specific CD8+ T cells. AIDS. 2013;27(1):17–27. doi: 10.1097/QAD.0b013e32835ac0e1. [DOI] [PubMed] [Google Scholar]
- 13.Egli A, Humar A, Kumar D. State-of-the-art monitoring of cytomegalovirus-specific cell-mediated immunity after organ transplant: a primer for the clinician. Clin Infect Dis. 2012;55(12):1678–1689. doi: 10.1093/cid/cis818. [DOI] [PubMed] [Google Scholar]
- 14.Franceschini D, Del Porto P, Piconese S, et al. Polyfunctional Type-1–2, and -17 CD8+ T Cell Responses to Apoptotic Self-Antigens Correlate with the Chronic Evolution of Hepatitis C Virus Infection. Walker CM, editor. PLoS Pathog. 2012;8(6):e1002759. doi: 10.1371/journal.ppat.1002759. [DOI] [PMC free article] [PubMed] [Google Scholar]
- 15.Wherry EJ. T cell exhaustion. Nat Immunol. Nature Publishing Group. 2011 Jun 1;131(6):492–499. doi: 10.1038/ni.2035. [DOI] [PubMed] [Google Scholar]
- 16.Fahey LM, Brooks DG. Opposing positive and negative regulation of T cell activity during viral persistence. Curr Opin Immunol. 2010;22(3):348–354. doi: 10.1016/j.coi.2010.03.004. [DOI] [PMC free article] [PubMed] [Google Scholar]
- 17.Solez K, Colvin RB, Racusen LC, et al. Banff 07 Classification of Renal Allograft Pathology: Updates and Future Directions. Am J Transplant. 2008;8(4):753–760. doi: 10.1111/j.1600-6143.2008.02159.x. [DOI] [PubMed] [Google Scholar]
- 18.Harari A, Dutoit V, Cellerai C, Bart P-A, Pasquier Du RA, Pantaleo G. Functional signatures of protective antiviral T-cell immunity in human virus infections. Immunol Rev. 2006;211:236–254. doi: 10.1111/j.0105-2896.2006.00395.x. [DOI] [PubMed] [Google Scholar]
- 19.Schachtner T, Müller K, Stein M, et al. BK virus-specific immunity kinetics: a predictor of recovery from polyomavirus BK-associated nephropathy. Am J Transplant. 2011;11(11):2443–2452. doi: 10.1111/j.1600-6143.2011.03693.x. [DOI] [PubMed] [Google Scholar]
- 20.Lubetzky M, Bao Y, Ó Broin P, et al. Genomics of BK Viremia in Kidney Transplant Recipients. Transplantation. 2014;97(4):451–456. doi: 10.1097/01.TP.0000437432.35227.3e. [DOI] [PubMed] [Google Scholar]
- 21.Schmidt T, Adam C, Hirsch HH, et al. BK Polyomavirus-Specific Cellular Immune Responses Are Age-Dependent and Strongly Correlate With Phases of Virus Replication. Am J Transplant. 2014;14(6):1334–1345. doi: 10.1111/ajt.12689. [DOI] [PubMed] [Google Scholar]
- 22.Weist BJD, Wehler P, Ahmad El L, et al. A revised strategy for monitoring BKV-specific cellular immunity in kidney transplant patients. Kidney Int. 2015:1–11. doi: 10.1038/ki.2015.215. [DOI] [PubMed] [Google Scholar]
- 23.Awadalla Y, Randhawa P, Ruppert K, Zeevi A, Duquesnoy RJ. HLA mismatching increases the risk of BK virus nephropathy in renal transplant recipients. Am J Transplant. 2004;4(10):1691–1696. doi: 10.1111/j.1600-6143.2004.00563.x. [DOI] [PubMed] [Google Scholar]
Associated Data
This section collects any data citations, data availability statements, or supplementary materials included in this article.
Supplementary Materials
Panel A depicts the gating strategy for identification of CD4+ and CD8+ T cells. Lymphocytes (“Lymph”) were subdivided into live lymphocytes, and this population was further divided into CD3+ and CD3- populations. CD3+ cells were further gated on CD8+ and CD4+ to identify these sub-populations. Panel B depicts the gating strategy for cytokine detection in the absence of stimulation (“Unstimulated”), after SEB stimulation (“SEB”), or after incubation with overlapping peptide pools of BK virus antigen (“BK peptides”), using a representative experiment on the CD3+ population. X-axis and y-axis fluorochrome-conjugated antibodies are indicated. Circled quadrant indicates cells identified as secreting both IFN-γ and TNF-α. These cells were gated on TNF-α to identify the triple-cytokine secreting T cell population.
The frequency of CD3+ T cells expressing two cytokines simultaneously after SEB stimulation is shown. Line indicates mean of each dataset. Controllers are indicated in triangles, noncontrollers by circles, and patients with low level viremia by squares.
The frequency of BK virus-specific CD8+ or CD4+ T cells expressing 3 cytokines simultaneously is shown. Line indicates mean of each dataset. Controllers are indicated in triangles, noncontrollers by circles, and patients with low level viremia by squares.


