
Figure 3. Increased percentage of double-cytokine expressing CD8+ T cells in controllers versus noncontrollers.
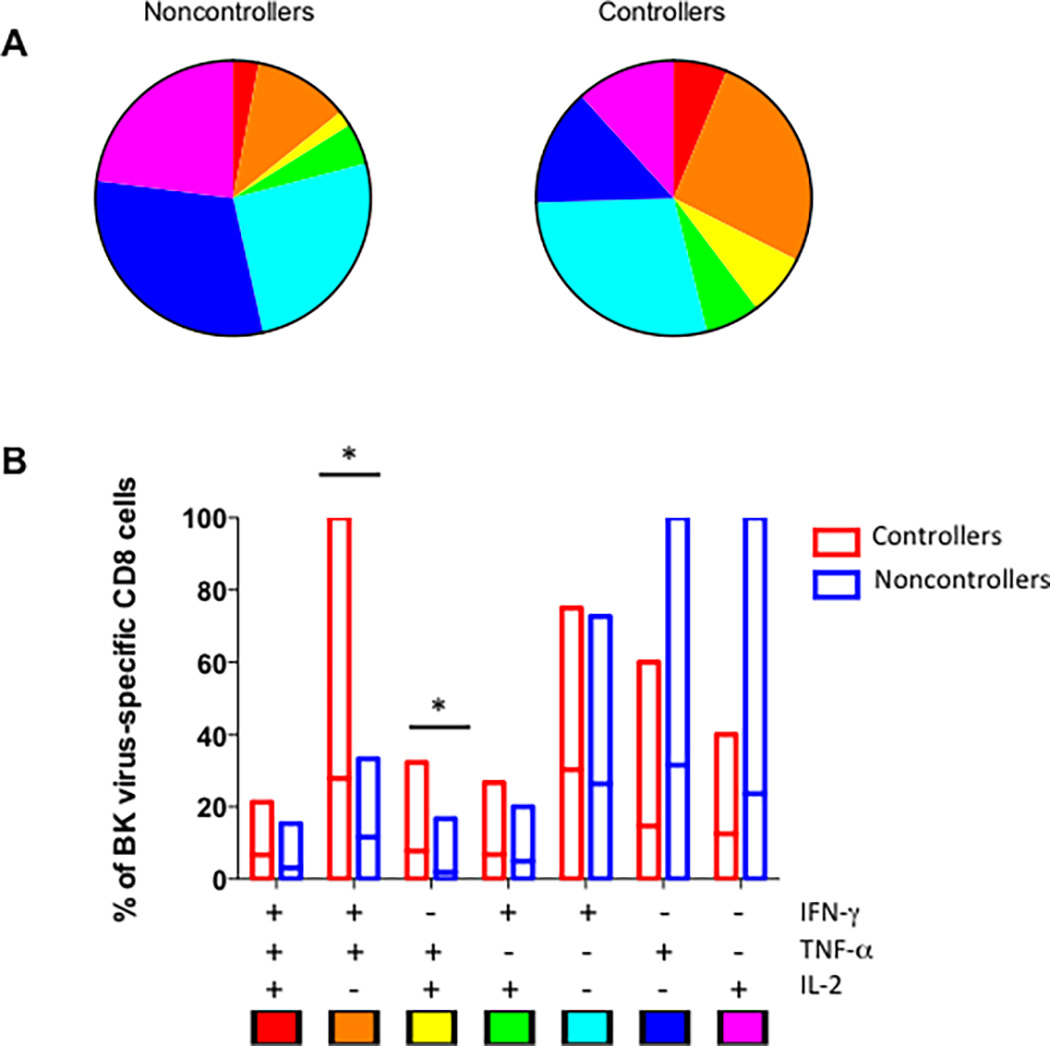
Panel A shows the breakdown of all BK virus specific CD8+ T cells for controllers (right) and noncontrollers (left) by percentage of triple, double, and single cytokine secreting cells by each combination of cytokines. Key is indicated at the bottom of panel B. Panel B shows the mean and range of percentages for each combination of cytokine expression patter in bar graph form, with controllers shown in red and noncontrollers in blue. Single asterisk indicates p<0.05 by Wilcoxon test.