

Abstract
Acute hypotension is a significant risk factor for in-hospital mortality at intensive care units (ICUs). Prolonged hypotension can cause tissue hypoperfusion, leading to cellular dysfunction and severe injuries to multiple organs. Prompt medical interventions are thus extremely important for dealing with acute hypotensive episodes (AHE). Population level prognostic scoring systems for risk stratification of patients are suboptimal in such scenarios. However, the design of an efficient risk prediction system can significantly help in the identification of critical care patients, who are at risk of developing an AHE within a future time span. Towards this objective, a pattern mining algorithm is employed to extract informative sequential contrast patterns from hemodynamic data, for the prediction of hypotensive episodes. The hypotensive and normotensive patient groups are extracted from the MIMIC-II critical care research database, following an appropriate clinical inclusion criteria. The proposed method consists of a data preprocessing step to convert the blood pressure time series into symbolic sequences, using a symbolic aggregate approximation algorithm. Then, distinguishing subsequences are identified using the sequential contrast mining algorithm. These subsequences are used to predict the occurrence of an AHE in a future time window separated by a user-defined gap interval. Results indicate that the method performs well in terms of the prediction performance as well as in the generation of sequential patterns of clinical significance. Hence, the novelty of sequential patterns is in their usefulness as potential physiological biomarkers for building optimal patient risk stratification systems and for further clinical investigation of interesting patterns in critical care patients.
Index Terms: Acute hypotension, Mean arterial pressure, Symbolic sequences, Sequential pattern mining
I. Introduction
In the past few years, there has been a significant rise in patient monitoring devices aggregating large-scale patient data in intensive care units. Typically, most of this huge volume of data has remained underutilized, leading to slower progress in medical research. However, with increasing demand on healthcare organizations, there is now an urgent necessity to provide improved access and quality of care at lesser costs. As evidence obtained from modern data-driven techniques have contributed to significant advances in critical care patient diagnosis, such efforts have resulted in an improved understanding of diseases and guided appropriate medical interventions.
Appropriate clinical diagnosis of impending critical events is extremely important in an ICU, since rapid physiological changes cause critical patient instabilities that require immediate medical interventions. Conventional early warning monitoring systems turn out to be suboptimal in such cases. Existing systems embed a set of predefined clinical rules, which act on vital signs data, to raise an alarm reactively. Moreover, they are also known to generate a significant number of false alarms in ICUs [2]. In addition, the current systems do not account for the dynamic nature of complex physiological processes in a given time period. Hence, there exists a need for predictive technologies, which can act proactively for advanced medical decision-making in critical care units.
Hemodynamic monitoring is an essential mechanism in ICUs generating a significant amount of streaming blood pressure (BP) data. Acute hypotensive episodes (AHE) are defined as a sudden drop of patient blood pressure spanning over an extended time period. An AHE can lead to decreased tissue perfusion, which in turn can be a cause of multiple organ damages. Hemodynamic instabilities can be life-threatening to the concerned patients. On the other hand, if such instabilities are detected ahead of time to limit the effects of a life threatening event, then there are significant benefits associated with the outcomes.
The effectiveness of medical outcomes is generally assessed by the risk of mortality and also involves the costs of treatment. For critical care patients, these factors tend to rise with time. Thus, the effectiveness of individual medical outcomes is strongly dependent on well-informed patient interventions. Proactive interventions are staged on the basis of clinical evidence of impending events. Such evidence needs to have two significant characteristics viz. predictive capability and clinical interpretability. The importance of clinical interpretability stems from the requirement of a clinician’s enhanced degree of understanding of the patient’s physiological condition. Such knowledge is fundamental for the selection of an optimal treatment plan.
A knowledge discovery based predictive system can meet this demand. Usually, such a predictive system takes into account time-based micro physiological events during a patient’s ICU stay. It is able to make significant associations of interpretable clinical evidence to future hemodynamic behaviour. Accordingly, it has a strong potential for a reduction in operational costs, increase in efficiency, the development of novel goal directed treatments and scheduling of additional ICU services.
The aim of this study is to identify discriminative hemodynamic sequential patterns via a novel data mining method for the risk stratification of ICU patients. These patterns are later utilized to distinguish hypotensive episodes from normotensive cases.
The informative sequential patterns are extracted from a large-scale patient population in the MIMIC-II critical care research database [3]. The MIMIC-II (Multiparameter Intelligent Monitoring in Intensive Care) database is a publicly available critical care data resource, encompassing a diverse and large population of ICU patients over the last 10 years. It comprises of high resolution temporal data including lab results, discharge notes, physiological trends and waveforms. The database has been widely used to support numerous research studies in the fields of epidemiology, clinical decision-rule improvement, and ICU alarm systems.
One important novelty of the current study is the application of a sequential contrast pattern mining strategy in the extraction of clinical episodes of arbitrary length, which are a characteristic of specific critical conditions like an AHE. The present study can thus meet the need to generate novel medical insights from the data of intensive care units and discover clinically relevant episodes separated by time windows.
Overall, our contributions made by this study include: (i) the application of a contrast pattern mining technique in the field of critical care informatics, (ii) a new method for generating predictive alerts for hypotensive episodes in an ICU, and (iii) validation of our method on data extracted from a large-scale de-identified critical care research database like the MIMIC-II.
II. Problem Definition
Acute hypotension is a clinical symptom showing a significant drop in mean arterial pressure (MAP) values for extended periods of time. The mean arterial pressure is often used in medicine as a popular measure of blood pressure, which can be derived from the systolic (SP) and diastolic pressure (DP) as given by equation (1).
| (1) |
Although hypotension is not categorized as a disease state, it is considered to be a frequent ailment among the general population and especially among females. Owens et al [28] reported a prevalence of 49% hypotensive patients in a prevalence study of a general population cohort. Existing studies have indicated that hypotension is associated with morbidities stemming from dizziness and fatigue. Hypotensive subjects have previously demonstrated lower blood pressure, along with lower weights and had lesser likelihood of a family history of vascular disease or hypertension. However, in a diagnostic setting, actual prevalence can be dependent upon associated stress, anti-hypertensive medications and diuretics [23]. Neurological diseases are also associated with an increasing likelihood of AHEs in an ICU. Depending on various definitions of hypotension, MAP values falling below the threshold range of 60–80mmHg for 30 minutes, could trigger an acute hypotensive episode. Figure 1 illustrates such a scenario, where MAP values sustain below 60 mmHg for a time period ≥ 30 minutes.
Fig. 1.

Acute Hypotensive Episode over a time period exceeding 30 minutes, when MAP ≤ 60 mmHg
A. A Formulation of the AHE Prediction Problem
Numerous studies report that hypotension could lead to critical events like acute kidney injury, severe sepsis, acute coronary syndrome and shock [46], [47], [48], [21]. To enable prompt interventions, it is therefore important to predict an AHE ahead of time. Predicting an AHE can be formulated as a problem of classification of an admitted patient’s mean arterial pressure into a hypotensive or normotensive regime. The prediction of the mean arterial pressure in a future time window is central to the current study. An illustration of the AHE prediction problem is provided in Figure 2.
Fig. 2.

Observation and Target Windows with a Time Gap Interval
According to Figure 2, an user-defined MAP time series observation window of length 30 or 60 minutes, is provided as historical data. The time series observation window is subsequently utilized to predict the given MAP’s class (hypotensive or normotensive) in a future target window of 30 minutes. Moreover, the observation and the target windows are separated by an user-defined gap interval of 60 and 120 minutes. The problem can be interpreted as that of performing an AHE prediction in a future time window, given the MAP observation data and a gap interval of one or two hours between the observation and the forecasting time windows.
B. Related Work
There have been a number of studies using pattern recognition techniques for the analysis of hypotensive behaviour. Wavelet-based similarity measures from blood pressure time series had been proposed to predict vasopressor onsets [6]. Ghaffari et al [7] have demonstrated the use of Hilbert-transform based techniques for predicting AHEs. In 2009, the Physionet AHE prediction challenge was instituted to advance the development of state-of-the-art techniques [5], including neural networks, support vector machines and numerous statistical indices as features, for the prediction of AHE [8], [9], [12]. In some of these cases, historical time windows used for observations were considered as five minutes prior to the onset of an AHE. Accordingly, Wang et al [13] have reported that medical pattern extraction was particularly challenging, owing to their longitudinal and sparse nature. While addressing this concern, Syed et al [14] reported the development of motif mining methods, which were tested on long-range cardiovascular time series datasets. Moreover, Lee and Mark [15] reported the extraction of hemodynamic patterns for hypotension through artificial neural networks. Recently, Ghassemi et al [51] demonstrated the application of global optimization techniques for principal extraction of dynamical features, which are more predictive of patient outcomes than severity of illness scores accounting for multiple non-dynamic features of the patient.
For the area of predictive data mining for monitoring applications, previous research has reported the development of numerous pattern mining techniques. Typically, existing research tends to identify problems in either of two directions viz. short-term predictive modelling with the objective of generating daily alerts for physicians or long-term predictive modelling aimed at population level prognosis [22]. Monitoring systems help in capturing signals that can be used to identify time varying phenomenon, instead of traditional generation of alerts, which are known to generate a lot of false reports [24]. To overcome this weakness, intelligent noise removal methods are used as low pass filters which can aggregate high resolution signal frames and a number of good measurements [25]. The processed input is then used for classification and regression problems, although the concerned method may or may not consider temporal aspects of the data. A wide range of ICU prediction tasks focus on the extraction of statistical features from medical time series and making them time-independent. For example, impending ICU physiological instability has been predicted by decision rules from time series data [26]. Bayesian artificial neural networks were employed for observation windows 15 and 30 minutes before hypotension for traumatic brain injury subjects resulting in 86% specificity and 41% sensitivity [27]. Second day ICU discharges were predicted by gaussian processes [30]. Celi et al [29] also employed Bayesian networks to predict day-two fluid requirements for the study of patient inflammatory responses.
Apart from final prediction outcomes, medical decision makers also expect to discover insights relating to the processes employed on longitudinal patient records. Research on such data, begins with complex data transformation procedures by developing temporal abstractions to represent temporal relations between time intervals. Previous studies have reported the extraction of meaningful temporal patterns from a diabetes dataset [31], [33], [38]. Prior to this, Tseng and Lee [54], [55] had reported temporal pattern-based classifiers for effective classification by sequences for atrial fibrillation datasets. Additionally temporal patterns were also used to predict the hospitalization of hemodialysis patients [35], [36]. A time-series knowledge mining method was used to discover frequent temporal patterns for patients who required mechanical ventilation for greater than 24 hours [37]. Toma et al [34] utilized frequent temporal patterns to capture the evolution of organ failures status in a set of patients. Temporal history of patient event codes have also been reportedly used for mining frequent sequences of events to understand various illnesses [32]. In this context, Perer et al [52] demonstrated the clinical usefulness of frequent temporal sequences by an interactive and visual analytics platform for mining sequences of ICD-9 codes to understand disease progression. Similar visual analytics platforms have been shown to have a greater clinical importance in the mining of medical event sequences having strong associations with specific disease outcomes [53].
III. Methodology
The identification of sequential patterns is related to detecting subsequences contained within training sequences. According to the problem constraints, well-defined representative patterns may be grown, which display strong support in the concerned training sequences. Sequential pattern mining strategies can provide a useful alternative to mining interesting patterns of physiological time series data, which may help discover significant insights in the form of important clinical episodes. In the following sections, we describe the various stages viz. data extraction, pre-processing and mining of sequential contrast patterns that are over-represented in the hypotensive training samples and under-represented in the normotensive samples.
A. Data Extraction
The data of the study is a relevant subset of the MIMIC-II database, using a suitable data inclusion/exclusion criteria [15]. The MIMIC II is a large-scale intensive care unit database consisting of more than 30,000 patients with numerous patient variables, aggregated from patient health care records and physiological waveforms over a period of more than 10 years. The physiological time series waveforms data are organized into records, identified using unique patient identifiers. A specific patient identifier may correspond to multiple ICU stays. Thus, time series data for each ICU stay maintains a unique ICU stay identifier. The extracted subset of records are also satisfied the following conditions, before extraction.
The record had to be of an adult patient.
Each patient time series constituted of minute-by-minute numeric samples, for at least the mean arterial blood pressure.
Corresponding clinical records existed for the waveform records in MIMIC II.
As recommended by Lee and Mark [15], we considered the following inclusion criteria, while compiling the data examples. As described in Figure 1, each data sample comprised of three time intervals as follows.
a 30 or 60 minutes MAP observation window
a 30 minutes target window
a time interval gap of 60 or 120 minutes, which separates the observation and target windows.
There exist seven categories for the ICD-9 code for hypotension (458.0 – 458.9) as shown in Table I. Hypotensive records were selected by pattern matching over the higher level numerical classification of 458 in MIMIC-II.
TABLE I.
ICD-9 Classification of Hypotension
| ICD-9 Code | Disease |
|---|---|
| 458.0 | Orthostatic hypotension |
| 458.1 | Chronic hypotension |
| 458.2 | Iatrogenic hypotension |
| 458.21 | Hypotension of hemodialysis |
| 458.29 | Other iatrogenic hypotension |
| 458.8 | Other specified hypotension |
| 458.9 | Hypotension unspecified |
A target window was labelled either as normotensive (control) or hypotensive. The labelling of a target window as hypotensive (HE) was subject to satisfying a 30 minute period of time for which MAP was less than 60 mmHg and greater than 10 mmhg, for 90% of the time period. In contrast, a 30 minute window which did not satisfy the given HE definition as above was labelled as a normotensive (control) sample. Moreover, corresponding to each target window, the extracted MAP observation windows were also verified to be within the 10–200 mmHg range.
Two data extraction mechanisms were considered viz. single and multiple modes. For single mode compilation, a single hypotensive or normotensive example was constructed from each separate patient waveform record. On the other hand, the multiple compilation mode considered a sliding window of 30 minutes, and all those examples were constructed, whenever satisfying the conditions for the observation and target windows.
In addition to the datasets extracted using the given inclusion criteria, hypotensive and normotensive datasets were also employed from the Physionet 2009 challenge [5]. For the challenge datasets, their MIMIC II waveform signals were divided into two groups viz. H (hypotensive) and C (control) respectively. The groups H and C were further subdivided into H1, H2 and C1, C2. Each sub-group were defined to have the following properties.
H1: Patients receiving pressor medication.
H2: Patients not receiving pressor medication.
C1: Patients with no acute hypotensive episodes during entire hospital stay.
C2: Patients having AHE before or after the forecast window.
Accordingly, two challenge prediction tasks were constituted as follows.
Event I: Patient risk classification between H1 and C1
Event II: Patient risk classification between H and C
Moody and Lehman [5] reported that the groups H1 and C1 indicated the extremes of AHE-associated risks.
B. Data Discretization
Physiological data often comprise of repetitive elements. To identify interesting patterns, a natural extension is to transform the real-valued physiological time series into string representations for mining symbolic discrete patterns [14]. Subsequently, we employed the symbolic aggregate approximation method [16] to segment the original MAP signal into discrete intervals and assigned an alphabetic label to each discrete region. This process transforms the continuous MAP data into a symbolic sequence, and enables the use of numerous pattern mining algorithms. The symbolic aggregate approximation (SAX) technique has emerged as a popular and efficient technique, producing an informative symbolization of large-scale time series data. Typically, SAX converts the continuous time series into a piecewise aggregate approximation (PAA) form [16]. Later, the PAA series is converted to a symbolic sequence. Each MAP time series, before being discretized, undergoes a normalization process having a mean of 0 and variance 1. The SAX strategy selects breakpoints using a gaussian distribution, such that the discrete symbols are equiprobable in the time series. For example, to transform a normalized time series using five symbols, the discrete regions are specified by [−∞, −0.84, −0.25, +0.25, +0.84, +∞]. The symbolic representation adopted by SAX characterizes the inherent properties of the time series data. Consequently, an equiprobable distribution of symbols is maintained in the given time series [16].
In the process, SAX provides an effective discretization platform, which can be utilized to create efficient pattern mining and indexing algorithms for medical purposes. Figure 3 illustrates a visual representation of a real-valued time series being converted to a symbolic form, using four symbolic regions.
Fig. 3.

Discretization by Symbolic Aggregate Approximation using 4 symbols
C. Mining gap-constrained sequential contrast patterns
In studies related to binary or multi-class classification, the central objective is to develop a prediction model, which is capable of distinguishing an incoming signal using its inherent properties and assign a target label as the predicted outcome. Typically, in data mining problems, there exists a strong motivation to discover differentiable patterns’ characteristic of disparate groups of data, that are used for prediction of records. Mining emerging patterns from distinctively labelled groups of relational data was initially introduced by Dong and Li [17]. However, the immediate application of emerging patterns to sequence databases was not possible owing to ordering of a sequence, and due to multiple occurrences of items in a sequence. Accordingly, the concept of emerging substrings was suggested [42]. Substrings are a special case of subsequences, where each consecutive symbol is separated by a gap interval of 0. Yet, an important aspect to note is that significant sequential episodes may not manifest as consecutive symbols existing in time-series symbolic sequences of interest. Thus, the identification of episodes having significant events ordered sequentially, while having arbitrary gap intervals between events, can be extremely useful. Towards this purpose, a number of algorithms have been reported [43]. In the present study, we intend to discover gap-constrained contrast subsequences from disparate groups of sequence data, using the principles of frequency support. In the following sections, the various definitions and processes associated with the extraction of gap-constrained sequential contrast patterns are described.
1) Sequential Patterns
Let there be a set of distinct items denoted as I. I can also be called the alphabet set and |I| is the size of the alphabet set. A sequence S defined over I may be denoted as e1 − e2 − .… −en, such that ei belongs to I for 1 ≤ i ≤ n. Accordingly, we consider univariate sequences where ei represents a single item from I. A sequence S′ = ei1 − ei2 − … −eim is said to be contained in a sequence S = e1−e2−e3−…−en, such that 1 ≤ i1 ≤ i2 ≤ ≤ im ≤ n. For example, a subseqeunce CD is contained in CAAD, but not DC. Hence, the order of the sequence S′ is maintained in S, although items in S′ are not consecutive in S. This indicates the existence of gap intervals between the items of S′.
Definition 3.3.1.1: (Max-Prefix)
The max-prefix of the sequence S = e1 − e2 − … − ek is given by e1 − e2 − … −ek−1. It constitutes the leading sequence of elements in S, without the final item of S.
Definition 3.3.1.2: (Occurrence of a Subsequence)
Given the sequences, S = e1−e2− .… −en and S′ = ei1−ei2−.…−eim, S′ occurs in S if 1 ≤ ik ≤ n and ek = eik for all 1 ≤ k ≤ m, and ik ≤ ik+1 for 1 ≤ k ≤ m. For example, given sequences S = XZXZY ZY and subsequence S′ = XY, there are four occurrences of S′ in S at the positions – {1, 5}, {1, 7}, {3, 5} and {3, 7}.
Definition 3.3.1.3: (Satisfaction of Gap Constraints)
Consider a sequence S = e1 − e2… − en and an occurrence O = i1, i2, …, im of a subsequence S′, if (ik+1 − ik) ≤ g + 1, such that |k| ∈ {1, …, m − 1}, then S′ for the occurrence O, fulfills the gap constraint of g. Moreover, fulfilling the gap constraint once, in a given sequence serves the condition of gap-constraint satisfaction. For example, if g = 2, then XY is a subsequence of XZY, but not XZZZY.
Now, let us consider D = {D1, D2,…, Dn} as a set of sequences in a database, a sequential pattern P, and a gap-constraint of g, then the frequency of occurrences of P in D is given by countP (D, g), also known as the absolute frequency support of P in D. If there exists a frequency support threshold α and P satisfies a condition such as countP (D, g) ≥ α, then P is is said to be frequent in D, with a gap constraint g.
Definition 3.3.1.4: (Gap constrained sequential contrast patterns)
Given two sets of sequence datasets D+ (positive sequences) and D−(negative sequences), two thresholds α and δ, and a maximum gap of g, a gap-constrained sequential contrast pattern P is required to satisfy the following conditions.
Positive Support: countP (D+, g) ≥ α
Negative Support: countP (D−, g) ≤ δ
Thus given D+, D−, α, δ and g, mining the gap-constrained sequential patterns involves finding the set of all such subsequences that fulfill the given conditions from (1) to (2).
2) Generation of Candidate Sequences
Towards finding the set of all gap-constrained contrast sequential patterns, we employ the ConSGapMiner algorithm [18], which was earlier used to extract minimal distinguishing subsequences (MDS) with user-defined gap constraints. The method utilizes the depth first search (DFS) technique for the generation of candidate sequences. This is done by growing a lexicographic sequence tree (LST) as shown in the example in Figure 4. Each node in the LST embeds a subsequence, along with its positive and negative frequency supports. In addition, each node is a max-prefix of its children.
Fig. 4.

A Lexicographic Sequence Tree (LST) growing candidate sequences using 3 symbols as A, B, C
Pruning non-minimal subsequences
After a sequence node is generated, if it satisfies the conditions (1) and (2), then the sequence node is not extended further. A supersequence of a potential contrast sequence is not minimal [18]. Thus, restricting the growth of sequences by a minimality condition, helps in the reduction of redundant patterns.
Pruning of infrequent subsequences
If a sequence node’s positive frequency support is less than α (as specified in condition (1)), then the concerned node need not be extended. This is because, supersequences of an infrequent max-prefix are also infrequent.
3) Gap Constraint Verification
For the verification of gap-constraint satisfaction, we employed a bitmap representation reported earlier for checking gap-constraints [41]. The bitmap process is explained by an example, as shown in Table II. Let us consider verifying the gap constraint of XY in XZXZY, given maximum gap g is set to 2. In the first step, all the occurrences of X in the concerned sequence are set to 1 (as shown in Xindex). These are position indices given by 1 and 3. Later, (g +1) index positions are set to 1 for each occurrences following X, separately as illustrated in rows 3 (given as 1X) and 4 (given as 2X). Following this, the bit vectors in rows 3 and 4 go through a logical OR operation, as given in row 5. Subsequently, a logical AND operation is performed on the bit vectors in row 5 and for the occurrences of Y in row 6, to obtain a final bit vector, in row 7. An occurrence of 1 in the final bit vector (at row 7) indicates that the gap constraint of g = 2 was satisfied.
TABLE II.
Checking gap constraint satisfaction of XY in XZXZY
| X | Z | X | Z | Y | |
|---|---|---|---|---|---|
| Index | 1 | 2 | 3 | 4 | 5 |
| Xindex | 1 | 0 | 1 | 0 | 0 |
| 1X | 0 | 1 | 1 | 1 | 0 |
| 2X | 0 | 0 | 0 | 1 | 1 |
| 1X(OR)2X | 0 | 1 | 1 | 1 | 1 |
| Y | 0 | 0 | 0 | 0 | 1 |
|
| |||||
| AND | 0 | 0 | 0 | 0 | 1 |
Finally, a post-processing step is applied such that any supersequence of at least another shorter subsequence, is removed from the resulting set of contrast sequences. The algorithm for the generation of candidate sequences is provided by Algorithm I.
Algorithm 1.
Generation of candidate sequences
| candGen(c, g, I, δ, α) | |
| 1: | Require : c – sequence, g – maximum gap, I – alphabet, α – maximum positive support, δ – minimum negative support |
| 2: | ds ← ϕ {ds holds the distinguishing children of c} |
| 3: | for i ∈ I do |
| 4: | if c + i is not a supersequence of any sequence in ds |
| then | |
| 5: | nc ← c + i |
| 6: | supppos = SupportCount(nc, g, pos) |
| 7: | suppneg = SupportCount(nc, g, neg) |
| 8: | |
| 9: | if supppos ≥ αANDsuppneg ≤ δ then |
| 10: | ds ← ds ∪ nc |
| 11: | else |
| 12: | if supppos ≥ α then |
| 13: | candGen(c, g, I, δ, α) |
| 14: | DS ← DS ∪ ds |
IV. Prediction Results
The sequential contrast pattern mining methodology was applied to both single-mode and multi-mode datasets, based on a clinical inclusion criteria, similar to principles used in [15]. From the MIMIC-II database, we extracted 253 segments (single mode) and 759 segments (multi-mode), which satisfied the criteria of hypotension. For the normotensive group, 274 segments were compiled for single mode whereas for multi-mode the exact number of segments varied from 133712 to 140006.
In addition, we also applied our techniques to the datasets provided by the Physionet 2009 AHE prediction challenge [5]. In particular, the AHE challenge datasets had also been extracted from the MIMIC-II database in 2009. Our single-mode and multi-mode datasets tend to extend these datasets, since MIMIC-II has undergone multiple version updates, in the past 10 years. For the Physionet challenge, each of H1, H2, C1 and C2 groups consisted of 15 samples for training purposes. For test sets, Event I included 10 samples (H1=5, C1=5), while Event II had 40 (H=14, C=26). For the challenge data, an example training record like a40439 contains a T0 time-annotation, indicated as 18.30 on 04/09/2008 (T0 was provided with each record). The time series data prior to T0 is used for training purposes (treated as the observation window).
For the prediction of a record, a majority vote of contrast sequences is considered for the record to be treated as hypotensive. Single and multimode datasets extracted for the present study are available via https://github.com/s-ghosh/hypotension
A. Prediction performance on the two data sets
On the first data set, our 5-fold cross-validation classification results for both the single mode and multi-mode cases are summarized in Table III and IV. As can be noted, the classification results for the single mode executions are much better than multi-mode executions. This is because the single mode cross-validation accuracies are higher than multi-mode accuracies. A lower specificity in single mode executions can be attributed to the balanced nature of the single mode datasets. In contrast, the multi-mode datasets consist of a significantly higher percentage of instances, which are normotensive (for. e.g, 759 H to 140006 N). A sensitivity of 100% in our experiments, indicates that the sequential contrast method was able to predict all AHE instances correctly. Typically, the number of AHE instances are much fewer in comparison to non-AHE instances. As a result, the contrast pattern set generated due to the imbalance, can also consist of patterns which fulfill support conditions among non-AHE instances. Owing to this reason, contrast sets are highly capable of identifying positive instances. However, lower specificities reflect that a high percentage of false positives are also generated. Thus, our method demonstrates good performance when employed in the prediction of an AHE. This means sequential contrast patterns are effective in detecting hypotensive behaviour. However, since similar blood pressure patterns also exist across both population groups, a lot of negative instances are incorrectly classified as hypotensive. Similar experiments on MIMIC-II by Rocha et al [50] demonstrated a sensitivity of 82.8% and a specificity of 78.4%. In another study, Lee and Mark [15] also demonstrated highest accuracies of 76% for single-mode and 86% for multi-mode datasets extracted from MIMIC-II. Moreover, increasing the size of the observation window does not result in significant improvements in performance. Also, increasing gap intervals from 60 to 120 minutes lead to a drop in performance. Specifically, the hypotensive (positive) segments were always predicted correctly in both the modes.
TABLE III.
Single Mode Classification Performance with 10 symbols
| Gap Interval = 60 minutes | Gap Interval = 120 minutes | |||
|---|---|---|---|---|
|
| ||||
| ObWin = 0.5 h | ObWin = 1 h | ObWin = 0.5 h | ObWin = 1 h | |
| Sensitivity | 100% | 100% | 100% | 100% |
| Specificity | 65.85% | 68.29% | 61.44% | 62.19% |
| Accuracy | 82.27% | 83.54% | 79.87% | 80.37% |
TABLE IV.
Multi Mode Classification Performance with 15 symbols
| Gap Interval = 60 minutes | Gap Interval = 120 minutes | |||
|---|---|---|---|---|
|
| ||||
| ObWin = 0.5 h | ObWin = 1 h | ObWin = 0.5 h | ObWin = 1 h | |
| Sensitivity | 100% | 100% | 100% | 100% |
| Specificity | 81.19% | 80.76% | 79.36% | 74.79% |
| Accuracy | 81.30% | 80.88% | 79.48% | 74.94% |
Generally, retrospective EHR based population comparison studies tend to have imbalanced datasets, where the count of positive instances is very small as compared to the negative instances. As a possible enhancement, contrast pattern sets can be post-processed using multi-objective optimization methods to obtain the most optimal combinations of contrast sequences for building models, which demonstrate better specificity, while reporting a higher classification performance.
For the Physionet 2009 challenge dataset, the test prediction results are presented in Table V. In Table VI, we provide a comparison of our results with the reported results from the Physionet 2009 challenge. As seen, models employing neural networks (GRNN, RPS-NN) and kernel methods like SVM are heavily dependent on several parameters, and can have performances over wide ranges [9], [10], [11]. Most of the other methods employed rules based on simple averaging measures and still performed fairly [8], [45]. Moreover, hidden markov models (HMM) for hypotension had reported a cross-validation accuracy close to 97% [49], which compares well with our cross-validation results too.
TABLE V.
Physionet 2009 AHE Test Prediction Classification Accuracies for events I and II given G=3
| Event I | Event II | |||||
|---|---|---|---|---|---|---|
|
| ||||||
| S=3 | S=4 | S=5 | S=3 | S=4 | S=5 | |
| L=8 | 5/10 | 7/10 | 7/10 | 23/40 | 23/40 | 32/40 |
| L=9 | 5/10 | 7/10 | 9/10 | 23/40 | 25/40 | 33/40 |
| L=10 | 5/10 | 7/10 | 10/10 | 25/40 | 32/40 | 36/40 |
| L=11 | 5/10 | 7/10 | 10/10 | 25/40 | 32/40 | 36/40 |
TABLE VI.
A Comparison of classification methods employed for the AHE prediction problem. Sequential patterns report comparable accuracies against existing methods
| Method | Event I | Event II |
|---|---|---|
| GRNN | 10/10 | 37/40 |
| 5-min average of diastolic ABP | 10/10 | 37/40 |
| MAP averaging Rule | 10/10 | 36/40 |
| 5-min average of ABP | 10/10 | 36/40 |
| Linear Regression | 10/10 | 36/40 |
| Median of MAP | 10/10 | 34/40 |
| NN with feature selection | 9/10 | 32/40 |
| SVM | 10/10 | 30/40 |
| RPS-NN | 2/10 | 25/40 |
| Sequential Contrast Patterns | 10/10 | 36/40 |
B. Discussion
A comparison of our results with the reported results from the Physionet 2009 challenge demonstrates our competitive classification performances against those models employing neural networks (GRNN, RPS-NN), kernel methods like SVM, hidden markov models and various other statistical measures [8],[9],[12]. Additionally, the effect of parameters like subsequence length (L), alphabet size (S) and maximum gap (G) are shown in Figure 5. As seen, the best performances were achieved using a maximum gap of 3, subsequence length of 10 and an alphabet of cardinality 5. A general trend is observed, where informative sequences could be extracted if the maximum gap constraint is iteratively increased. This has been demonstrated by Figure 5.
Fig. 5.
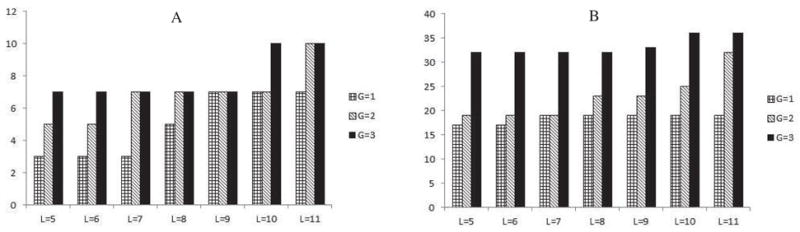
Effect of parameters L and G on the performance (A) For Event I, (B) For Event II
As seen, classification performances tend to improve with an increase in gap sizes. At the same time, a very large gap size G, also means that two consecutive symbols for a sequential pattern have occurred over a wide range, where the size was G. Extremely large gap sizes can impede a proper interpretation of contiguous events in a sequence. Typically, patient events occur over a time span, covering multiple days. Thus, sequences may be clinically useful and unique, when considered for shorter time windows in the original patient timeline, with multiple days. For larger cohorts, finding out an optimal gap is dependent on the resolution of the time series (i.e. the sampling frequency). Typically, for detecting differential blood pressure patterns, effective gap sizes can be decided based on their ability to capture clinically meaningful and informative episodes, spanning over shorter windows. In addition, increasing S provides more number of discrete cut points for MAP, and enables the algorithm to capture patterns which characterize more fluctuations in the blood pressure. Thus, for cases with S=5, the algorithm is able to find a more expressive pattern, than for S=3. Hence, selecting an alphabet size of 5 turned out to be an optimal choice, both in terms of the discretization of blood pressure range as well as keeping the algorithmic running costs within limits. This also contributes to making improved predictions. Thus, finding interesting sequences is highly dependent on the use of various parameters like the number of symbols, length of subsequence and gap sizes. Generally, the selection of appropriate parameter values like L (pattern length), G (gap size) and S (alphabet) tends to affect the cardinality of the set of discovered patterns and the algorithmic running time. Thus, extracting minimally expressive shorter sequences allows the algorithm to restrict the running time as well as identify patterns, which are clinically important and appear in longer sequences.
In contrast to our method, the 5 minute averaging measures are statistical features obtained from a 5 minutes window prior to the immediate occurrence of an AHE. Thus, a major difference lies in the fact that our method considers a wider window of 30 and 60 minutes, prior to the onset of AHE [8]. This also indicates that a method, which is effective in performing predictions using wider time windows may be more suitable in a real time scenario, in comparison to statistical measures obtained from a 5 minutes window (prior to AHE). In this context, better results from the 5 minutes timespan prior to an AHE, may be due to temporal proximity to the onset of an AHE. For methods employing neural networks, both GRNN and RPS-NN report 10/10, 2/10 (for Event 1) and 37/40, 25/40 (for Event II). These methods tend to be strongly dependent on the tuning of parameter, as was also discussed by the authors [9]. The contrast mining method, on the other hand, helps to extract discretized sequential representations of the MAP time series, which provide the maximum support towards the occurrence of an AHE. These patterns are later useful, to not only predict an AHE for an unknown record, but for further clinical interpretation by domain experts. Our results indicate that sequential contrast patterns are capable of extracting informative symbolic episodes, which may be employed for both AHE risk prediction and understanding of hemodynamic behaviour towards effective analyses of sequential episodes, that may be indicative of medical symptoms.
V. Examples and Clinical Significance of Sequential Contrast Patterns
Acute hypotension is one of the most dangerous clinical conditions that frequently occurs in an ICU and can cause serious renal, cerebral and myocardial hypoxic damage. Existing medical interventions are reactive (i.e after an AHE has been triggered), for recommending treatment of underlying causes. In contrast, early bedside detection of AHEs can enable the development of life-saving interventions. Clinical interventions to treat AHE attempt to restore the physiological status of the body by targeting recommended BP values, increasing fluid and salt intakes, administration of vasoactive agents and so on [39], [40]. The AHE definition considered in the current study, utilizes hypotension thresholds reported in previous studies [15],[5]. Although ranges between 65–75 mmHg have also been reportedly used for defining hypotension, definitions for AHE time periods may also vary from 1 to 60 minutes, depending on the objective of the study. However, drops in blood pressure within smaller time spans (as indicated by monitoring systems), may not always indicate an AHE. Such changes may be due to monitoring errors or physiological changes caused by normal human activity. Hence, a larger time window of 30 minutes is a suitable definition for capturing AHE related information. Taking forward the suggested inclusion criteria for an AHE, we additionally employed the widely used ICD-9 code of hypotension to extract clinical records from MIMIC-II. The ICD-9 coding system describes a disease classification scheme used to monitor population group health situations for general epidemiological, health management purposes and clinical usage. The extracted datasets were sourced from the MIMIC-II repository, which tends to provide further credence to the study.
A. Sequential pattern examples
Our sequential pattern mining algorithm can discover simple-to-understand clinical symbolic subsequences. These subsequences can be treated as evidence while diagnosing for diseases. Even though methods such as neural networks and SVM demonstrate competitive prediction performances, they heavily dependent on non-linear kernel functions and parameters. But, our sequential pattern mining methods extract signatures of clinical episodes in the form of symbolic patterns.
In this study, we were able to mine a set of discretized sequential patterns like ABAEDBBBCA, which were prominent in acute hypotensive patients. Examples of representative sequential blood pressure patterns for hypotension are as reported in Table VII. For example, in the case of ABAEDBBBCA, the sequence indicates that the mean arterial pressure follows the given pattern trajectory among a majority of AHE patients. The given symbols indicate that the mean arterial pressure time series region was divided into 5 equiprobable regions (given by A, B, C, D, E) from 0 to 200 mmHg. The example pattern illustrates that the blood pressure time series followed a situation where majority of the AHE patients record an episode of events represented by the MAP value in a particular sequential order of blood pressure regimes demonstrated symbolically as follows – A ≤ B ≤ A ≤ E ≤ D ≤ B ≤ B ≤ B ≤ B ≤ C ≤ A. Thus, each sequential pattern describes a train of clinical events, represented by the specific blood pressure regimes, categorised by discrete symbols.
TABLE VII.
Representative Examples of Extracted AHE Sequential Patterns
| ..D..E..D..E..D..A..B..C..D..C.. |
| ..D..C..E..D..C..B..C..D..C..D.. |
| ..B..C..D..C..A..C..D..E..D..C.. |
| ..D..C..E..C..A..C..D..E..D..E.. |
| ..C..A..B..A..E..E..C..B..C..D.. |
| ..A..B..A..E..D..B..B..B..C..A.. |
| ..E..C..B..A..B..A..B..C..D.. |
| ..A..B..B..D..E..C..B..C..D.. |
B. Pattern visualization and clinical interpretation
Interpretive sequential representations can be extremely useful to clinicians for understanding the sequence of physiological states that a patient passes through, before developing a critical condition. Such interpretations can help establish potential combinations of observable physiological sequences, that precede AHE. Generally, the objective of clinical studies involves the estimation of causal relationships between selected clinical variables and disease specific laboratory test outcomes. Given temporal data for clinical variables, sequential patterns of specific clinical variables can aid in the interpretation of complex relationships between variables and patient specific outcomes. Towards this objective, general visual trends may be inferred from gap constrained sequences as shown in Figure 6. Thus, sequential patterns can have immense potential in the exploration of underlying clinical relationships to facilitate personalized treatments. Accordingly, similar studies have also claimed that the visual exploration of sequential and temporal patterns in clinical patient data can significantly aid in clinical decision making [53].
Fig. 6.

Inferring Visual Trends from Sequential Contrast Patterns Examples for AHE (A=1, B=2, C=3, D=4, E=5)
Moreover, mining of complex contrast sequences in hypotensive patient groups can aid in the development of interesting clinical hypotheses such as the detection of a succession of clinical events prior to the onset of AHEs. Thus, extracting sequential contrast patterns can guide clinical decision-making towards the effective investigation of hypotensive events. In addition, the proposed methodology is flexible enough to also accommodate clinician-defined constraints.
VI. Conclusion
The current study investigated the application of a novel sequential contrast pattern mining methodology for predicting acute hypotensive episodes in an ICU. Our study demonstrates that research on the mining of informative sequential patterns can be of significant clinical value to concerned stakeholder in a clinical setting. In addition to demonstrating the classification performance, we also established the existence of gap-constrained symbolic subsequences, which have strong clinical interest to practitioners. Since the data encoded of a patient’s journey is inherently temporal in nature, sequences have the capability to uncover numerous hidden patterns, which are otherwise not visible. As part of a knowledge discovery process, the contrast pattern mining method extracts patterns, which collectively help in the prediction of an AHE. A real-time application of the reported strategy can help derive significant sequential patterns of interest, which could be translated into a complex sequence of clinical events. A higher frequency of the occurrence of complex contrast sequences while comparing hypotensive and normotensive patient groups may be beneficial to a clinician to develop a clinical hypothesis relating to a succession of clinical events leading to an AHE. Extracting sequential patterns from hypotensive patient groups can inform medical decision-making towards the diagnosis and investigation of AHEs. Thus, significant patterns are a potential source for launching further data driven investigations validated by randomized clinical trials. Such patterns can also be employed in conjunction with multiple types of clinical features for the construction of accurate AHE prediction systems. In summary, the sequential contrast pattern mining approach described in this work well relates to the expectations of evidence-based medicine.
Acknowledgments
This work was partly supported by Australia Research Council Discovery Project (DP130102124) and the R01 grant EB001659 from the National Institute of Biomedical Imaging and Bioengineering (NIBIB) of the National Institutes of Health NIH. Mengling Feng is supported by the Agency for Science, Technology and Research Graduate Scholarship, Singapore. Shameek Ghosh is supported by the Dr A.P.J. Abdul Kalam & UTS Doctoral Scholarship, Australia.
Contributor Information
Shameek Ghosh, Advanced Analytics Institute, Faculty of Engineering and IT, University of Technology Sydney (UTS), Australia.
Mengling Feng, Laboratory for Computational Physiology, Harvard-MIT Joint Health, Science and Technology, Massachusetts Institute of Technology, Cambridge, USA and Institute of Infocomm Research, Singapore.
Hung Nguyen, Centre for Health Technologies, Faculty of Engineering and IT, University of Technology Sydney (UTS), Australia.
Jinyan Li, Advanced Analytics Institute, Faculty of Engineering and IT, University of Technology Sydney (UTS), Australia.
References
- 1.Boldt J. Clinical review: Hemodynamic monitoring in the intensive care unit. Critical Care. 2002;6(1):52. doi: 10.1186/cc1453. [DOI] [PMC free article] [PubMed] [Google Scholar]
- 2.Pinsky MR. Hemodynamic evaluation and monitoring in the ICU. CHEST Journal. 2007;132(6):2020–2029. doi: 10.1378/chest.07-0073. [DOI] [PubMed] [Google Scholar]
- 3.Saeed M, Villarroel M, Reisner AT, Clifford G, Lehman LW, Moody G, et al. Multiparameter Intelligent Monitoring in Intensive Care II (MIMIC-II): a public-access intensive care unit database. Critical care medicine. 2011;39(5):952. doi: 10.1097/CCM.0b013e31820a92c6. [DOI] [PMC free article] [PubMed] [Google Scholar]
- 4.Calkins H, Zipes DP. Heart Disease A Textbook of Cardiovascular Medicine. Philadelphia, PA: Saunders; 2005. Hypotension and syncope; pp. 909–19. [Google Scholar]
- 5.Moody GB, Lehman LH. Predicting acute hypotensive episodes: The 10th annual physioNet/computers in cardiology challenge. Computers in Cardiology. 2009:541–544. [PMC free article] [PubMed] [Google Scholar]
- 6.Saeed M, Mark R. AMIA Annual Symposium Proceedings. Vol. 2006. American Medical Informatics Association; 2006. A novel method for the efficient retrieval of similar multiparameter physiologic time series using wavelet-based symbolic representations; p. 679. [PMC free article] [PubMed] [Google Scholar]
- 7.Ghaffari A, Homaeinezhad MR, Atarod M, Akraminia M. Parallel processing of ECG and blood pressure waveforms for detection of acute hypotensive episodes: a simulation study using a risk scoring model. Computer methods in biomechanics and biomedical engineering. 2010;13(2):197–213. doi: 10.1080/10255840903099711. [DOI] [PubMed] [Google Scholar]
- 8.Chen X, Xu D, Zhang G, Mukkamala R. Forecasting acute hypotensive episodes in intensive care patients based on a peripheral arterial blood pressure waveform. Computers in Cardiology. 2009:545–548. [Google Scholar]
- 9.Henriques J, Rocha TR. Prediction of acute hypotensive episodes using neural network multi-models. Computers in Cardiology. 2009:549–552. doi: 10.1016/j.compbiomed.2011.07.006. [DOI] [PubMed] [Google Scholar]
- 10.Mneimneh MA, Povinelli RJ. A rule-based approach for the prediction of acute hypotensive episodes. Computers in Cardiology. 2009:557–560. [Google Scholar]
- 11.Jousset F, Lemay M, Vesin JM. Computers in cardiology/physioNet challenge 2009: Predicting acute hypotensive episodes. Computers in Cardiology. 2009;36:637–640. [PMC free article] [PubMed] [Google Scholar]
- 12.Langley P, King ST, Zheng D, Bowers EJ, Wang K, Allen J, Murray A. Predicting acute hypotensive episodes from mean arterial pressure. Computers in Cardiology. 2009:553–556. [Google Scholar]
- 13.Wang F, Lee N, Hu J, Sun J, Ebadollahi S, Laine AF. A Framework for Mining Signatures from Event Sequences and Its Applications in Healthcare Data. IEEE Transactions on Pattern Analysis and Machine Intelligence. 2013;35(2):272–285. doi: 10.1109/TPAMI.2012.111. [DOI] [PubMed] [Google Scholar]
- 14.Syed Z, Stultz C, Kellis M, Indyk P, Guttag J. Motif discovery in physiological datasets: a methodology for inferring predictive elements. ACM Transactions on Knowledge Discovery from Data (TKDD) 2010;4(1):2. doi: 10.1145/1644873.1644875. [DOI] [PMC free article] [PubMed] [Google Scholar]
- 15.Lee J, Mark RG. An investigation of patterns in hemodynamic data indicative of impending hypotension in intensive care. Biomedical engineering online. 2010;9(1):62. doi: 10.1186/1475-925X-9-62. [DOI] [PMC free article] [PubMed] [Google Scholar]
- 16.Lin J, Keogh E, Lonardi S, Chiu B. A symbolic representation of time series, with implications for streaming algorithms. Proceedings of the 8th ACM SIGMOD workshop on Research issues in data mining and knowledge discovery. 2003:2–11. [Google Scholar]
- 17.Dong G, Li J. Efficient mining of emerging patterns: Discovering trends and differences. Proceedings of the fifth ACM SIGKDD international conference on Knowledge discovery and data mining. 1999:43–52. [Google Scholar]
- 18.Ji X, Bailey J, Dong G. Mining minimal distinguishing subsequence patterns with gap constraints. Knowledge and Information Systems. 2007;11(3):259–286. [Google Scholar]
- 19.American Medical Association. International classification of diseases, 9th revision, clinical modification: physician ICD-9-CM, 2005: volumes 1 and 2, color-coded, illustrated. 2004;1 [Google Scholar]
- 20.Ghaffari A, Homaeinezhad MR, Atarod M, Akraminia M. A methodology for prediction of acute hypotensive episodes in ICU via a risk scoring model including analysis of ST-Segment Variations. Cardiovascular Engineering. 2010;10(1):12–29. doi: 10.1007/s10558-009-9088-x. [DOI] [PubMed] [Google Scholar]
- 21.Mayaud L, Lai PS, Clifford GD, Tarassenko L, Celi LA, Annane D. Dynamic data during hypotensive episode improves mortality predictions among patients with sepsis and hypotension. Critical care medicine. 2013;41(4):954. doi: 10.1097/CCM.0b013e3182772adb. [DOI] [PMC free article] [PubMed] [Google Scholar]
- 22.Giza F, Van Eyck J, Meyfroidt G. Predictive data mining on monitoring data from the intensive care unit. Journal of clinical monitoring and computing. 2013;27(4):449–453. doi: 10.1007/s10877-012-9416-3. [DOI] [PubMed] [Google Scholar]
- 23.Low PA. Prevalence of orthostatic hypotension. Clinical Autonomic Research. 2008;18(1):8–13. doi: 10.1007/s10286-007-1001-3. [DOI] [PubMed] [Google Scholar]
- 24.Schmid F, Goepfert MS, Reuter DA. Patient monitoring alarms in the ICU and in the operating room. Crit Care. 2013;17(2):216. doi: 10.1186/cc12525. [DOI] [PMC free article] [PubMed] [Google Scholar]
- 25.Nizami S, Green JR, McGregor C. Implementation of artifact detection in critical care: a methodological review. IEEE Reviews in Biomedical Engineering. 2013;6:127–142. doi: 10.1109/RBME.2013.2243724. [DOI] [PubMed] [Google Scholar]
- 26.Eshelman LJ, Lee KP, Frassica JJ, Zong W, Nielsen L, Saeed M. AMIA Annual Symposium Proceedings. Vol. 2008. American Medical Informatics Association; 2008. Development and evaluation of predictive alerts for hemodynamic instability in ICU patients; p. 379. [PMC free article] [PubMed] [Google Scholar]
- 27.Donald R, Howells T, Piper I, Chambers I, Citerio G, Enblad P, et al. Early warning of EUSIG-defined hypotensive events using a Bayesian Artificial Neural Network. Acta Neurochirurgica Supplementum. 2012;114(2012):39–44. doi: 10.1007/978-3-7091-0956-4_8. [DOI] [PubMed] [Google Scholar]
- 28.Owens PE, Lyons SP, O’Brien ET. Arterial hypotension: prevalence of low blood pressure in the general population using ambulatory blood pressure monitoring. Journal of human hypertension. 2000;14(4):243–247. doi: 10.1038/sj.jhh.1000973. [DOI] [PubMed] [Google Scholar]
- 29.Celi LA, Hinske LC, Alterovitz G, Szolovits P. An artificial intelligence tool to predict fluid requirement in the intensive care unit: a proof-of-concept study. Crit Care. 2008;12(6):R151. doi: 10.1186/cc7140. [DOI] [PMC free article] [PubMed] [Google Scholar]
- 30.Meyfroidt G, Giza F, Cottem D, De Becker W, Van Loon K, Aerts JM, et al. Computerized prediction of intensive care unit discharge after cardiac surgery: development and validation of a Gaussian processes model. BMC medical informatics and decision making. 2011;11(1):64. doi: 10.1186/1472-6947-11-64. [DOI] [PMC free article] [PubMed] [Google Scholar]
- 31.Moskovitch R, Walsh C, Hripsack G, Tatonetti N. Prediction of Biomedical Events via Time Intervals Mining. ACM KDD Workshop on Connected Health in Big Data Era. 2014 [Google Scholar]
- 32.Patnaik D, Butler P, Ramakrishnan N, Parida L, Keller BJ, Hanauer DA. Experiences with mining temporal event sequences from electronic medical records: initial successes and some challenges. Proceedings of the 17th ACM SIGKDD international conference on Knowledge discovery and data mining. 2011:360–368. [Google Scholar]
- 33.Batal I, Fradkin D, Harrison J, Moerchen F, Hauskrecht M. Mining recent temporal patterns for event detection in multivariate time series data. Proceedings of the 18th ACM SIGKDD international conference on Knowledge discovery and data mining. 2012:280–288. doi: 10.1145/2339530.2339578. [DOI] [PMC free article] [PubMed] [Google Scholar]
- 34.Toma T, Abu-Hanna A, Bosman RJ. Artificial Intelligence in Medicine. Springer; Berlin Heidelberg: 2007. Discovery and integration of organ-failure episodes in mortality prediction; pp. 97–106. [DOI] [PubMed] [Google Scholar]
- 35.Sacchi L, Bellazzi R, Larizza C, Porreca R, Magni P. Artificial Intelligence in Medicine. Springer; Berlin Heidelberg: 2005. Learning rules with complex temporal patterns in biomedical domains; pp. 23–32. [Google Scholar]
- 36.Bellazzi R, Larizza C, Magni P, Bellazzi R. Temporal data mining for the quality assessment of hemodialysis services. Artificial intelligence in medicine. 2005;34(1):25–39. doi: 10.1016/j.artmed.2004.07.010. [DOI] [PubMed] [Google Scholar]
- 37.Bellazzi R, Ferrazzi F, Sacchi L. Predictive data mining in clinical medicine: a focus on selected methods and applications. Wiley Interdisciplinary Reviews: Data Mining and Knowledge Discovery. 2011;1(5):416–430. [Google Scholar]
- 38.Moskovitch R, Shahar Y. AMIA Annual Symposium Proceedings. Vol. 2009. American Medical Informatics Association; 2009. Medical temporal-knowledge discovery via temporal abstraction; p. 452. [PMC free article] [PubMed] [Google Scholar]
- 39.Shibao C, Lipsitz LA, Biaggioni I. ASH position paper: evaluation and treatment of orthostatic hypotension. The Journal of Clinical Hypertension. 2013;15(3):147–153. doi: 10.1111/jch.12062. [DOI] [PMC free article] [PubMed] [Google Scholar]
- 40.Takala J. Should we target blood pressure in sepsis? Critical care medicine. 2010;38(10):S613–S619. doi: 10.1097/CCM.0b013e3181f2430c. [DOI] [PubMed] [Google Scholar]
- 41.Ayres J, Flannick J, Gehrke J, Yiu T. Sequential pattern mining using a bitmap representation. Proceedings of the eighth ACM SIGKDD international conference on Knowledge discovery and data mining. 2002:429–435. [Google Scholar]
- 42.Chan S, Kao B, Yip CL, Tang M. Mining emerging substrings. Eighth International Conference on Database Systems for Advanced Applications. 2003:119–126. [Google Scholar]
- 43.Xing Z, Pei J, Keogh E. A brief survey on sequence classification. ACM SIGKDD Explorations Newsletter. 2010;12(1):40–48. [Google Scholar]
- 44.Shah NH, Tenenbaum JD. The coming age of data-driven medicine: translational bioinformatics’ next frontier. Journal of the American Medical Informatics Association. 2012;19(e1):e2–e4. doi: 10.1136/amiajnl-2012-000969. [DOI] [PMC free article] [PubMed] [Google Scholar]
- 45.Fournier PA, Roy JF. Acute hypotension episode prediction using information divergence for feature selection, and non-parametric methods for classification. Computers in Cardiology. 2009;2009:625–628. [Google Scholar]
- 46.Anderson RJ. Plumbing the depths of blood pressure: Hypotensive hemorrhage and acute kidney injury*. Critical care medicine. 2011;39(9):2196–2197. doi: 10.1097/CCM.0b013e3182217465. [DOI] [PubMed] [Google Scholar]
- 47.Angus DC, van der Poll T. Severe sepsis and septic shock. New England Journal of Medicine. 2013;369(9):840–851. doi: 10.1056/NEJMra1208623. [DOI] [PubMed] [Google Scholar]
- 48.Awad HH, Anderson FA, Jr, Gore JM, Goodman SG, Goldberg RJ. Cardiogenic shock complicating acute coronary syndromes: insights from the Global Registry of Acute Coronary Events. American heart journal. 2012;163(6):963–971. doi: 10.1016/j.ahj.2012.03.003. [DOI] [PubMed] [Google Scholar]
- 49.Singh A, Tamminedi T, Yosiphon G, Ganguli A, Yadegar J. Hidden Markov Models for modeling blood pressure data to predict acute hypotension. IEEE International Conference on Acoustics Speech and Signal Processing (ICASSP) 2010:550–553. [Google Scholar]
- 50.Rocha T, Paredes S, De Carvalho P, Henriques J. Prediction of acute hypotensive episodes by means of neural network multi-models. Computers in biology and medicine. 2011;41(10):881–890. doi: 10.1016/j.compbiomed.2011.07.006. [DOI] [PubMed] [Google Scholar]
- 51.Ghassemi M, Lehman LH, Snoek J, Nemati S. Global Optimization Approaches for Parameter Tuning in Biomedical Signal Processing: A Focus of Multi-scale Entropy. Computing in Cardiology Conference (CinC) 2014:993–996. [Google Scholar]
- 52.Perer A, Wang F. Frequence: Interactive mining and visualization of temporal frequent event sequences. Proceedings of the 19th international conference on Intelligent User Interfaces. 2014:153–162. [Google Scholar]
- 53.Gotz D, Wang F, Perer A. A methodology for interactive mining and visual analysis of clinical event patterns using electronic health record data. Journal of biomedical informatics. 2014;48:148–159. doi: 10.1016/j.jbi.2014.01.007. [DOI] [PubMed] [Google Scholar]
- 54.Tseng VS, Lee CH. Effective temporal data classification by integrating sequential pattern mining and probabilistic induction. Expert Systems with Applications. 2009;36(5):9524–9532. [Google Scholar]
- 55.Tseng VS, Lee CH. Cbs: A new classification method by using sequential patterns. SDM 2005: Proc of the 2005 SIAM International Data Mining Conference. 2005 [Google Scholar]