Abstract
Human lumbar spine is composed of multiple tissue components that serve to provide structural stability and proper nutrition. Conventional magnetic resonance (MR) imaging techniques have been useful for evaluation of IVD, but inadequate at imaging the discovertebral junction and ligamentous tissues due primarily to their short T2 nature. Ultrashort time to echo (UTE) MR techniques acquire sufficient MR signal from these short T2 tissues, thereby allowing direct and quantitative evaluation. This article discusses the anatomy of the lumbar spine, MR techniques available for morphologic and quantitative MR evaluation of long and short T2 tissues of the lumbar spine, considerations for T2 relaxation modeling and fitting, and existing and new techniques for spine image post-processing, focusing on segmentation. This article will be of interest to radiologic and orthopaedic researchers performing lumbar spine imaging.
Keywords: Low back pain, intervertebral disc, discovertebral junction, cartilaginous endplate (CEP), vertebral body, image processing
The lumbar spine anatomy, degeneration, and low back pain
Intervertebral discs (IVD) have a complex structure (Figure 1A), whereby a central nucleus pulposus (NP) is surrounded by layers of annulus fibrosus (AF). In young adults with healthy IVDs, the NP has high water and glycosaminoglycan contents, which provide resistance to compression. AF naturally has low water content, but it is high in collagen content from concentric lamellar sheets of collagen fibers. Between an IVD and a vertebral body (Figure 1B), or the disco-vertebral junction (DVJ), there exists a ~1 mm thin layer of connective tissue known as cartilaginous endplate (CEP). The normal CEP in adults consists of ~0.1 mm thick calcified and thicker uncalcified cartilage layers, whose roles include attachment of the IVD to the vertebral body, and facilitation of transport of solutes into and out of the IVD via an adjacent bed of capillaries within the bony vertebral endplate (1). The vertebral body, consisting of cortical and trabecular bone along with bone marrow, is another integral part of the lumbar spine.
Figure 1.
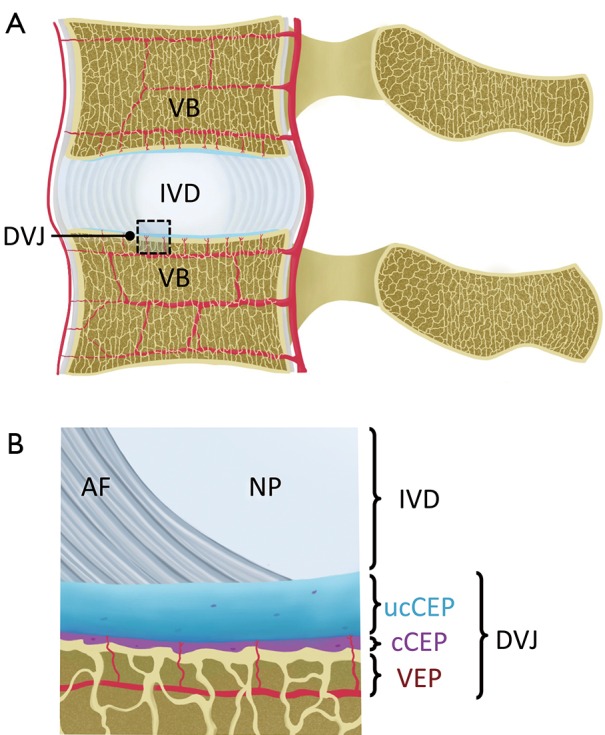
Sectional anatomy of lumbar spine in the mid-sagittal plane. (A) Components including the vertebral body (VB), intervertebral disc (IVD), and the interface between the two, discovertebral junction (DVJ), are shown. Vasculature is also shown; (B) close-up schematic of the DVJ, showing components of the IVD including annulus fibrosus (AF) and nucleus pulposus (NP), DVJ including uncalcified cartilaginous endplate (ucCEP), calcified cartilaginous endplate (cCEP), and bony vertebral endplate (VEP).
Low back pain afflicts a large number of people (2) and may involve degeneration or injury in a number of components of the lumbar spine, along with back muscle injury. These may include IVD degeneration (3), fracture of the vertebral body due to compression (4), fracture at the DVJ developing into Schmorl’s node (5), as well as bone marrow Modic changes (6,7). Cartilaginous and bony endplates near the DVJ are also likely to be pain sources, given rich nerve endings in the region (8), and increased density of nerve fibers in the DVJ observed in painful patients (9).
There is a need to evaluate multiple components of the lumbar spine non-invasively. This article covers a number of techniques available to evaluate the lumbar spine, including conventional and novel morphologic and quantitative sequences, as well as considerations for analyzing and post-processing MR images for quantitative evaluation.
Conventional morphologic MR imaging of the lumbar disc
The anatomy of the lumbar spine can be partially evaluated by conventional MR techniques. Using spin echo sequences with different weighting, a number of components of the spine can be observed directly, unlike images from the plain film or computed tomography. In clinical settings, T2- and T1-weighted spin-echo images taken in sagittal (Figure 2A,B) and axial (Figure 2B,C) planes may be used to evaluate spinal conditions including disc degeneration, disc herniation, and abnormalities of the vertebral bones, bone marrow and the spinal cord. T2-weighted images are sensitive to disc hydration (10), and shows NPs of relatively normal discs with high signal intensity (Figure 2A, L2/L3 and L3/L4, arrowheads), and NPs of degenerated discs with low signal intensity (Figure 2A, L1/L2 and L5/S1, arrows). The degenerated disc at L5/S1 also has a posterior protrusion with a high signal intensity zone (Figure 2A,B, curved arrow). On the axial images, the shape of the protrusion (Figure 2C,D, curved arrows) is seen as broad-based, covering 25 to 50% of disc circumference.
Figure 2.
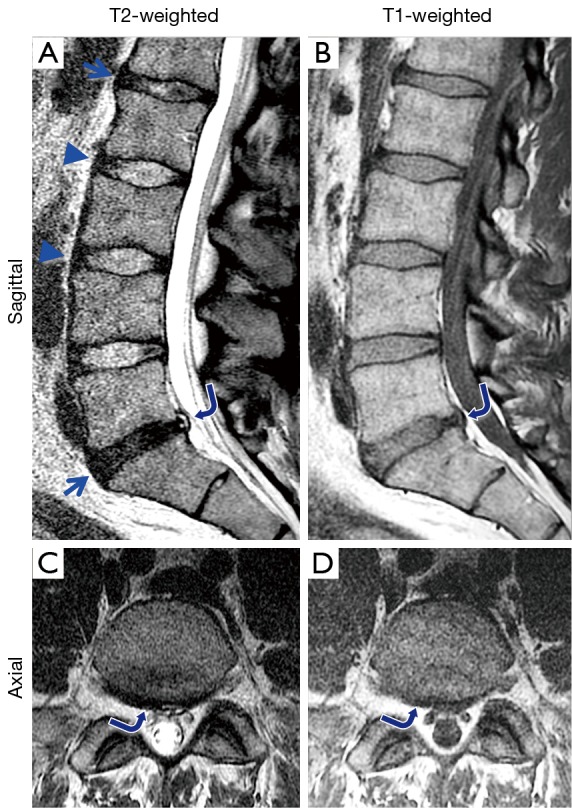
Sagittal (A) T2- and (B) T1-weighted spin echo images of a lumbar spine, demonstrating both normal (arrowheads) and degenerated (arrows) discs. Degenerated disc at L5/S1 level exhibits a posterior protrusion (curved arrow) with high signal intensity zone. Axial (C) T2- and (D) T1-weighted images taken at L5/S1 showing the morphology of the protruding disc (curved arrow).
Morphologic grading systems have been devised to determine severity and morphology of IVD degeneration visible on conventional MR images. The Pfirrmann grading looks at disc structure, signal intensity and disc height (11,12) in sagittal T2-weighted spin echo images, to grade IVDs from 1 (normal) to 5 (complete collapse). These grading systems have been adapted to evaluate efficacy of disc therapeutics in animals (13,14). Additionally, other features such as annular tears and fissures, vertebral body marrow changes, shape of disc herniation in the sagittal and axial planes can be evaluated per established classification (15) and nomenclature (16) schemes with high accuracy (17,18).
Conventional quantitative MRI of the lumbar discs
In an effort to supplement the conventional methods, and to provide more objective biomarkers for spine health, several quantitative MR techniques have been implemented. Quantitative MR measures of the disc have been shown to correlate with biochemical content (19), biomechanical function (20), and even discogenic pain (21), which may supplement conventional MR evaluation. Potential applications include the early detection of disc degeneration and evaluation of the efficacy of disc treatment.
T1 relaxation constant is the rate of the regrowth of longitudinal magnetization, and techniques such as inversion recovery (22), saturation recovery (23), and variable flip angle (24) method are available. It has been reported that T1 decreases with disc degeneration (10,25), disc herniation (26), and water loss (10,25,27). T1 measurement has also been demonstrated useful when used in conjunction with the delayed gadolinium-enhanced MRI of cartilage (dGEMRIC) technique (28), which uses negatively charged contrast agents that distribute inversely proportional to GAGs and decreases T1 value. Using this technique Vaga et al. (29) reported that ΔT1 (T1 value without contrast minus T1 value with contrast) values correlated inversely with GAG content in discectomy tissues; ΔT1 was higher where there was less GAG.
T2 relaxation is another fundamental MR behavior, and it refers to the decay of transverse magnetization. T2 value is often determined by obtaining multiple images at constant repetition time (TR) while varying echo times (TE), and fitting the signal intensity to an exponential signal decay model (Figure 3). Most scanners nowadays offer product sequences such as multi echo spin echo, which obtains multiple T2-weighted images in one scan (30, 31), and create color maps of T2 values of the disc (Figure 3, insert). While as few as two images with different T2-weighting can be used to created color maps, additional images improve the accuracy in the presence of random noise. T2 values also correlate with water and proteoglycan contents of the disc such that T2 decreases with water loss (10,25,27,32) and proteoglycan loss (27,32). T2 values are also found to be lower in herniated discs from symptomatic subjects (33), suggesting correlation with pain, although the causality is not clear. T2 mapping may be useful when following the efficacy of biologic treatments (34), where subtle biochemical or cellular changes are expected, rather than marked morphologic and signal changes.
Figure 3.
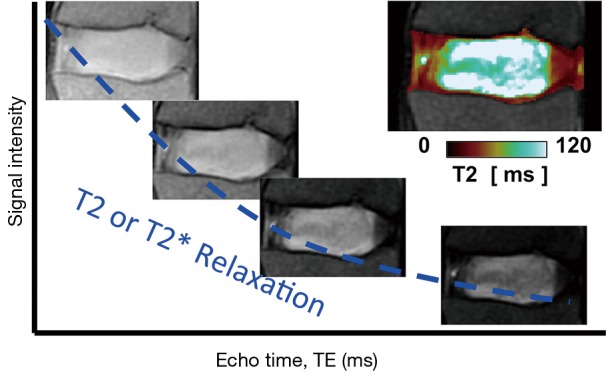
An illustration of exponential fitting and color mapping of T2 or T2* relaxation values in an intervertebral disc. Images are obtained at multiple echo times (n=4 in this example), and signal intensity of each voxel is fit to an exponential decay model to obtain T2 or T2* value of the voxel to create a color map (insert).
More recently, T1rho techniques have been used to evaluate slowly moving macromolecules such as proteoglycans in the NP by measuring transverse relaxation in the presence of a spin-locking pulse (35). In most implementations, reviewed in (36), T1rho preparation pulses with varying spin lock times are applied, followed by image acquisition with a set TR and TE. The resulting images are T1rho-weighted, to which an exponential fitting is performed to obtain T1rho maps. It has been reported that T1rho decreases with water and proteoglycan loss (19,37) and it has also been correlated with discogenic pain (21). Both the T2 (Figure 4A,B) and T1rho (Figure 4C,D) values are sensitive to disc degeneration, and correlate strongly with each other when measured on the same sample (38,39). However, there are subtle differences in spatial distribution of T2 and T1rho values (Figure 4, arrows), even when considering that T1rho values are higher than T2 values in general. In addition, it has been reported that T1rho values have greater dynamic range and are more sensitive to clinical indices (38) than T2 values. However, the published data is still limited, and additional work is needed to establish which quantitative techniques are best suited to evaluate disc degeneration. Additionally, T1rho sequence are not yet widely available, limiting the use to translational research.
Figure 4.
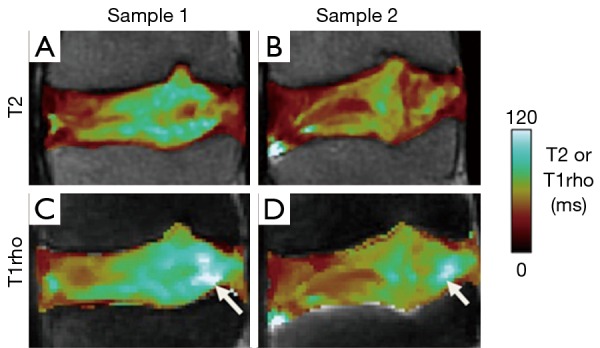
Comparison of (A,B) T2 and (C,D) T1rho color maps of mild (A,C) and moderately (B,D) degenerated disc samples in the sagittal plane. Note overall higher values of T1rho than T2, as well as differences in spatial distribution of the values (arrows).
MR imaging of the CEP and other short T2 tissues with UTE techniques
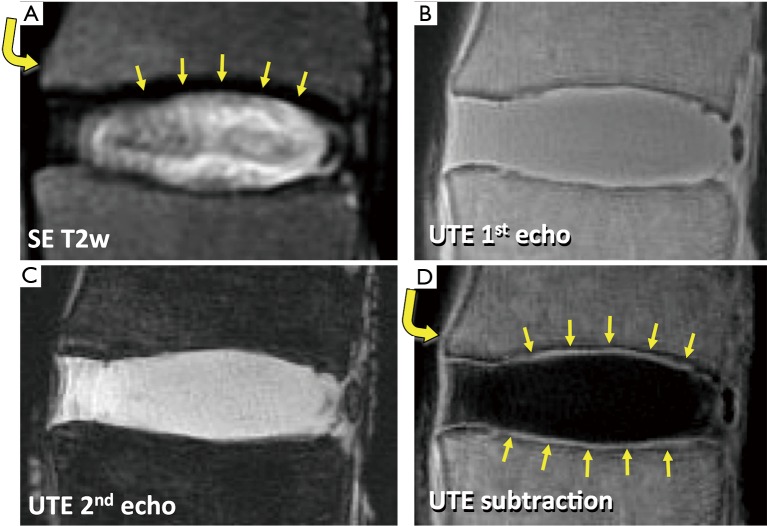
While the conventional MR techniques are useful for evaluation of IVD and other soft tissues visible on conventional MR images, several other components of the lumbar spine appear dark and cannot be examined directly. These include the CEP (Figure 1B), longitudinal ligaments (Figure 5A, curved arrow) and ligamentum flavum. Additionally, due to the lack of contrast between the CEP and bony vertebral endplate (Figure 5A, arrows), sclerosis and other subtle bony endplate changes cannot be discerned on conventional images. The low signal intensity from these tissues is due in part to their intrinsically short T2 characteristics. Their T2 values can range from less than 1 ms in the bone (40) to about 2 to 4 ms in the ligaments (41) and the CEP (42). Given relatively long TE values in conventional spine imaging such as spin echo techniques (typically 10 to over 100 ms), MR signals from these short T2 tissues decay too rapidly to be captured. While it is possible to capture signal from uncalcified CEP using gradient echo techniques employing shorter TE of 2 to 4 ms (43), the image contrast for the CEP may be suboptimal, and it may not capture signal from calcified layers of the CEP with even shorter T2 values, likely less than 1 ms.
Figure 5.
Sagittal MR images of a lumbar disc segment obtained with (A) conventional spin echo sequence at TR of 2,000 ms and TE of 80 ms, 2-D UTE sequence at TR of 400 ms and TE of (B) 0.008 ms and (C) 5 ms, and (D) digital subtraction of UTE images (1st TE image minus 2nd TE image). On the spin echo image (A), structures including cartilaginous endplates (CEP) (arrows) and anterior longitudinal ligament (curved arrow) exhibit low signal intensity. After digital image subtraction (D), these short T2 tissues (arrows, curved arrow) are seen with high signal intensity and distinct from adjacent tissues.
MR sequences have been developed (44-51) in order to image tissues with very short T2 by utilizing the ultrashort TE (UTE) in the order of several microseconds. In certain UTE techniques, the minimum TE can be reduced to as short as 0.008 ms (40). When imaged with a two-dimensional UTE technique (40), a lumbar disc segment can be seen with high signal intensity throughout (Figure 5B), since the MR signal from both long and short T2 tissues are captured at the same time. To modulate image contrast, specifically to suppress long T2 signal while preserving short T2 signals of interest, a simple technique of digital image subtraction (52,53) can be used. Here, two images at different echo times are acquired; the first image is obtained at the minimum UTE, and the second image is obtained at longer TEs, typically greater than a few ms. The first image contains MR signal from both short and long T2 tissues (Figure 5B), while the second image contains the signal largely from the long T2 tissues (Figure 5C) since the short T2 signals have decayed markedly. Therefore, subtracting the second image from the first image can produce an image that accentuates only the short T2 tissues (Figures 5D). Using different TEs (by varying the second TE usually), short T2 contrast can be optimized (54). Other techniques to suppress long T2 signal includes inversion nulling of water (55,56), nulling of water and fat using dual adiabatic inversion recovery (57), and long T2 water saturation (46,58). In addition, short T2 tissues often have short T1 values. NP has a long T1 value over 1000 ms, while T1 value of the CEP is about half of that (43). Therefore, the signal intensity from short T2 tissues can be accentuated by changing TR and flip angle utilizing such T1 differences (43,59). While promising, these techniques have not yet seen a wide-spread use clinically, due to the lack of commercial availability on all platforms, as well as additional cost for the sequence.
Quantitative analysis: MR relaxation fitting
As described earlier, quantitative MR techniques can provide objective and sensitive biomarkers for biochemical contents of tissues and disc health. Quantitative MR relaxation constants can be measured by acquiring series of images with different weighting, and by fitting the signal intensity to an appropriate relaxation model. For example, in order to estimate T2 values for a specific voxel of tissue, multiple T2-weighted images are acquired at different TEs, and then decaying MR signal for each voxel is fitted to a mono-exponential relaxation model, with or without a noise constant, to determine the T2 values and create color maps (Figure 6A). A noise constant is an important factor for accurate estimation of T2 values, especially when the T2 value is small and signal-to-noise ratio (SNR) is low. SNR is defined by the ratio of signal strength (or intensity) to noise strength (or noise standard deviation, σ). When the SNR is low, the noise introduced in the acquired MR image is persistent regardless of scanning parameters (e.g., at long TE), which makes fitting inaccurate. Overestimation of T2 is often observed in this case. To correct for noise, a noise constant may be included in the fitting algorithm (60,61). When the noise strength (σ) can be reliably estimated in the magnitude MR images, these noise-corrected methods result in accurate T2 estimation even when SNR is as low as 20 (61). If SNR is over 100, the noise statistics approximates to a zero-mean Gaussian distribution and an uncorrected fitting without a noise constant can still result in an accurate estimation of T2 values.
Figure 6.
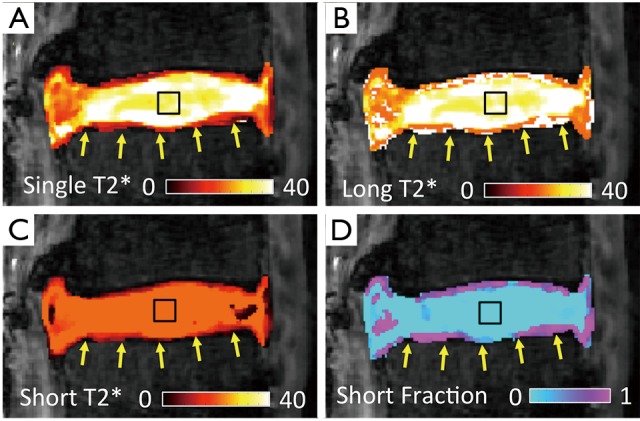
Comparison of a single component vs. bicomponent T2* analysis of a lumbar intervertebral disc. (A) Single component and (B,C,D) bi-component analysis of UTE T2* data. In the NP (square), (A) single T2* and (B) long T2* values are similar, and (C) there is little variation in short T2* values or (D) their fraction. In the CEP (arrows), however, both (B) long and (C) short T2* values vary in distribution and (D) fraction.
It has been evident from nuclear magnetic resonance (NMR) spectroscopic studies that certain biological tissues exhibit a mixed relaxation behavior from multiple T2 components (62). With sufficient SNR (for both long and short T2 components), and number of images, MR imaging could also be used to determine multiple T2 or T2* values at a voxel. In musculoskeletal systems, the advent of UTE techniques has enabled acquisition of short T2* signal and facilitated multicomponent analysis of bony (63), ligamentous (63), and cartilaginous (63-65) tissues. An example of multi-component T2* mapping of a lumbar segment is shown in Figure 6, illustrating large proportion of long T2* component in the NP (Figure 6D, square) and a small proportion of short T2* component in the CEP (Figure 6D, arrow). While promising, multi-component analyses of MR images are difficult since non-unique solutions may exist for a given MR data, especially when SNR is low and substantial noise is present in the images. Many limitations of multi-component analyses have been described (66,67).
Because multicomponent fitting is sensitive to SNR, certain types of constraints are generally used in the fitting procedure. For example, the total number of components could be limited to 2, representing a short T2* and a longer T2* bi-components in a single voxel. Since the MR images are generally produced as a sum of squares of the real and imaginary signal measurements, the noise has a non-zero value which may act as a long relaxation component in the signal and affect the fitting accuracy (68). Therefore, the noise is also usually included in the fitting model as a constant. The noise constant can be estimated in a separate procedure (63,69,70), or estimated as a parameter during the fitting process (71-73). Care must be taken when the magnitude MR images are obtained with multichannel coils and parallel imaging techniques since these conditions change the noise statistics (74).
In addition to fitting data to models that assume two or more discrete T2 components, models have been developed that assume a distributed T2 components or a continuous T2 spectrum (75). In this approach, a distribution of T2 components (i.e., T2 spectrum) are included in the decay signal model, which is fitted using non-linear algorithms such as a non-negative least squares (NNLS) algorithm (76). Since there are too many unknown parameters (spectrum magnitudes) to be estimated and the problem is ill-posed (77), a constraint is usually incorporated to smooth the magnitudes of the neighboring T2 values (i.e., regularize) (75). This approach does not require a prior information on the number of components, and provides a distribution of T2 components in a tissue. Figure 7 shows an example of multicomponent fitting performed with a bicomponent model (Figure 7A) and a distributed model (Figure 7B). Regularized NNLS algorithms provide resilient fitting results, but biases can occur depending on the SNR and noise types (68). Several variations of the NNLS technique have also been described (78-81). These fitting approaches may be useful when the number of components cannot be determined a priori.
Figure 7.
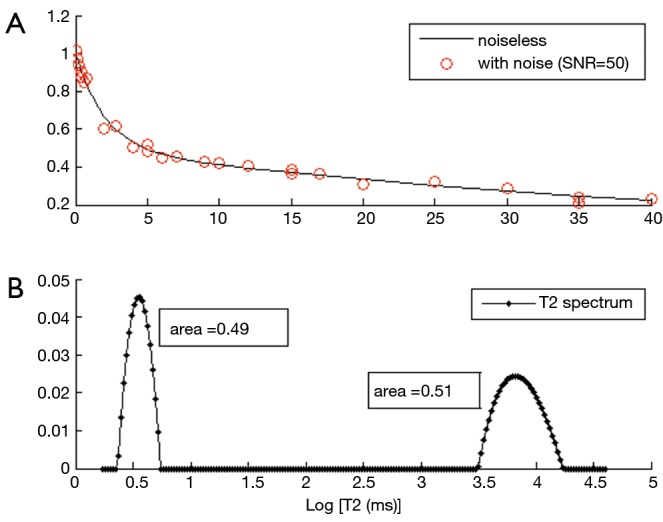
Comparison of a bicomponent analysis vs. a distributed T2 spectrum analysis. (A) Bicomponent simulation was performed with a short T2 component (T2short =2 ms, short fraction =50%) and a long T2 component (T2long =50 ms, long fraction =50%), showing a noiseless decay signal (solid line) and noisy signal with signal-to-noise ratio of 50 (open circle); (B) distributed T2 spectrum analysis of the noisy data, performed using regularized non-negative least square method with a smoothness constraint, shows both short and long T2 components as spectra. The fraction of short and long T2 component can be obtained from the areas under each curve around the peaks.
Quantitative analysis: MR image post-processing
After acquisition of MR images, quantitative analyses often require segmentation of the images (82) to define appropriate regions of interest. For the lumbar spine, automated segmentation of the vertebral body and the IVD have been challenging due their irregular shape and heterogeneous signal intensity, especially for degenerated discs (83). Nonetheless, a number of segmentation techniques based on post-processing has been proposed, including thresholding (84,85), edge-detection (86), graph-cut based methods (87,88), and atlas-based methods (89, 90).
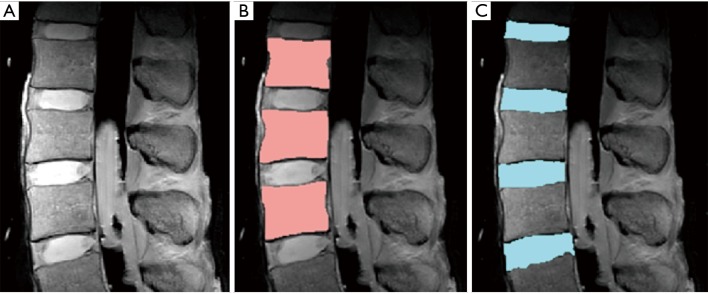
Edge detection is a simple but an effective technique that detects an edge based on spatial gradient of signal intensities (91). When applied to a proton-density weighted (TR =2,000 ms, TE =10 ms) MR images (Figure 8A), edge detection could effectively segment the vertebral body (Figure 8B) and the IVD (Figure 8C). In this example, the canny edge detection method (91) was used. For segmentation of vertebral body, voxel intensities were evaluated radially from the center of the ROI outward to detect rapidly changing intensity due to the cortical shell. The outermost boundary edges, disconnected focally, are then connected through erosion and dilation process (86) to complete the segmentation. Difficulties arise when the image contains irregular and disconnected bony boundaries, or when bone marrow changes result in irregular internal signal intensities. The segmentation of the IVD in this example relied upon successful segmentation of the vertebral body for the superior and inferior boundaries, and additional edge detection for the anterior and posterior boundaries. Distortion of geometry and signal intensity due to conditions such as disc herniation may degrade the segmentation performance.
Figure 8.
Segmentation of vertebral body and intervertebral disc on MR data. (A) Proton density weighted image was analyzed using a Canny edge detection technique to perform (B) vertebral body segmentation, and subsequently, (C) intervertebral disc segmentation.
The graph-cut method, a relatively recent development that gained popularity, performs segmentation by making “cuts” that have associated energies that can be minimized. As an example, a variation of graph-cut method (92) was applied to a spine MR data. This method finds an energy cost for making cuts between a set of nodes that are on the radial lines extending from the center of the vertebral body outward, to efficiently search a square-shaped structure such as the vertebral body. The algorithm has also been extended to 3-D (93), which uses a cuboid search region and the rays that extend radially in a sphere. Graph-cut methods are being advanced by including spatial information (94) to improve robustness (overcome noise) and accuracy. Limitations of this technique includes variable performance that depends on the position of seed point, as well as lower spatial resolution of the segmentation when the boundary of the segmented region is far from the seed point. Additionally, the technique is not well-suited for segmenting thin objects, or multiple regions of interest simultaneously (95).
Yet another approach is atlas-based segmentation, involving the creation of an atlas (or a template) of a region of interest based on a training data, and applying the atlas to the target data. This approach may be useful for analyzing the NP and AF of the intervertebral disc separately, especially in degenerated discs that lack defined NP (Figure 2A, arrow). In one implementation (89), an atlas of NP and AF was created from MR images of grade 1 discs (that had distinct NPs) and registered (96) against the AF boundary of the target images, for the purposes of determining average T2 values of the NP and AF on color maps. In another implementation (90), a probabilistic atlas was used to overcome the partial volume effect and the overlapping problems of gray-level values. However, the performance of this method depends on the amount and quality of images of discs which form the probabilistic atlas (i.e., training data) and showed reduced accuracy for degenerated cases.
Conclusions
In conclusion, quantitative MR sequences and UTE sequences offer additional ways for evaluation of health and injury of the lumbar spine to supplement conventional clinical MR imaging. Sensitivity of quantitative MR measures to degeneration of IVD have been well-established in literature, facilitated by techniques to segment regions of interest and to determine accurate MR measures from the regions using different relaxation models with consideration for noise. UTE sequences offer a unique contrast mechanism useful for previously unevaluated discovertebral junction of the spine, creating new opportunities to diagnose and characterize the tissue. Combined with continuing basic research on pathophysiology of spine diseases, along with advancements in techniques to accurately localize and quantitatively evaluate different regions of the lumbar spine, a wider-spread in quantitative and novel MR techniques may be realized.
Acknowledgements
Funding: This article was made possible in part by grants from the National Research Foundation of Korea (NRF) grant funded by the Korea government (MSIP) (2016R1A2R4015016) in support of Dr. Hwang, the Clinical Science Research & Development of the VA Office of Research and Development (Award Number 5I01CX000625; Project ID: 1161961) in support of Dr. Christine B. Chung, and the National Institute of Arthritis and Musculoskeletal and Skin Diseases of the National Institutes of Health in support of Dr. Won C. Bae (Grant Number R01 AR066622).
Disclaimer: The contents of this paper are solely the responsibility of the authors and do not necessarily represent the official views of the funding agencies.
Footnotes
Conflicts of Interest: The authors have no conflicts of interest to declare.
References
- 1.Crock HV, Goldwasser M. Anatomic Studies of the Circulation in the Region of the Vertebral End-Plate in Adult Greyhound Dogs. Spine 1984;9:702-6. 10.1097/00007632-198410000-00009 [DOI] [PubMed] [Google Scholar]
- 2.Andersson GB. Epidemiological features of chronic low-back pain. Lancet 1999;354:581-5. 10.1016/S0140-6736(99)01312-4 [DOI] [PubMed] [Google Scholar]
- 3.An HS, Anderson PA, Haughton VM, Iatridis JC, Kang JD, Lotz JC, Natarajan RN, Oegema TR, Jr, Roughley P, Setton LA, Urban JP, Videman T, Andersson GB, Weinstein JN. Introduction: disc degeneration: summary. Spine 2004;29:2677-8. 10.1097/01.brs.0000147573.88916.c6 [DOI] [PubMed] [Google Scholar]
- 4.Silverman SL. The clinical consequences of vertebral compression fracture. Bone 1992;13 Suppl 2:S27-31. 10.1016/8756-3282(92)90193-Z [DOI] [PubMed] [Google Scholar]
- 5.Abu-Ghanem S, Ohana N, Abu-Ghanem Y, Kittani M, Shelef I. Acute schmorl node in dorsal spine: an unusual cause of a sudden onset of severe back pain in a young female. Asian Spine J 2013;7:131-5. 10.4184/asj.2013.7.2.131 [DOI] [PMC free article] [PubMed] [Google Scholar]
- 6.Modic MT, Steinberg PM, Ross JS, Masaryk TJ, Carter JR. Degenerative disk disease: assessment of changes in vertebral body marrow with MR imaging. Radiology 1988;166:193-9. 10.1148/radiology.166.1.3336678 [DOI] [PubMed] [Google Scholar]
- 7.Luoma K, Vehmas T, Kerttula L, Grönblad M, Rinne E. Chronic low back pain in relation to Modic changes, bony endplate lesions, and disc degeneration in a prospective MRI study. Eur Spine J 2016;25:2873-81. 10.1007/s00586-016-4715-x [DOI] [PubMed] [Google Scholar]
- 8.Fields AJ, Liebenberg EC, Lotz JC. Innervation of pathologies in the lumbar vertebral end plate and intervertebral disc. Spine J 2014;14:513-21. 10.1016/j.spinee.2013.06.075 [DOI] [PMC free article] [PubMed] [Google Scholar]
- 9.Brown MF, Hukkanen MV, McCarthy ID, Redfern DR, Batten JJ, Crock HV, Hughes SP, Polak JM. Sensory and sympathetic innervation of the vertebral endplate in patients with degenerative disc disease. J Bone Joint Surg Br 1997;79:147-53. 10.1302/0301-620X.79B1.6814 [DOI] [PubMed] [Google Scholar]
- 10.Chatani K, Kusaka Y, Mifune T, Nishikawa H. Topographic differences of 1H-NMR relaxation times (T1, T2) in the normal intervertebral disc and its relationship to water content. Spine (Phila Pa 1976) 1993;18:2271-5. 10.1097/00007632-199311000-00022 [DOI] [PubMed] [Google Scholar]
- 11.Pearce RH, Thompson JP, Bebault GM, Flak B. Magnetic resonance imaging reflects the chemical changes of aging degeneration in the human intervertebral disk. J Rheumatol Suppl 1991;27:42-3. [PubMed] [Google Scholar]
- 12.Pfirrmann CW, Metzdorf A, Zanetti M, Hodler J, Boos N. Magnetic resonance classification of lumbar intervertebral disc degeneration. Spine 2001;26:1873-8. 10.1097/00007632-200109010-00011 [DOI] [PubMed] [Google Scholar]
- 13.Masuda K, Imai Y, Okuma M, Muehleman C, Nakagawa K, Akeda K, Thonar E, Andersson G, An HS. Osteogenic protein-1 injection into a degenerated disc induces the restoration of disc height and structural changes in the rabbit anular puncture model. Spine 2006;31:742-54. 10.1097/01.brs.0000206358.66412.7b [DOI] [PubMed] [Google Scholar]
- 14.Lee S, Moon CS, Sul D, Lee J, Bae M, Hong Y, Lee M, Choi S, Derby R, Kim BJ, Kim J, Yoon JS, Wolfer L, Kim J, Wang J, Hwang SW, Lee SH. Comparison of growth factor and cytokine expression in patients with degenerated disc disease and herniated nucleus pulposus. Clin Biochem 2009;42:1504-11. 10.1016/j.clinbiochem.2009.06.017 [DOI] [PubMed] [Google Scholar]
- 15.Jensen TS, Sorensen JS, Kjaer P. Intra- and interobserver reproducibility of vertebral endplate signal (modic) changes in the lumbar spine: the Nordic Modic Consensus Group classification. Acta Radiol 2007;48:748-54. 10.1080/02841850701422112 [DOI] [PubMed] [Google Scholar]
- 16.Fardon DF, Williams AL, Dohring EJ, Murtagh FR, Gabriel Rothman SL, Sze GK. Lumbar disc nomenclature: version 2.0: recommendations of the combined task forces of the North American Spine Society, the American Society of Spine Radiology, and the American Society of Neuroradiology. Spine (Phila Pa 1976) 2014;39:E1448-65. 10.1097/BRS.0b013e3182a8866d [DOI] [PubMed] [Google Scholar]
- 17.Forristall RM, Marsh HO, Pay NT. Magnetic resonance imaging and contrast CT of the lumbar spine. Comparison of diagnostic methods and correlation with surgical findings. Spine (Phila Pa 1976) 1988;13:1049-54. 10.1097/00007632-198809000-00013 [DOI] [PubMed] [Google Scholar]
- 18.Hashimoto K, Akahori O, Kitano K, Nakajima K, Higashihara T, Kumasaka Y. Magnetic resonance imaging of lumbar disc herniation. Comparison with myelography. Spine (Phila Pa 1976) 1990;15:1166-9. 10.1097/00007632-199011010-00015 [DOI] [PubMed] [Google Scholar]
- 19.Johannessen W, Auerbach JD, Wheaton AJ, Kurji A, Borthakur A, Reddy R, Elliott DM. Assessment of human disc degeneration and proteoglycan content using T1rho-weighted magnetic resonance imaging. Spine 2006;31:1253-7. 10.1097/01.brs.0000217708.54880.51 [DOI] [PMC free article] [PubMed] [Google Scholar]
- 20.Gullbrand SE, Ashinsky BG, Martin JT, Pickup S, Smith LJ, Mauck RL, Smith HE. Correlations between quantitative T2 and T1rho MRI, mechanical properties and biochemical composition in a rabbit lumbar intervertebral disc degeneration model. J Orthop Res 2016;34:1382-8. 10.1002/jor.23269 [DOI] [PMC free article] [PubMed] [Google Scholar]
- 21.Borthakur A, Maurer PM, Fenty M, Wang C, Berger R, Yoder J, Balderston RA, Elliott DM. T1rho magnetic resonance imaging and discography pressure as novel biomarkers for disc degeneration and low back pain. Spine (Phila Pa 1976) 2011;36:2190-6. 10.1097/BRS.0b013e31820287bf [DOI] [PMC free article] [PubMed] [Google Scholar]
- 22.Koy T, Zange J, Rittweger J, Pohle-Fröhlich R, Hackenbroch M, Eysel P, Ganse B. Assessment of lumbar intervertebral disc glycosaminoglycan content by gadolinium-enhanced MRI before and after 21-days of head-down-tilt bedrest. PLoS One 2014;9:e112104. 10.1371/journal.pone.0112104 [DOI] [PMC free article] [PubMed] [Google Scholar]
- 23.Du J, Carl M, Bydder M, Takahashi A, Chung CB, Bydder GM. Qualitative and quantitative ultrashort echo time (UTE) imaging of cortical bone. J Magn Reson 2010;207:304-11. 10.1016/j.jmr.2010.09.013 [DOI] [PubMed] [Google Scholar]
- 24.Wright P, Jellus V, McGonagle D, Robson M, Ridgeway J, Hodgson R. Comparison of two ultrashort echo time sequences for the quantification of T1 within phantom and human Achilles tendon at 3 T. Magn Reson Med 2012;68:1279-84. 10.1002/mrm.24130 [DOI] [PubMed] [Google Scholar]
- 25.Chiu EJ, Newitt DC, Segal MR, Hu SS, Lotz JC, Majumdar S. Magnetic resonance imaging measurement of relaxation and water diffusion in the human lumbar intervertebral disc under compression in vitro. Spine (Phila Pa 1976) 2001;26:E437-44. 10.1097/00007632-200110010-00017 [DOI] [PubMed] [Google Scholar]
- 26.Boos N, Wallin A, Schmucker T, Aebi M, Boesch C. Quantitative MR imaging of lumbar intervertebral disc and vertebral bodies: methodology, reproducibility, and preliminary results. Magn Reson Imaging 1994;12:577-87. 10.1016/0730-725X(94)92452-X [DOI] [PubMed] [Google Scholar]
- 27.Tertti M, Paajanen H, Laato M, Aho H, Komu M, Kormano M. Disc degeneration in magnetic resonance imaging. A comparative biochemical, histologic, and radiologic study in cadaver spines. Spine (Phila Pa 1976) 1991;16:629-34. 10.1097/00007632-199106000-00006 [DOI] [PubMed] [Google Scholar]
- 28.Burstein D, Velyvis J, Scott KT, Stock KW, Kim YJ, Jaramillo D, Boutin RD, Gray ML. Protocol issues for delayed Gd(DTPA)(2-)-enhanced MRI (dGEMRIC) for clinical evaluation of articular cartilage. Magn Reson Med 2001;45:36-41. [DOI] [PubMed] [Google Scholar]
- 29.Vaga S, Brayda-Bruno M, Perona F, Fornari M, Raimondi MT, Petruzzi M, Grava G, Costa F, Caiani EG, Lamartina C. Molecular MR imaging for the evaluation of the effect of dynamic stabilization on lumbar intervertebral discs. Eur Spine J 2009;18 Suppl 1:40-8. 10.1007/s00586-009-0996-7 [DOI] [PMC free article] [PubMed] [Google Scholar]
- 30.Watanabe A, Boesch C, Obata T, Anderson SE. Effect of multislice acquisition on T1 and T2 measurements of articular cartilage at 3T. J Magn Reson Imaging 2007;26:109-17. 10.1002/jmri.20962 [DOI] [PubMed] [Google Scholar]
- 31.Maier CF, Tan SG, Hariharan H, Potter HG. T2 quantitation of articular cartilage at 1.5 T. J Magn Reson Imaging 2003;17:358-64. 10.1002/jmri.10263 [DOI] [PubMed] [Google Scholar]
- 32.Marinelli NL, Haughton VM, Muñoz A, Anderson PA. T2 relaxation times of intervertebral disc tissue correlated with water content and proteoglycan content. Spine (Phila Pa 1976) 2009;34:520-4. 10.1097/BRS.0b013e318195dd44 [DOI] [PubMed] [Google Scholar]
- 33.Boos N, Dreier D, Hilfiker E, Schade V, Kreis R, Hora J, Aebi M, Boesch C. Tissue characterization of symptomatic and asymptomatic disc herniations by quantitative magnetic resonance imaging. J Orthop Res 1997;15:141-9. 10.1002/jor.1100150121 [DOI] [PubMed] [Google Scholar]
- 34.Obata S, Akeda K, Imanishi T, Masuda K, Bae W, Morimoto R, Asanuma Y, Kasai Y, Uchida A, Sudo A. Effect of autologous platelet-rich plasma-releasate on intervertebral disc degeneration in the rabbit anular puncture model: a preclinical study. Arthritis Res Ther 2012;14:R241. 10.1186/ar4084 [DOI] [PMC free article] [PubMed] [Google Scholar]
- 35.Duvvuri U, Reddy R, Patel SD, Kaufman JH, Kneeland JB, Leigh JS. T1rho-relaxation in articular cartilage: effects of enzymatic degradation. Magn Reson Med 1997;38:863-7. 10.1002/mrm.1910380602 [DOI] [PubMed] [Google Scholar]
- 36.Wáng YX, Zhang Q, Li X, Chen W, Ahuja A, Yuan J. T1ρ magnetic resonance: basic physics principles and applications in knee and intervertebral disc imaging. Quant Imaging Med Surg 2015;5:858-85. [DOI] [PMC free article] [PubMed] [Google Scholar]
- 37.Zuo J, Joseph GB, Li X, Link TM, Hu SS, Berven SH, Kurhanewitz J, Majumdar S. In vivo intervertebral disc characterization using magnetic resonance spectroscopy and T1rho imaging: association with discography and Oswestry Disability Index and Short Form-36 Health Survey. Spine (Phila Pa 1976) 2012;37:214-21. 10.1097/BRS.0b013e3182294a63 [DOI] [PMC free article] [PubMed] [Google Scholar]
- 38.Blumenkrantz G, Zuo J, Li X, Kornak J, Link TM, Majumdar S. In vivo 3.0-tesla magnetic resonance T1rho and T2 relaxation mapping in subjects with intervertebral disc degeneration and clinical symptoms. Magn Reson Med 2010;63:1193-200. 10.1002/mrm.22362 [DOI] [PMC free article] [PubMed] [Google Scholar]
- 39.Majumdar S, Link TM, Steinbach LS, Hu S, Kurhanewicz J. Diagnostic tools and imaging methods in intervertebral disk degeneration. Orthop Clin North Am 2011;42:501-11, viii. 10.1016/j.ocl.2011.07.007 [DOI] [PubMed] [Google Scholar]
- 40.Du J, Hamilton G, Takahashi A, Bydder M, Chung CB. Ultrashort echo time spectroscopic imaging (UTESI) of cortical bone. Magn Reson Med 2007;58:1001-9. 10.1002/mrm.21397 [DOI] [PubMed] [Google Scholar]
- 41.Chang EY, Du J, Statum S, Pauli C, Chung CB. Quantitative bi-component T2* analysis of histologically normal Achilles tendons. Muscles Ligaments Tendons J 2015;5:58-62. [PMC free article] [PubMed] [Google Scholar]
- 42.Bae WC, Biswas R, Chen K, Chang EY, Chung CB. UTE MRI of the Osteochondral Junction. Curr Radiol Rep 2014;2:35. 10.1007/s40134-013-0035-7 [DOI] [PMC free article] [PubMed] [Google Scholar]
- 43.Moon SM, Yoder JH, Wright AC, Smith LJ, Vresilovic EJ, Elliott DM. Evaluation of intervertebral disc cartilaginous endplate structure using magnetic resonance imaging. Eur Spine J 2013;22:1820-8. 10.1007/s00586-013-2798-1 [DOI] [PMC free article] [PubMed] [Google Scholar]
- 44.Josan S, Pauly JM, Daniel BL, Pauly KB. Double half RF pulses for reduced sensitivity to eddy currents in UTE imaging. Magn Reson Med 2009;61:1083-9. 10.1002/mrm.21879 [DOI] [PubMed] [Google Scholar]
- 45.Robson MD, Gatehouse PD, Bydder M, Bydder GM. Magnetic resonance: an introduction to ultrashort TE (UTE) imaging. J Comput Assist Tomogr 2003;27:825-46. 10.1097/00004728-200311000-00001 [DOI] [PubMed] [Google Scholar]
- 46.Techawiboonwong A, Song HK, Wehrli FW. In vivo MRI of submillisecond T(2) species with two-dimensional and three-dimensional radial sequences and applications to the measurement of cortical bone water. NMR Biomed 2008;21:59-70. 10.1002/nbm.1179 [DOI] [PubMed] [Google Scholar]
- 47.Wu Y, Dai G, Ackerman JL, Hrovat MI, Glimcher MJ, Snyder BD, Nazarian A, Chesler DA. Water- and fat-suppressed proton projection MRI (WASPI) of rat femur bone. Magn Reson Med 2007;57:554-67. 10.1002/mrm.21174 [DOI] [PubMed] [Google Scholar]
- 48.Rahmer J, Börnert P, Groen J, Bos C. Three-dimensional radial ultrashort echo-time imaging with T2 adapted sampling. Magn Reson Med 2006;55:1075-82. 10.1002/mrm.20868 [DOI] [PubMed] [Google Scholar]
- 49.Weiger M, Pruessmann KP, Hennel F. MRI with zero echo time: hard versus sweep pulse excitation. Magn Reson Med 2011;66:379-89. 10.1002/mrm.22799 [DOI] [PubMed] [Google Scholar]
- 50.Qian Y, Boada FE. Acquisition-weighted stack of spirals for fast high-resolution three-dimensional ultra-short echo time MR imaging. Magn Reson Med 2008;60:135-45. 10.1002/mrm.21620 [DOI] [PMC free article] [PubMed] [Google Scholar]
- 51.Idiyatullin D, Corum C, Park JY, et al. Fast and quiet MRI using a swept radiofrequency. J Magn Reson 2006;181:342-9. 10.1016/j.jmr.2006.05.014 [DOI] [PubMed] [Google Scholar]
- 52.Robson MD, Gatehouse PD, So PW, Bell JD, Bydder GM. Contrast enhancement of short T2 tissues using ultrashort TE (UTE) pulse sequences. Clin Radiol 2004;59:720-6. 10.1016/j.crad.2003.09.025 [DOI] [PubMed] [Google Scholar]
- 53.Rahmer J, Blume U, Bornert P. Selective 3D ultrashort TE imaging: comparison of "dual-echo" acquisition and magnetization preparation for improving short-T 2 contrast. Magma 2007;20:83-92. 10.1007/s10334-007-0070-6 [DOI] [PubMed] [Google Scholar]
- 54.Carl M, Sanal HT, Diaz E, Du J, Girard O, Statum S, Znamirowski R, Chung CB. Optimizing MR signal contrast of the temporomandibular joint disk. J Magn Reson Imaging 2011;34:1458-64. 10.1002/jmri.22810 [DOI] [PubMed] [Google Scholar]
- 55.Larson PE, Conolly SM, Pauly JM, Nishimura DG. Using adiabatic inversion pulses for long-T2 suppression in ultrashort echo time (UTE) imaging. Magn Reson Med 2007;58:952-61. 10.1002/mrm.21341 [DOI] [PMC free article] [PubMed] [Google Scholar]
- 56.Du J, Bydder M, Takahashi AM, Carl M, Chung CB, Bydder GM. Short T2 contrast with three-dimensional ultrashort echo time imaging. Magn Reson Imaging 2011;29:470-82. 10.1016/j.mri.2010.11.003 [DOI] [PMC free article] [PubMed] [Google Scholar]
- 57.Du J, Takahashi AM, Bae WC, Chung CB, Bydder GM. Dual inversion recovery, ultrashort echo time (DIR UTE) imaging: creating high contrast for short-T(2) species. Magn Reson Med 2010;63:447-55. 10.1002/mrm.22257 [DOI] [PMC free article] [PubMed] [Google Scholar]
- 58.Sussman MS, Pauly JM, Wright GA. Design of practical T2-selective RF excitation (TELEX) pulses. Magn Reson Med 1998;40:890-9. 10.1002/mrm.1910400615 [DOI] [PubMed] [Google Scholar]
- 59.Tyler DJ, Robson MD, Henkelman RM, Young IR, Bydder GM. Magnetic resonance imaging with ultrashort TE (UTE) PULSE sequences: technical considerations. J Magn Reson Imaging 2007;25:279-89. 10.1002/jmri.20851 [DOI] [PubMed] [Google Scholar]
- 60.Miller AJ, Joseph PM. The use of power images to perform quantitative analysis on low SNR MR images. Magn Reson Imaging 1993;11:1051-6. 10.1016/0730-725X(93)90225-3 [DOI] [PubMed] [Google Scholar]
- 61.Raya JG, Dietrich O, Horng A, Weber J, Reiser MF, Glaser C. T2 measurement in articular cartilage: impact of the fitting method on accuracy and precision at low SNR. Magn Reson Med 2010;63:181-93. [DOI] [PubMed] [Google Scholar]
- 62.Peled S, Cory DG, Raymond SA, Kirschner DA, Jolesz FA. Water diffusion, T(2), and compartmentation in frog sciatic nerve. Magn Reson Med 1999;42:911-8. [DOI] [PMC free article] [PubMed] [Google Scholar]
- 63.Du J, Diaz E, Carl M, Bae W, Chung CB, Bydder GM. Ultrashort echo time imaging with bicomponent analysis. Magn Reson Med 2012;67:645-9. 10.1002/mrm.23047 [DOI] [PubMed] [Google Scholar]
- 64.Qian Y, Williams AA, Chu CR, Boada FE. Multicomponent T2* mapping of knee cartilage: technical feasibility ex vivo. Magn Reson Med 2010;64:1426-31. 10.1002/mrm.22450 [DOI] [PMC free article] [PubMed] [Google Scholar]
- 65.Liu F, Chaudhary R, Hurley SA, Munoz Del Rio A, Alexander AL, Samsonov A, Block WF, Kijowski R. Rapid multicomponent T2 analysis of the articular cartilage of the human knee joint at 3.0T. J Magn Reson Imaging 2014;39:1191-7. 10.1002/jmri.24290 [DOI] [PubMed] [Google Scholar]
- 66.Glass HI, De Garreta AC. The quantitative limitations of exponential curve fitting. Phys Med Biol 1971;16:119-30. 10.1088/0031-9155/16/1/312 [DOI] [PubMed] [Google Scholar]
- 67.Graham SJ, Stanchev PL, Bronskill MJ. Criteria for analysis of multicomponent tissue T2 relaxation data. Magn Reson Med 1996;35:370-8. 10.1002/mrm.1910350315 [DOI] [PubMed] [Google Scholar]
- 68.Bjarnason TA, McCreary CR, Dunn JF, Mitchell JR. Quantitative T2 analysis: the effects of noise, regularization, and multivoxel approaches. Magn Reson Med 2010;63:212-7. [DOI] [PubMed] [Google Scholar]
- 69.Henkelman RM. Measurement of signal intensities in the presence of noise in MR images. Med Phys 1985;12:232-3. 10.1118/1.595711 [DOI] [PubMed] [Google Scholar]
- 70.Kaufman L, Kramer DM, Crooks LE, Ortendahl DA. Measuring signal-to-noise ratios in MR imaging. Radiology 1989;173:265-7. 10.1148/radiology.173.1.2781018 [DOI] [PubMed] [Google Scholar]
- 71.Hwang D, Kim DH, Du YP. In vivo multi-slice mapping of myelin water content using T2* decay. Neuroimage 2010;52:198-204. 10.1016/j.neuroimage.2010.04.023 [DOI] [PubMed] [Google Scholar]
- 72.Feng Y, He T, Gatehouse PD, Li X, Harith Alam M, Pennell DJ, Chen W, Firmin DN. Improved MRI R2 * relaxometry of iron-loaded liver with noise correction. Magn Reson Med 2013;70:1765-74. 10.1002/mrm.24607 [DOI] [PubMed] [Google Scholar]
- 73.Milford D, Rosbach N, Bendszus M, Heiland S. Mono-Exponential Fitting in T2-Relaxometry: Relevance of Offset and First Echo. PLoS One 2015;10:e0145255. 10.1371/journal.pone.0145255 [DOI] [PMC free article] [PubMed] [Google Scholar]
- 74.Dietrich O, Raya JG, Reeder SB, Reiser MF, Schoenberg SO. Measurement of signal-to-noise ratios in MR images: influence of multichannel coils, parallel imaging, and reconstruction filters. J Magn Reson Imaging 2007;26:375-85. 10.1002/jmri.20969 [DOI] [PubMed] [Google Scholar]
- 75.Whittall KP, Mackay AL. Quantitative Interpretation of Nmr Relaxation Data. Journal of Magnetic Resonance 1989;84:134-52. [Google Scholar]
- 76.Lawson CL, Hanson RJ. Solving least sqaures problems. Englewood Cliffs, NJ: Prentice-Hall; 1974. [Google Scholar]
- 77.Istratov AA, Vyvenko OF. Exponential analysis in physical phenomena. Rev Sci Instrum 1999;70:1233-57. 10.1063/1.1149581 [DOI] [Google Scholar]
- 78.Hwang D, Du YP. Improved myelin water quantification using spatially regularized non-negative least squares algorithm. J Magn Reson Imaging 2009;30:203-8. 10.1002/jmri.21783 [DOI] [PubMed] [Google Scholar]
- 79.Kumar D, Nguyen TD, Gauthier SA, Raj A. Bayesian algorithm using spatial priors for multiexponential T2 relaxometry from multiecho spin echo MRI. Magn Reson Med 2012;68:1536-43. 10.1002/mrm.24170 [DOI] [PubMed] [Google Scholar]
- 80.Guo J, Ji Q, Reddick WE. Multi-slice myelin water imaging for practical clinical applications at 3.0 T. Magn Reson Med 2013;70:813-22. 10.1002/mrm.24527 [DOI] [PMC free article] [PubMed] [Google Scholar]
- 81.Hwang D, Chung H, Nam Y, Du YP, Jang U. Robust mapping of the myelin water fraction in the presence of noise: synergic combination of anisotropic diffusion filter and spatially regularized nonnegative least squares algorithm. J Magn Reson Imaging 2011;34:189-95. 10.1002/jmri.22586 [DOI] [PubMed] [Google Scholar]
- 82.Wáng YX. Towards consistency for magnetic resonance (MR) relaxometry of lumbar intervertebral discs. Quant Imaging Med Surg 2016;6:474-7. 10.21037/qims.2016.08.04 [DOI] [PMC free article] [PubMed] [Google Scholar]
- 83.Wáng YX. On Magnetic Resonance Imaging of Intervertebral Disc Aging. Sports Med 2016. [Epub ahead of print]. 10.1007/s40279-016-0598-6 [DOI] [PubMed] [Google Scholar]
- 84.Ostu N. A threshold selection method from gray-level histograms. IEE Trans Sys Man Cyber 1979;9:62-6. 10.1109/TSMC.1979.4310076 [DOI] [Google Scholar]
- 85.Weiss KL, Storrs JM, Banto RB. Automated spine survey iterative scan technique. Radiology 2006;239:255-62. 10.1148/radiol.2383050456 [DOI] [PubMed] [Google Scholar]
- 86.Soille P. Morphological image analysis: Principles and applications. New York: Springer-Verlag Berlin Heidelberg; 2004. [Google Scholar]
- 87.Boykov Y, Kolmogorov V. An experimental comparison of min-cut/max-flow algorithms for energy minimization in vision. IEEE Trans Pattern Anal Mach Intell 2004;26:1124-37. 10.1109/TPAMI.2004.60 [DOI] [PubMed] [Google Scholar]
- 88.Camilus KS, Govindan VK. A review on graph based segmentation. IJIGSP 2012;4:1-13. 10.5815/ijigsp.2012.05.01 [DOI] [Google Scholar]
- 89.Bae WC, Bydder GM, Masuda K. T2 Values of Human Lumbar Discs: Template-Based Segmentation and Variations with Age, Sex and Level. Trans Orthop Res Soc 2013;38:231. [Google Scholar]
- 90.Michopoulou SK, Costaridou L, Panagiotopoulos E, Speller R, Panayiotakis G, Todd-Pokropek A. Atlas-based segmentation of degenerated lumbar intervertebral discs from MR images of the spine. IEEE Trans Biomed Eng 2009;56:2225-31. 10.1109/TBME.2009.2019765 [DOI] [PubMed] [Google Scholar]
- 91.Canny J. A computational approach to edge detection. IEEE Trans Pattern Anal Mach Intell 1986;8:679-98. 10.1109/TPAMI.1986.4767851 [DOI] [PubMed] [Google Scholar]
- 92.Egger J, Kapur T, Dukatz T, Kolodziej M, Zukić D, Freisleben B, Nimsky C. Square-cut: a segmentation algorithm on the basis of a rectangle shape. PLoS One 2012;7:e31064. 10.1371/journal.pone.0031064 [DOI] [PMC free article] [PubMed] [Google Scholar]
- 93.Schwarzenberg R, Freisleben B, Nimsky C, Egger J. Cube-cut: vertebral body segmentation in MRI-data through cubic-shaped divergences. PLoS One 2014;9:e93389. 10.1371/journal.pone.0093389 [DOI] [PMC free article] [PubMed] [Google Scholar]
- 94.Zheng Q, Lu Z, Feng Q, Ma J, Yang W, Chen C, Chen W. Adaptive segmentation of vertebral bodies from sagittal MR images based on local spatial information and Gaussian weighted chi-square distance. J Digit Imaging 2013;26:578-93. 10.1007/s10278-012-9552-9 [DOI] [PMC free article] [PubMed] [Google Scholar]
- 95.Boykov Y, Veksler O, Zabih R. Fast approximate energy minimisation via graph cuts. IEEE Trans Pattern Anal Mach Intell 2001;29:1222-39. 10.1109/34.969114 [DOI] [Google Scholar]
- 96.Kroon D-J, Slump CH. MRI modalitiy transformation in demon registration. Proceedings of the Sixth IEEE international conference on Symposium on Biomedical Imaging: From Nano to Macro; Boston: IEEE Press; 2009:963-6. [Google Scholar]


