

Abstract
Atherosclerotic lesion localization to regions of disturbed flow within certain arterial geometries, in humans and experimental animals, suggests an important role for local hemodynamic forces in atherogenesis. To explore how endothelial cells (EC) acquire functional/dysfunctional phenotypes in response to vascular region-specific flow patterns, we have used an in vitro dynamic flow system to accurately reproduce arterial shear stress waveforms on cultured human EC and have examined the effects on EC gene expression by using a high-throughput transcriptional profiling approach. The flow patterns in the carotid artery bifurcations of several normal human subjects were characterized by using 3D flow analysis based on actual vascular geometries and blood flow profiles. Two prototypic arterial waveforms, “athero-prone” and “athero-protective,” were defined as representative of the wall shear stresses in two distinct regions of the carotid artery (carotid sinus and distal internal carotid artery) that are typically “susceptible” or “resistant,” respectively, to atherosclerotic lesion development. These two waveforms were applied to cultured EC, and cDNA microarrays were used to analyze the differential patterns of EC gene expression. In addition, the differential effects of athero-prone vs. athero-protective waveforms were further characterized on several parameters of EC structure and function, including actin cytoskeletal organization, expression and localization of junctional proteins, activation of the NF-κB transcriptional pathway, and expression of proinflammatory cytokines and adhesion molecules. These global gene expression patterns and functional data reveal a distinct phenotypic modulation in response to the wall shear stresses present in atherosclerosis-susceptible vs. atherosclerosis-resistant human arterial geometries.
Atherosclerosis is a potentially life-threatening disease of large arteries that is strongly associated with systemic risk factors such as hypercholesterolemia, hypertension, smoking, and diabetes (1). However, atherosclerosis develops as a focal disease that often occurs at specific anatomical locations in the arteries of human subjects and experimental animals (2). Postmortem anatomical studies (3) and noninvasive in vivo imaging (4) in human subjects have shown that the early lesions of atherosclerosis are located preferentially in the vicinity of branch points, the outer wall of bifurcations, and the inner wall of curvatures, arterial geometries that are characterized by disturbed blood flow patterns. This striking correlation between regional hemodynamics and atherosclerosis (5, 6) has motivated various studies that have attempted to define a mechanistic role for hemodynamic forces in the pathogenesis of atherosclerosis (for reviews see refs. 7-10).
Recently, several in vitro studies using genomic approaches have identified pathophysiologically relevant endothelial genes that are regulated by various hemodynamic forces, including laminar shear stress, turbulent shear stress, and disturbed flow (11-15). These studies provide strong evidence that endothelial cells (EC) not only have the ability to “sense” hemodynamic forces, but also can discriminate among different types of biomechanical stimuli. The implication of these observations is that EC in the human cardiovascular system may exhibit multiple phenotypes in response to the complex flow patterns present in various vascular geometries. To more realistically assess the endothelial phenotypic modulation induced by biomechanical forces that are actually present in the atherosclerosis-susceptible and atherosclerosis-resistant regions of human arteries, we undertook a direct approach to analyze the flow patterns present in the human carotid artery bifurcation, arterial geometries that consistently demonstrate a strong correlation between lesion formation and disturbed hemodynamics (16). First, we reconstructed the flow patterns in the human carotid bifurcation, using 3D computational fluid dynamic analyses based on the actual geometries and flow profiles measured in normal human subjects via MRI and ultrasound technology. We then defined two prototypic arterial waveforms, “athero-prone” and “athero-protective,” which were representative of the wall shear stress profiles in the corresponding atherosclerosis-susceptible and atherosclerosis-resistant regions of the human carotid artery. These arterial waveforms were then replicated by using an in vitro dynamic flow system recently developed in our laboratory (17) and applied to cultured human EC. Using transcriptional profiling, we identified the evoked patterns of gene expression and further characterized functional phenotypes by using additional molecular and cell biological approaches. This dual approach allowed us to identify sets of genes and cellular functional responses that are preferentially displayed under two well defined types of fluid mechanical stimulation that may have direct pathophysiologic relevance to the atherosclerotic disease process in vivo.
Materials and Methods
Analysis of Flow and Shear Stress Patterns in the Carotid Artery of Normal Human Subjects. We analyzed the flow patterns in the carotid artery bifurcations in normal human subjects by using a 3D fluid dynamic analysis based on actual vascular geometries and measured flow profiles. Three healthy volunteers (ages 24, 27, and 30) were recruited for this study according to Institutional Review Board-approved protocols (protocol 1999-P-010921, Massachusetts General Hospital, Boston). First, 20 slices of 2D magnetic resonance images (256 × 256 pixels with in-plane resolution of 0.39 mm) spanning the region of carotid bifurcation (2 cm below to 2 cm above carotid bifurcation) were acquired. The 3D geometry, reconstructed from slices of 2D MRI data, along with ultrasound measured flow profiles, were then imported into finite element analysis software (adina, version 7.4, Automatic Dynamic Incremental Nonlinear Analysis, Watertown, MA). Finite element meshes for the solid (vascular wall) and fluid (blood) domain were generated with an average size of 0.4 mm. To implement the simulation, we adopted two well established hemodynamic parameters: the arterial wall was modeled as nonlinear, isotropic hyper-elastic material (18), and the blood was treated as incompressible Newtonian fluid (19). We then performed fully coupled, 3D nonlinear fluid-structure interaction analysis to simulate the blood flow, vessel wall mechanics, and their interactions in two complete cardiac cycles. Details of the MRI imaging process, geometry reconstruction, and the finite element implementation have been published elsewhere (20, 21).
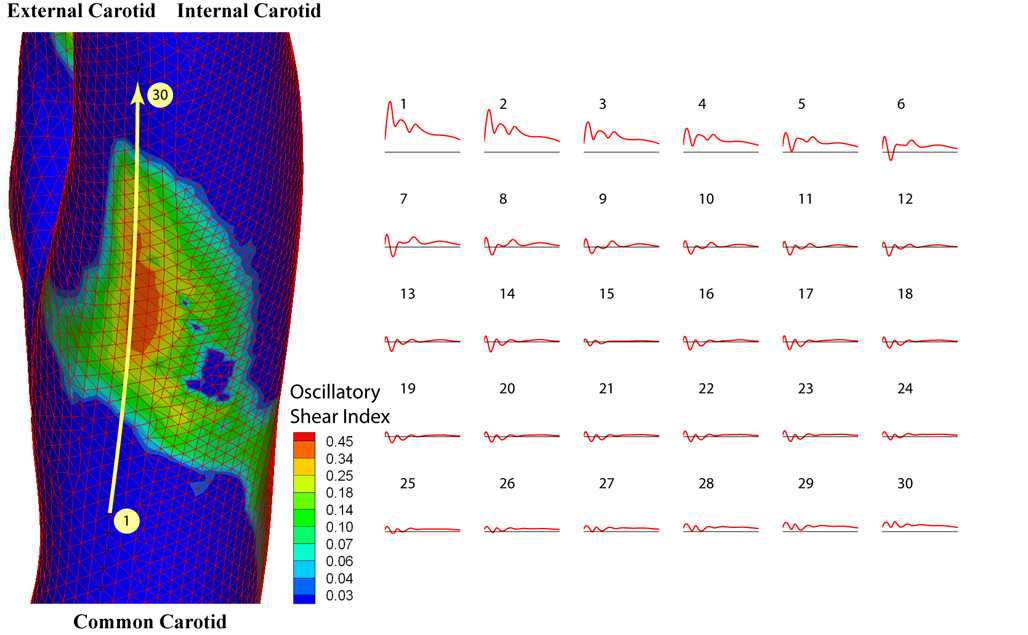
To select the shear stress waveforms that are representative of the hemodynamics at an early stage of atherosclerotic lesion development, the left carotid artery from one subject (27-year-old male) without any sign of existing atherosclerotic plaques was chosen (Fig. 1). The wall shear stress and oscillatory shear index (OSI, defined in ref. 5) were then computed from the simulation results. Individual points on the vessel wall were selected, and the shear stress vector was projected onto its mean flow direction (defined by the temporal mean of the shear stress vector at this location) to obtain the time-dependent shear stress value. We then chose a shear stress profile at the distal internal carotid artery as a representative athero-protective waveform. For comparison, a point with the highest OSI (OSI = 0.45) was chosen from the region of the carotid sinus as the representative athero-prone waveform.
Fig. 1.

Hemodynamics in human carotid bifurcation manifests distinct site specificity. The left carotid anatomy of a normal human subject (27-year-old male) was reconstructed from noninvasive MRI measurements. The color-coded map shown in this carotid model displays the time-averaged shear stress magnitude at different points along the vascular wall. Regions in the distal internal carotid artery and carotid sinus were selected, and the time-dependent shear stress values along the mean flow direction from multiple individual points within each region were plotted for one cardiac cycle. For the carotid sinus, all of the finite element surface grid points within a 4-mm diameter circle in the sinus region (total 199 grid points) were chosen, and the time-dependent shear stresses along the mean flow direction from individual points were plotted (Lower Right). Each waveform depicted thus represents the time-dependent wall shear stress profile at a given point in each region of interest.
Applying Shear Stress Waveforms to Cultured Human EC. The athero-protective and athero-prone waveforms were replicated by using a dynamic flow system developed in our laboratory (17). This device is a modified cone and plate device (22, 23) with a computer-controlled user interface. The design parameters (e.g., cone angle, plate diameter, and medium viscosity) had been evaluated to ensure that the flow is laminar, and that the shear stress is directly proportional to the angular velocity of the cone. Therefore, precise control of the cone rotation allows the device to simulate various shear stress waveforms (17). For each set of experiments, two identical flow devices were used simultaneously. One of them was programmed to simulate the athero-protective waveform, whereas the other was used for the athero-prone waveform.
Human umbilical vein EC (HUVEC) were then cultured under the athero-prone or athero-protective waveform stimulation, or under static (no flow) conditions for 24 h. This time point was selected for comparison to allow various transient changes in transcription that primarily reflect the step-like transition from the static condition to a fluid dynamic culture condition to subside, and a more steady-state approximation of flow-dependent phenotype to emerge. RNA was isolated thereafter, and the transcriptional profiles were analyzed by using cDNA microarrays. The detailed cell culture protocol, cDNA microarray hybridization, and statistical methods are provided in full in Supporting Materials and Methods and Table 1, which are published as supporting information on the PNAS web site.
Results and Discussion
Hemodynamics in Human Carotid Bifurcation Display Distinct Site Specificities. Finite element simulation demonstrated distinct flow patterns within various regions of the human carotid bifurcation (Fig. 1). The shear stresses at the inlet of the common carotid and the outlets of internal and external carotid all exhibited pulsatile patterns that closely resemble the velocity profile measured by ultrasound. In contrast, in the region of the carotid sinus, shear stress profiles demonstrated large heterogeneity. Mean flow direction manifested large variations in the carotid sinus (data not shown). To depict the types of shear stress waveforms imparted to EC in the sinus region, we analyzed the time-dependent wall shear stresses from all of the surface grid points within a 4-mm-diameter circle in the carotid sinus and plotted them in Fig. 1. A common feature among all subjects was the occurrence of high OSI (up to 0.45) within the areas of low time-averaged wall shear stress, which were located near the carotid sinus (Fig. 6, which is published as supporting information on the PNAS web site). To demonstrate the transformation of shear stress waveforms across the sinus region, shear stresses from selected points that extend from common to internal carotid artery were plotted in Fig. 6. Time-dependent wall shear stress is highly oscillatory within the entire flow separation region, but especially so near the flow separation boundary, attributable to the rapidly moving flow separation zone associated with the dynamic cardiac cycle (≈1-Hz frequency). Despite the complexity and heterogeneity of the waveforms in this region, all subjects exhibited similar oscillatory frequency and low time-averaged amplitude.
We selected prototypical shear stress waveforms from two anatomical locations: the distal internal carotid and the carotid sinus. These two sites are very close to each other but have distinct hemodynamics and markedly different propensity to develop atherosclerotic lesions. Therefore, we felt that this represents an especially appropriate model to study biomechanically modulated EC function/dysfunction. The shear stress waveforms at the distal internal carotid artery are very similar to each other, so a midranged shear stress waveform was selected as the prototypic athero-protective shear stress waveform (Fig. 2). To choose the prototypic athero-prone shear stress waveform, we selected the point with the highest OSI (0.45) based on the premise that a high OSI is correlated with a high probability of atherosclerosis development (24). It should be noted that the selected prototypic athero-prone shear stress waveform is significantly different from the sinusoid waveform (oscillates between -5 and +5 dynes/cm2 at 1 Hz) typically chosen in several previous studies (25, 26) to mimic the flow in an atherosclerosis-susceptible region. Because the shear stress waveform magnitude, frequency, and shape could potentially modulate endothelial gene expression and phenotypes, an accurate representation of in vivo biomechanical stimuli is more likely to recapitulate the in vivo phenotypes in an in vitro setting. By using 3D computational fluid mechanics with realistic vascular geometries and flow profiles, we believe the present model is a robust representation of the hemodynamics observed in a normal healthy carotid bifurcation. This approach, combined with our previously published in vitro dynamic flow model (17), allows us to apply actual human hemodynamic parameters from atherosclerosis-susceptible and atherosclerosis-resistant arterial regions to cultured human EC.
Fig. 2.

Selection of prototypic athero-prone (Right) and athero-protective (Left) waveforms. Two waveforms were chosen as representative of the hemodynamics corresponding to an atherosclerosis-susceptible and an atherosclerosis-resistant region of the human carotid artery. The waveform with the highest OSI (0.45; corresponding to point 14 in Fig. 6) was chosen from the carotid sinus to represent the wall shear stress fluctuations in this atherosclerosis-susceptible region. Another shear stress waveform from the distal internal carotid artery was chosen as representative of the wall shear stress profile in an atherosclerosis-resistant region. These two waveforms (designated athero-prone and athero-protective, respectively) were then applied to cultured human EC by using the dynamic flow system as described in Materials and Methods.
Athero-Prone and Athero-Protective Waveforms Differentially Regulate Endothelial Gene Expression. Statistical analysis based on three replicate sets of cDNA array experiments using three different biological samples revealed that 72 genes were up-regulated in response to the athero-prone biomechanical stimulus relative to athero-protective, whereas 87 genes were increased after the athero-protective stimulus relative to athero-prone (Table 2, which is published as supporting information on the PNAS web site). A complete list of all of the significantly regulated genes (P < 0.05) is provided in Tables 3 and 4, which are published as supporting information on the PNAS web site.
Further analysis of these expression profiling results indicate that sets of genes involved in signal transduction, transcriptional regulation, inflammation, angiogenesis, coagulation, and lipid metabolism were differentially regulated by the two waveforms. Listed in Table 3 are several proinflammatory genes induced by athero-prone waveform stimulation, including IL-8, pentaxin-related gene (PTX3), chemokine receptor 4 (CXCR4), and tumor necrosis factor receptor superfamily, member 21 (TNFRSF21). Several angiogenic factors were up-regulated by athero-prone waveform stimulation, including placental growth factor (PGF), connective tissue growth factor (CTGF), and cysteine-rich 61 (CYR61). Both CYR61 and CTGF are highly expressed in atherosclerotic lesions (27, 28) and have been shown to play roles in the development and progression of atherosclerosis. A few other genes implicated in atherogenesis are also up-regulated by the athero-prone waveform, including thrombospondin 1 (THBS1) (29) and matrix metalloproteinase 1 (MMP1) (30). In addition, this waveform increases the expression of pleckstrin homology-like domain family A member 1 (PHLDA1 or TDAG51), which was previously shown to be up-regulated by homocysteine in cultured EC, and to contribute to the development of atherosclerosis in animal models of hyperhomocysteinemia (31).
In contrast, exposure to the athero-protective waveform increased the expression of sets of genes distinct from the athero-prone waveform stimulation. Table 4 displays the genes that are up-regulated by athero-protective flow. The highest up-regulated gene at the transcriptional level is C-type natriuretic peptide (CNP). CNP is synthesized by EC and has been shown to prevent development of atherosclerosis (32). The transcription factor KLF2 was also differentially regulated by the athero-protective waveform. We and others (33, 34) have identified this factor to be regulated in EC exposed to laminar shear stress, and Dekker et al. (33) demonstrated that KLF2 is expressed in EC in atherosclerosis-resistant regions of human vessels, but not in EC in atherosclerosis-susceptible regions. Moreover, we have recently shown that overexpression of KLF2 in EC leads to the up-regulation of endothelial NO synthase (eNOS) and the suppression of IL-1β-mediated expression of E-selectin and vascular cell adhesion molecule 1 (VCAM-1) (34). Consistent with previous findings from EC exposed to steady laminar shear stress (13), several genes that are essential for vascular development are also enhanced by exposure to athero-protective waveform stimulation, e.g., endothelial TEK tyrosine kinase (Tie2) and kinase insert domain receptor (KDR/FLK1). In addition, flow in atherosclerosis-resistant regions modulates the NO pathway, including eNOS (verified by RT-PCR, data not shown), guanylate cyclase 1 α 3 (GUCY1A3), and argininosuccinate synthetase.
The selective up-regulation of atherosclerosis-susceptible and atherosclerosis-resistant genetic profiles by athero-prone and athero-protective waveforms provides compelling in vitro evidence that cultured EC may acquire some phenotypic features that resemble the in vivo regional difference. The cells cultured under these two conditions, therefore, constitute a well defined in vitro model to further investigate functions of other newly identified genes and their potential roles in the early events of atherogenesis. It would be interesting to compare the patterns of gene expression obtained in these studies with the ones evoked in HUVEC exposed to these particular types of biomechanical stimuli for shorter or longer periods of time. Moreover, it is important to compare this type of in vitro model to in vivo gene expression profiling studies (35) to elucidate the complexity and interplay of the multiple components of blood vessels.
The Two Shear Stress Waveforms Demonstrate Differences in Gene Regulation Patterns. Analysis of transcriptional profiles showed that athero-prone and athero-protective waveforms induce distinct patterns of gene expression compared with static (no flow) conditions. To demonstrate these unique patterns, we grouped some regulated genes into two categories according to the direction of their regulation: “synergistic” (genes that are regulated by both athero-prone and athero-protective conditions in a similar pattern) and “antagonistic” groups (genes that are regulated by athero-prone and athero-protective conditions in opposite directions) (Fig. 7, which is published as supporting information on the PNAS web site). Some genes were found to be up-regulated or down-regulated by athero-prone and athero-protective waveforms in a similar fashion. For example, several flow-dependent genes that were identified previously (Cox-2, Smad-6, and Smad-7) (36, 37) were also up-regulated by the athero-prone waveform. The fact that these genes show similar patterns of expression under two very different shear stress waveforms indicates that expression of these genes may be flow-sensitive independent of waveform characteristics. It may also reflect EC phenotypic adaptation from static culture into a more fluid-dynamic physiological condition. In contrast, some genes were differentially regulated by the two flow conditions. For example, the athero-prone waveform up-regulated IL-8, whereas athero-protective waveform down-regulated IL-8 expression. Similarly, athero-prone flow down-regulated connexin 37 (Cx37), whereas athero-protective flow up-regulated Cx37 expression. Genes that are regulated in the opposite direction by the two waveforms are particularly interesting because they may give a more accurate picture of gene expression differences between EC in atherosclerosis-susceptible and atherosclerosis-resistant vascular areas.
Endothelial Cytoskeleton and Junctional Proteins Are Regulated Differentially by Shear Stress Waveforms. EC displayed dramatic differences in cell shape and alignment under athero-prone and athero-protective waveforms. The two waveforms also induced distinct patterns of F-actin organization (Fig. 3). In addition to cell morphological and cytoskeletal differences, several gap junction proteins were differentially regulated by athero-prone and athero-protective waveforms. The striking finding in our experiments is that Cx43 expression was up-regulated by athero-prone waveform, whereas elevated Cx37 and Cx40 levels were associated with the athero-protective waveform waveforms (Tables 4-6, which are published as supporting information on the PNAS web site). Expression and subcellular localization of these proteins were verified by immunostaining. Fig. 3 shows that Cx37 exhibited a uniform punctuate staining localized to cell borders under athero-protective waveform, whereas there was not detectable Cx37 in cells under the athero-prone waveform. In contrast, Cx43 staining was abundantly expressed in the perinuclear region but not present uniformly at the cell borders under the latter condition.
Fig. 3.

Actin cytoskeletal organization and subcellular localization of Cx37 and Cx43 are regulated differentially by shear stress waveforms. EC monolayers were immunofluorescently stained for F-actin, Cx37, and Cx43, after 24 h of exposure to static (no flow) and athero-prone and athero-protective waveforms. (Top) Nuclei were stained with SYTOX (Molecular Probes) (red) (×40).
The observed Cx expression patterns induced by athero-prone or athero-protective waveforms resemble several in vivo findings. Kwak et al. (38) demonstrated an altered pattern of vascular Cx expression in endothelium covering the atherosclerotic plaques. In human carotid arteries, Cx37 and Cx40 were detected in the endothelium of nondiseased arteries. In advanced atheromas, Cx37 and Cx40 could no longer be detected in the endothelium covering the plaques. Cx43, on the other hand, was detected in the endothelium covering the shoulder of the plaques. Additional studies should help to elucidate the potential role of gap junctional intercellular communication during atherogenesis. Boerma et al. (39) identified a genetic polymorphism in Cx37 as a prognostic marker for atherosclerotic plaque development. Furthermore, reduced Cx43 expression inhibits atherosclerotic lesion formation in LDLR-/- mice (40).
Several previous studies have shown similar gap junction expression patterns modulated by various mechanical and biological stimuli, e.g., shear stress gradients (41), homocysteine (42), hyperlipidemia (43), and tumor necrosis factor α (44). The striking similarities in gap junction expression patterns among various stimuli suggest that biomechanical forces can function as both positive and negative stimuli, and the resultant Cx pattern alterations may contribute to lesion formation and/or progression.
Athero-Prone and Athero-Protective Waveforms Alter Endothelial Proinflammatory State. The results of endothelial transcriptional profiling revealed that several chemokines/chemokine receptors, including IL-8, CXCR4, and PTX3, were up-regulated by the athero-prone waveform stimulation. Increased expression of these molecules suggests that EC have acquired a proinflammatory phenotype that may contribute to the early development of atherosclerosis. To verify these findings, we measured the IL-8 mRNA level and protein secretion by real-time TaqMan PCR and ELISA. As shown in Fig. 4a, IL-8 mRNA expression was significantly up-regulated after 24 h by the athero-prone waveform and was down-regulated by the athero-protective waveform, compared with static conditions. IL-8 production as a function of time measured by ELISA is shown in Fig. 4b and demonstrates an interesting pattern. In the first 8 h, both athero-prone and athero-protective waveforms increase IL-8 production dramatically. Under the athero-protective condition IL-8 production quickly dropped and was below the static level by the end of the 24 h. In contrast, IL-8 production under the athero-prone conditions is much higher than static throughout the 24 h.
Fig. 4.

Athero-prone waveform stimulation results in enhanced IL-8 production and NF-κB nuclear translocation. (a) IL-8 mRNA expression was measured by TaqMan RT-PCR (n = 3) at 24 h. All data are normalized to the static (no flow) condition. (b) Endothelial IL-8 secretion was measured by ELISA (n = 3). EC were cultured under static (no flow) or athero-prone and athero-protective waveform for 24 h. The supernant was collected from the outflow port of the dynamic flow device every 2 h, and IL-8 protein was measured by ELISA (see Materials and Methods). (c) Immunofluorescent staining of NF-κB (p65) (×40). EC were stained with antibodies to p65 after 24 h exposure to static (no flow) and athero-prone and athero-protective waveform. (d) Western blot analysis of NF-κB (p65) protein levels. HUVEC were cultured under static, athero-prone, or athero-protective flow conditions for 24 h, then treated with IL-1β (1 units/ml) for 1 h under static condition. Cytoplasmic and nuclear protein fractions were isolated and p65 protein was analyzed by Western blotting. The blot was then stripped and reprobed for α-tubulin and histone H3. Lanes 1, static (no flow); lanes 2, athero-prone; lanes 3, athero-protective condition.
Because NF-κB plays a central role in the regulation of IL-8 and several other inflammatory molecules, we examined the status of NF-κB by immunostaining and Western blotting in response to biomechanical preconditioning. Fig. 4c demonstrates that NF-κB (p65) undergoes nuclear translocation in cells exposed for 24 h to the athero-prone but not the athero-protective waveform stimulation. In Fig. 4d, Western blot analysis further documented that, in the absence of cytokine stimulation, nuclear p65 is increased under athero-prone flow and decreased under athero-protective flow compared with the static condition. However, when EC were treated with IL-1β after 24 h of flow exposure, there was no significant difference in the amount of nuclear p65 between EC preconditioned with athero-protective and athero-prone waveforms. Interestingly, when Hajra et al. (45) examined the status of NF-κB activation in “high probability regions” of the mouse aorta, in vivo, using en face immunohistochemistry, they observed: (i) enhanced levels of cytoplasmic expression of p65, IκB-α, and IκB-β in control (C57BL/6) mice; and (ii) increased nuclear translocation of p65 in LDLR-/- mice (an atherosclerosis-susceptible strain) under basal conditions, or after systemic challenge with lipopolysaccharide in control mice. They interpreted these observations as indicating that the NF-κB system was “primed” for activation in high probability regions. Comparison of these results with those observed in our in vitro model system suggests that preconditioning with different biomechanical stimuli can result in differential activation of the NF-κB system in EC, which may be further modulated by other factors.
To further assess the EC gene expression in the context of inflammatory mediators, we measured the cytokine-induced E-selectin and VCAM-1 expression in cells preconditioned under these flow conditions for 24 h. Fig. 5a illustrates that a very small number of EC expressed low levels of VCAM-1 under either of these conditions in the absence of IL-1β stimulation (static: 4.96%, athero-prone: 5.14%, athero-protective: 8.50%, threshold set at 100 arbitrary fluorescent units). However, after IL-1β stimulation for 6 h, VCAM-1 was expressed in a large cell population in the static (no flow) condition (83.08%, threshold set at 100 arbitrary fluorescent units) and in the athero-prone condition (54.59%, threshold set at 100 arbitrary fluorescent units). In contrast, only a small percentage of cells (17.66%, threshold set at 100 arbitrary fluorescent units) expressed VCAM-1 in response to IL-1β when they were preconditioned with the athero-protective waveform. These results suggest that athero-protective flow suppresses IL-1β-induced VCAM-1 expression, which is similar to the in vitro observations by using tumor necrosis factor α as stimulus in EC preconditioning with laminar shear stress (46) and ex vivo findings by using tumor necrosis factor α in perfused vascular segments (47). An interesting finding of our study is that a percentage of the cells under athero-prone flow express high levels of VCAM-1, whereas some others do not. This reflects the fact that although the athero-prone shear stress waveform is very small in magnitude, it regulates endothelial function in a dramatically different way compared to the static condition. In contrast to VCAM-1, E-selectin showed maximum expression on the cell surface after 4 h of IL-1β in all three groups and there is no significant difference among them (Fig. 5b). These waveforms also do not influence cytokine IL-1β-stimulated NF-κB activation. These differences imply that the suppression of IL-1β-mediated VCAM-1 expression by athero-protective flow involves complex transcriptional mechanisms involving NF-κB-dependent and -independent pathways in the context of flow preconditioning.
Fig. 5.

Preconditioning with an athero-protective waveform suppresses IL-1β-inducible VCAM-1 expression. (a and b) Flow cytometry analysis of EC surface expression of VCAM-1 (a) and E-selectin (b). HUVEC were preconditioned by exposure to static (no flow), athero-prone, or athero-protective conditions for 24 h (a Upper and b Upper), and then challenged with IL-1β (1 units/ml) for 6 h (for VCAM-1, a Lower) or 4 h (for E-selectin, b Lower) under static conditions, followed by flow cytometric analysis of surface VCAM-1 or E-selectin expression. (c) Western blot analysis of VCAM-1 and E-selectin protein expression. HUVEC preconditioned by exposure to static (lanes 1; no flow) or athero-prone (lanes 2) and athero-protective (lanes 3) conditions for 24 h were challenged with IL-1β (1 units/ml) for 4 h under static condition. Cells were lysed, and VCAM-1 and E-selectin proteins were analyzed by Western blotting.
Summary. In this study we report the development of an experimental in vitro model system in which cultured human EC can be exposed to well defined shear stress waveforms that accurately simulate those present in vivo in atherosclerosis-susceptible and atherosclerosis-resistant regions of the human carotid artery. Applying this system, we have identified differential patterns of gene expression in EC induced by two types of biomechanical stimuli (athero-prone and athero-protective) shear stress waveforms. Many of the differentially regulated genes have pathophysiological functions in atherosclerosis initiation and/or progression, thus demonstrating the in vivo relevance of this model. In particular, EC exposed to the wall shear stresses present in atherosclerosis-susceptible arterial geometries acquire a proinflammatory phenotype, expressing several important chemokine/chemokine receptors. The athero-prone waveform also elicited a dysregulation of the expression and organization of cytoskeletal and junctional proteins. In addition, we have observed a differential activation of the NF-κB transcriptional pathway and have documented enhanced cytokineinducible cell surface expression of the atherosclerosis-associated adhesion molecule VCAM-1 in EC preconditioned by exposure to an athero-prone waveform compared with an athero-protective waveform. Taken together, these data strongly implicate the modulation of endothelial phenotype by components of the biomechanical milieu present at sites of atherosclerotic lesion development in the human vascular system.
Supplementary Material
Acknowledgments
We thank Jason Comander for assistance with microarray data analysis, Jeanne-Marie Kiely for helpful comments on this manuscript, Kay Case and Vannessa Davis for cell culture assistance, and Peter Morley and Andrew Gallant for fabrication of the dynamic flow system. This study was supported mainly by National Heart Lung and Blood Institute Grants R37-HL51150 and P50-HL56985 (to M.A.G. and G.G.-C.) and R01-HL61794 (to M.R.K.-M. and R.D.K.).
Author contributions: G.D., M.R.K.-M., R.D.K., G.G.-C., and M.A.G. designed research; G.D., M.R.K.-M., Y.Z., and S.V. performed research; S.N. contributed new reagents/analytical tools; G.D., M.R.K.-M., S.N., R.D.K., G.G.-C., and M.A.G. analyzed data; G.D., G.G.-C., and M.A.G. wrote the paper; B.R.B. is one of the developers of the fluid mechanical system used in this manuscript; and M.A.G. was the principal investigator.
Abbreviations: EC, endothelial cells; OSI, oscillatory shear index; HUVEC, human umbilical vein EC; VCAM-1, vascular cell adhesion molecule 1; Cx, connexin.
References
- 1.Ross, R. (1999) N. Engl. J. Med. 340, 115-126. [DOI] [PubMed] [Google Scholar]
- 2.VanderLaan, P. A., Reardon, C. A. & Getz, G. S. (2004) Arterioscler. Thromb. Vasc. Biol. 24, 12-22. [DOI] [PubMed] [Google Scholar]
- 3.Wissler, R. W. & Strong, J. P. (1998) Am. J. Pathol. 153, 1023-1033. [DOI] [PMC free article] [PubMed] [Google Scholar]
- 4.Corti, R., Fuster, V., Badimon, J. J., Hutter, R. & Fayad, Z. A. (2001) Ann. N.Y. Acad. Sci. 947, 181-195; discussion 195-198. [DOI] [PubMed] [Google Scholar]
- 5.Ku, D. N., Giddens, D. P., Zarins, C. K. & Glagov, S. (1985) Arteriosclerosis 5, 293-302. [DOI] [PubMed] [Google Scholar]
- 6.Friedman, M. H., Bargeron, C. B., Deters, O. J., Hutchins, G. M. & Mark, F. F. (1987) Atherosclerosis 68, 27-33. [DOI] [PubMed] [Google Scholar]
- 7.Gimbrone, M. A., Jr., Topper, J. N., Nagel, T., Anderson, K. R. & Garcia-Cardena, G. (2000) Ann. N.Y. Acad. Sci. 902, 230-239; discussion 239-240. [DOI] [PubMed] [Google Scholar]
- 8.Davies, P. F. (2000) Circ. Res. 86, 114-116. [DOI] [PubMed] [Google Scholar]
- 9.Chien, S., Li, S. & Shyy, Y. J. (1998) Hypertension 31, 162-169. [DOI] [PubMed] [Google Scholar]
- 10.Berk, B. C., Abe, J. I., Min, W., Surapisitchat, J. & Yan, C. (2001) Ann. N.Y. Acad. Sci. 947, 93-109; discussion 109-111. [DOI] [PubMed] [Google Scholar]
- 11.Garcia-Cardena, G., Comander, J., Anderson, K. R., Blackman, B. R. & Gimbrone, M. A., Jr. (2001) Proc. Natl. Acad. Sci. USA 98, 4478-4485. [DOI] [PMC free article] [PubMed] [Google Scholar]
- 12.McCormick, S. M., Eskin, S. G., McIntire, L. V., Teng, C. L., Lu, C. M., Russell, C. G. & Chittur, K. K. (2001) Proc. Natl. Acad. Sci. USA 98, 8955-8960. [DOI] [PMC free article] [PubMed] [Google Scholar]
- 13.Chen, B. P., Li, Y. S., Zhao, Y., Chen, K. D., Li, S., Lao, J., Yuan, S., Shyy, J. Y. & Chien, S. (2001) Physiol. Genomics 7, 55-63. [DOI] [PubMed] [Google Scholar]
- 14.Wasserman, S. M., Mehraban, F., Komuves, L. G., Yang, R. B., Tomlinson, J. E., Zhang, Y., Spriggs, F. & Topper, J. N. (2002) Physiol. Genomics 12, 13-23. [DOI] [PubMed] [Google Scholar]
- 15.Brooks, A. R., Lelkes, P. I. & Rubanyi, G. M. (2002) Physiol. Genomics 9, 27-41. [DOI] [PubMed] [Google Scholar]
- 16.Zarins, C. K., Giddens, D. P., Bharadvaj, B. K., Sottiurai, V. S., Mabon, R. F. & Glagov, S. (1983) Circ. Res. 53, 502-514. [DOI] [PubMed] [Google Scholar]
- 17.Blackman, B. R., Garcia-Cardena, G. & Gimbrone, M. A., Jr. (2002) J. Biomech. Eng. 124, 397-407. [DOI] [PubMed] [Google Scholar]
- 18.Delfino, A., Stergiopulos, N., Moore, J. E., Jr. & Meister, J. J. (1997) J. Biomech. 30, 777-786. [DOI] [PubMed] [Google Scholar]
- 19.Perktold, K., Resch, M. & Florian, H. (1991) J. Biomech. Eng. 113, 464-475. [DOI] [PubMed] [Google Scholar]
- 20.Younis, H. F., Kaazempur-Mofrad, M. R., Chan, R. C., Isasi, A. G., Hinton, D. P., Chau, A. H., Kim, L. A. & Kamm, R. D. (2004) Biomech. Model Mechanobiol. 3, 17-32. [DOI] [PubMed] [Google Scholar]
- 21.Kaazempur-Mofrad, M. R., Isasi, A. G., Younis, H. F., Chan, R. C., Hinton, D. P., Sukhova, G., LaMuraglia, G. M., Lee, R. T. & Kamm, R. D. (2004) Ann. Biomed. Eng. 32, 932-946. [DOI] [PubMed] [Google Scholar]
- 22.Bussolari, S. R., Dewey, C. F., Jr., & Gimbrone, M. A., Jr. (1982) Rev. Sci. Instrum. 53, 1851-1854. [DOI] [PubMed] [Google Scholar]
- 23.Dewey, C. F., Jr., Bussolari, S. R., Gimbrone, M. A., Jr., & Davies, P. F. (1981) J. Biomech. Eng. 103, 177-185. [DOI] [PubMed] [Google Scholar]
- 24.Taylor, C. A., Hughes, T. J. & Zarins, C. K. (1998) Ann. Biomed. Eng. 26, 975-987. [DOI] [PubMed] [Google Scholar]
- 25.Hwang, J., Saha, A., Boo, Y. C., Sorescu, G. P., McNally, J. S., Holland, S. M., Dikalov, S., Giddens, D. P., Griendling, K. K., Harrison, D. G. & Jo, H. (2003) J. Biol. Chem. 278, 47291-47298. [DOI] [PubMed] [Google Scholar]
- 26.Chappell, D. C., Varner, S. E., Nerem, R. M., Medford, R. M. & Alexander, R. W. (1998) Circ. Res. 82, 532-539. [DOI] [PubMed] [Google Scholar]
- 27.Schober, J. M., Chen, N., Grzeszkiewicz, T. M., Jovanovic, I., Emeson, E. E., Ugarova, T. P., Ye, R. D., Lau, L. F. & Lam, S. C. (2002) Blood 99, 4457-4465. [DOI] [PubMed] [Google Scholar]
- 28.Oemar, B. S., Werner, A., Garnier, J. M., Do, D. D., Godoy, N., Nauck, M., Marz, W., Rupp, J., Pech, M. & Luscher, T. F. (1997) Circulation 95, 831-839. [DOI] [PubMed] [Google Scholar]
- 29.Stenina, O. I., Krukovets, I., Wang, K., Zhou, Z., Forudi, F., Penn, M. S., Topol, E. J. & Plow, E. F. (2003) Circulation 107, 3209-3215. [DOI] [PubMed] [Google Scholar]
- 30.Galis, Z. S. & Khatri, J. J. (2002) Circ. Res. 90, 251-262. [PubMed] [Google Scholar]
- 31.Hossain, G. S., van Thienen, J. V., Werstuck, G. H., Zhou, J., Sood, S. K., Dickhout, J. G., de Koning, A. B., Tang, D., Wu, D., Falk, E., et al. (2003) J. Biol. Chem. 278, 30317-30327. [DOI] [PubMed] [Google Scholar]
- 32.Gaspari, T. A., Barber, M. N., Woods, R. L. & Dusting, G. J. (2000) Clin. Exp. Pharmacol. Physiol. 27, 653-655. [DOI] [PubMed] [Google Scholar]
- 33.Dekker, R. J., van Soest, S., Fontijn, R. D., Salamanca, S., de Groot, P. G., VanBavel, E., Pannekoek, H. & Horrevoets, A. J. (2002) Blood 100, 1689-1698. [DOI] [PubMed] [Google Scholar]
- 34.SenBanerjee, S., Lin, Z., Atkins, G. B., Greif, D. M., Rao, R. M., Kumar, A., Feinberg, M. W., Chen, Z., Simon, D. I., Luscinskas, F. W., et al. (2004) J. Exp. Med. 199, 1305-1315. [DOI] [PMC free article] [PubMed] [Google Scholar]
- 35.Passerini, A. G., Polacek, D. C., Shi, C., Francesco, N. M., Manduchi, E., Grant, G. R., Pritchard, W. F., Powell, S., Chang, G. Y., Stoeckert, C. J., Jr., & Davies, P. F. (2004) Proc. Natl. Acad. Sci. USA 101, 2482-2487. [DOI] [PMC free article] [PubMed] [Google Scholar]
- 36.Topper, J. N., Cai, J., Falb, D. & Gimbrone, M. A., Jr. (1996) Proc. Natl. Acad. Sci. USA 93, 10417-10422. [DOI] [PMC free article] [PubMed] [Google Scholar]
- 37.Topper, J. N., Cai, J., Qiu, Y., Anderson, K. R., Xu, Y. Y., Deeds, J. D., Feeley, R., Gimeno, C. J., Woolf, E. A., Tayber, O., et al. (1997) Proc. Natl. Acad. Sci. USA 94, 9314-9319. [DOI] [PMC free article] [PubMed] [Google Scholar]
- 38.Kwak, B. R., Mulhaupt, F., Veillard, N., Gros, D. B. & Mach, F. (2002) Arterioscler. Thromb. Vasc. Biol. 22, 225-230. [DOI] [PubMed] [Google Scholar]
- 39.Boerma, M., Forsberg, L., Van Zeijl, L., Morgenstern, R., De Faire, U., Lemne, C., Erlinge, D., Thulin, T., Hong, Y. & Cotgreave, I. A. (1999) J. Intern. Med. 246, 211-218. [DOI] [PubMed] [Google Scholar]
- 40.Kwak, B. R., Veillard, N., Pelli, G., Mulhaupt, F., James, R. W., Chanson, M. & Mach, F. (2003) Circulation 107, 1033-1039. [DOI] [PubMed] [Google Scholar]
- 41.DePaola, N., Davies, P. F., Pritchard, W. F., Jr., Florez, L., Harbeck, N. & Polacek, D. C. (1999) Proc. Natl. Acad. Sci. USA 96, 3154-3159. [DOI] [PMC free article] [PubMed] [Google Scholar]
- 42.Li, H., Brodsky, S., Kumari, S., Valiunas, V., Brink, P., Kaide, J., Nasjletti, A. & Goligorsky, M. S. (2002) Am. J. Physiol. 282, H2124-H2133. [DOI] [PubMed] [Google Scholar]
- 43.Yeh, H. I., Lu, C. S., Wu, Y. J., Chen, C. C., Hong, R. C., Ko, Y. S., Shiao, M. S., Severs, N. J. & Tsai, C. H. (2003) Arterioscler. Thromb. Vasc. Biol. 23, 1391-1397. [DOI] [PubMed] [Google Scholar]
- 44.van Rijen, H. V., van Kempen, M. J., Postma, S. & Jongsma, H. J. (1998) Cytokine 10, 258-264. [DOI] [PubMed] [Google Scholar]
- 45.Hajra, L., Evans, A. I., Chen, M., Hyduk, S. J., Collins, T. & Cybulsky, M. I. (2000) Proc. Natl. Acad. Sci. USA 97, 9052-9057. [DOI] [PMC free article] [PubMed] [Google Scholar]
- 46.Chiu, J. J., Lee, P. L., Chen, C. N., Lee, C. I., Chang, S. F., Chen, L. J., Lien, S. C., Ko, Y. C., Usami, S. & Chien, S. (2004) Arterioscler. Thromb. Vasc. Biol. 24, 73-79. [DOI] [PubMed] [Google Scholar]
- 47.Yamawaki, H., Lehoux, S. & Berk, B. C. (2003) Circulation 108, 1619-1625. [DOI] [PubMed] [Google Scholar]
Associated Data
This section collects any data citations, data availability statements, or supplementary materials included in this article.