Figure 2.
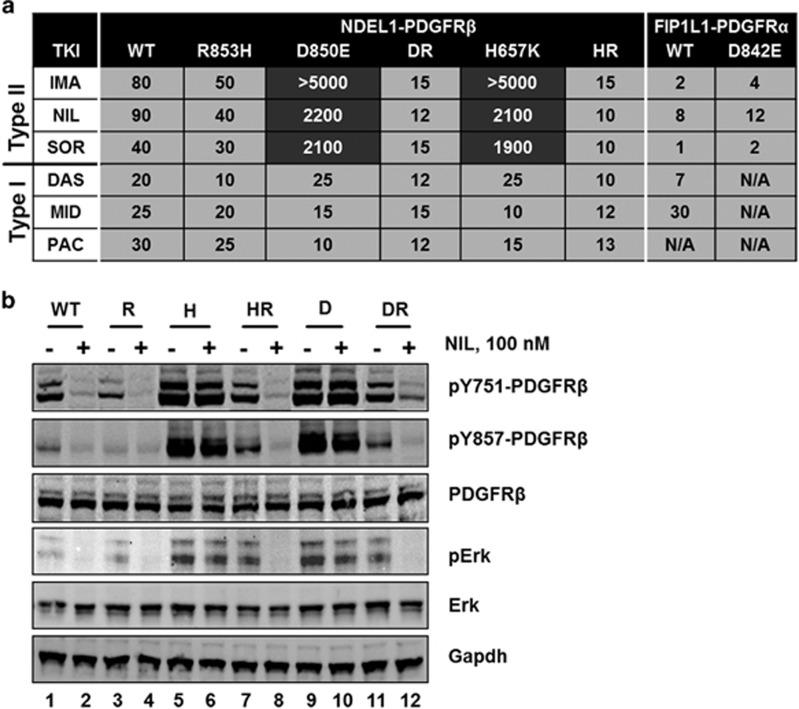
TKI responsiveness of wild-type and mutant NDEL1-PDGFRB genes. (a) Displayed are IC50 values of different TKIs against Ba/F3 cells expressing wild-type (wt) or mutant NDEL1-PDGFRβ fusion proteins. The corresponding IC50 values for Ba/F3 expressing FIP1L1-PDGFRα wt and D842E are given for comparison. (b) Western blot analysis of Ba/F3 cells transduced with wild-type or mutant (R=R853H, H=H657K, HR=H657K/R853H, D=D850E and DR=D850E/R853H) NDEL1-PDGFRB genes. The phosphorylation levels of NDEL1-PDGFRβ at Y751 and Y857, and Erk are displayed. Shown are also the total expression levels of NDEL1-PDGFRβ, Erk and the control gene Gapdh upon mock treatment for 4 h with DMSO (indicated by ‘−‘) or with 100 nm nilotinib (indicated by ‘+').

