Abstract
Chemotherapy is the main treatment method of patients with advanced liver cancer. However, drug resistance is a serious problem in the treatment of hepatocellular carcinoma (HCC). Acid sensing ion channel 1a (ASIC1a) is a H+-gated cation channel; it mediates tumor cell migration and invasion, which suggests that it is involved in the development of malignant tumors. Therefore, we studied the relationship between ASIC1a and drug resistance in human hepatocellular carcinoma. In our study, we found that ASIC1a is highly expressed in human HCC tissue, and that its levels were significantly increased in resistant HCC cells Bel7402/FU and HepG2/ADM. Inhibiting the activity of ASIC1a enhances the chemosensitivity of Bel7402/FU and HepG2/ADM cells. The overexpression of ASIC1a contributed to drug resistance in Bel7402 and HepG2 cells, whereas knockdown of ASIC1a overcame drug resistance in Bel7402/FU and HepG2/ADM cells. We further demonstrated that ASIC1a mediated calcium influx, which resulted in the activation of PI3K/AKT signaling and increased drug resistance. These data suggest that ASIC1a/Ca2+/PI3K/AKT signaling represents a novel pathway that regulates drug resistance, thus offering a potential target for chemotherapy of HCC.
Hepatocellular carcinoma (HCC) is one of the most common malignancies worldwide and has an increasing incidence in western countries and East Asia.1 Chemotherapy plays an important role in the treatment of patients with advanced HCC. However, drug resistance frequently contributes to the failure of chemotherapeutic drug treatments in patients diagnosed with hepatocellular carcinoma.2 Currently, the molecular mechanisms underlying the drug resistance of cancer cells are not fully understood. Revealing the molecular mechanism of drug resistance is indispensable for the development of effective chemotherapeutic drugs.
An acidic extracellular pH is a major feature of malignant tumor tissues. Tumor cells exposed to rigorous intratumoral physical conditions undergo many changes, and it is becoming more and more obvious that acidosis plays an important role in the progression of cancer from preinvasive to malignant disease.3, 4, 5, 6 Much evidence indicates that extracellular acidosis contributes to drug resistance, including reduced apoptotic potential, genetic alterations, and the elevated activity of a multidrug transporter, p-glycoprotein, and pGP.7, 8, 9, 10 Moreover, several studies have shown that a low extracellular pH increases the expression of interlukin-8, carbonic anhydrase, vascular endothelial growth factor, cathepsin B, and matrix metalloproteinases-2 and -9, all of which are associated with increased tumor cell survival, invasion, and migration.11, 12, 13, 14 Therefore, extracellular acid can mediate tumor drug resistance, but its mechanism is not clear.
Acid sensing ion channels (ASICs) are H+-gated cation channels, and at least six subunits of ASICs have been identified to date, namely 1a, 1b, 2a, 2b, 3, and 4.15 ASIC1a has become a hot topic because of its important biological functions and pathological significance.16, 17, 18 There is already growing evidence in ongoing research that ASIC1a mediates tumor cell migration and invasion,19, 20, 21, 22 which suggests that it is involved in the history of the development of malignant tumors. In a recent study, ASIC1a protein expression levels were significantly higher in HCC tissues than in adjacent non-tumor tissues, ASIC1a mRNA and protein expression was significantly higher in SMMC-7721 cells cultured at pH 6.5 than in those cultured at pH 7.4.20 However, the relationship between tumor drug resistance and ASIC1a has not been investigated.
ASIC1a is not only permeable to Na+ but also Ca2+.22, 23, 24 Several studies suggested that ASIC1a had an appreciable Ca2+ permeability and can mediate calcium influx. Activation or sensitization of Ca2+-permeable ASIC1a has also been demonstrated to be responsible for acidosis-mediated ischemic brain disease caused by Ca2+ influx in neurons.25, 26, 27 Ca2+ as an important intracellular second messenger. It plays a key role in tumor cell proliferation, apoptosis, autophagy, and drug resistance.28, 29, 30, 31, 32 Early studies have shown that Ca2+ can regulate the PI3K/AKT pathway.33, 34, 35, 36 As is known to all, PI3K/AKT pathway caused drug resistance, through which mediated tumor cells escape apoptosis.37, 38 In cancer cells, whether Ca2+ involved in drug resistance via the regulation of PI3K/AKT pathway is still unknown.
In the present study, we investigated the role of ASIC1a activation in tumor drug resistance under extracellular acidosis. We demonstrated that ASIC1a-induced calcium influx mediates drug resistance by activating the PI3K/AKT pathway in resistant HCC cells Bel7402/FU and HepG2/ADM, uncovering a novel mechanism underlying tumor drug resistance.
MATERIALS AND METHODS
Patient Enrollment and Tissue Collection
This study was approved by the Human Research Ethics Committee of the First Affiliated Hospital of Anhui Medical University (China). Paired HCC and adjacent non-tumor tissues were obtained from patients who underwent primary surgical resection between 2014 and 2015. Tissue samples were immediately frozen in liquid nitrogen after resection and stored at −80 °C until use. Both tumor and non-tumor tissues were identified by pathological examination.
Cell Culture
The human liver cell line L-02 and the human HCC cell lines Bel7402 and HepG2 were obtained from the Chinese Academy of Sciences (Shanghai, China), HepG2/ADM was obtained from the SXBIO Company (Shanghai, China), Bel7402/FU was obtained from the KeyGEN Company (Nanjing, China). The cell line was cultured in RPMI 1640 medium (Hyclone, Salt Lake City, UT, USA) supplemented with 10% fetal bovine serum (FBS; Hangzhou Sijiqing Biological Engineering Materials, China). Cells were incubated at 37 °C in a humidified atmosphere containing 5% CO2. To maintain the drug resistance phenotype, the medium of the Bel7402/FU cell was supplemented with 20 mg/l 5-FU, the medium of the HepG2/ADM cell was supplemented with 0.25 mg/l adriamycin. The medium was changed every 2 days, Bel7402/FU and HepG2/ADM cells were cultured in two different pHs, including 6.5 and 7.4. One week before subsequent treatments, resistant HCC cells were maintained in complete medium without 5-FU and adriamycin, then cells with >90% viability were used for further studies.
Membrane Protein Extract
A total of 5 × 10⁶ cells were washed with phosphate-buffered saline and lysed on a EP tube with lysis and separation buffer containing a protease inhibitor cocktail. Cell membrane proteins were extracted from the cell suspension using a Membrane Protein Extraction kit (BestBio, Shanghai, China). The membrane protein used for further experiments as described below.
Deregulation of ASIC1a in Bel7402/FU and HepG2/ADM Cells by RNAi
Transfection was performed in a six-well plate. Bel7402/FU and HepG2/ADM cells were maintained in 1 ml of complete medium with 5 mg/ml Polybrene per well and were treated with 0.4 mM ASIC1a-specific shRNA lentiviral particles (Genechem, Shanghai, China) overnight; three wells were transduced with control shRNA lentiviral particles. Then, the medium in each well was replaced with 1 ml of complete medium (without Polybrene) and the cells were diluted to 1:3 for selecting stable clones expressing the shRNA by 3 mg/ml puromycin dihydrochloride. One week later, stable colonies were expanded for further study.
Overexpression of ASIC1a in Bel7402 and HepG2 Cells
Transfection was performed in a six-well plate. Bel7402 and HepG2 cells were maintained in 1 ml of complete medium with 5 mg/ml Polybrene per well and were treated with 0.4 mM ASIC1a gene-lentiviral particles (Genechem, Shanghai, China) overnight; three wells were transduced with empty lentiviral particles. Then, the medium in each well was replaced with 1 ml of complete medium (without Polybrene) and the cells were diluted to 1:3 for selecting stable clones expressing the target gene by 3 mg/ml puromycin dihydrochloride. One week later, stable colonies were expanded for further study.
Western Blotting
Cultured cells were lysed with protein lysis buffer containing 20 mM Tris-HCl (pH 7.4), 5 mM EDTA, 1% Triton-X 100, 150 mM NaCl, 1% DTT, and 1% protease inhibitor cocktail (Sigma). The protein concentration in the lysates was determined using a BCA-200 Protein Assay Kit (Pierce, Rockford, IL, USA). Protein samples were separated by 10% SDS-polyacrylamide gel and then transferred to polyvinyldifluoride membranes (Millipore, USA). The membranes were then blocked for 1 h with 5% skim milk in TBST (10 mM Tris, 150 mM NaCl, and 0.05% Tween 20 (pH8.3)) at room temperature. The membranes were incubated overnight at 4 °C with anti-ASIC1a, ASIC2, ASIC3, ASIC4 (1:200, Alomone Labs, Jerusalem, Israel), anti-PI3K (1:300, Bioss, Beijing, China), anti-AKT (1:300, Bioss, Beijing, China), anti-Phospho-AKT (Cell Signaling Technology, Danvers, MA, USA), anti-Na+/K+-ATPase (Abcam, Cambridge, UK), or β-actin (Zsbio, Beijing, China) antibodies. The membranes were washed in TBST and incubated with secondary antibody (1:10 000) for 1 h at room temperature followed by exposure to electrochemiluminescence. The results are expressed as a percentage of control signals in each blot to correct for variations between blots.
MTT Assay
After various treatments, cell viability was measured by using the MTT assay, which was based on the conversion of MTT to formazan crystals by mitochondrial dehydrogenases. Cell cultures were incubated with MTT solution (5 mg/ml) for 4 h at 37 °C. Then, the medium was discarded and dimethyl sulfoxide was added to solubilize the reaction product formazan by shaking for 15 min. Absorbance at 492 nm was measured with a microplate reader (ELx800, Bio-Tek, Winooski, VT, USA). Cell viability of the vehicle group that was not exposed to acidosis was defined as 100%. Cell viability was expressed as a percentage of the value in the control group.
Colony Formation Assay
Bel7402/FU or HepG2/ADM cells were plated at a final density of 1 × 10³–5 × 10³cells/well of a six-well plate. After various treatments, the growth medium was changed every 2 days. After 2 weeks, the plates were rinsed in phosphate-buffered saline and fixed with ethanol and then stained with 0.05% crystal violet in 20% ethanol to visualize foci.
Calcium Imaging
[Ca2+]i of Bel7402/FU and HepG2/ADM cells using fluorescence imaging. Cells on a glass dish were washed three times with D-Hanks' solution and incubated with 5 μM Fluo-3 AM (Dojindo Laboratories, Kumamoto, Japan) for 30 min at 37 °C, followed by three washes and additional incubation in normal Hanks' solution for 10 min. To eliminate the effects of voltage-gated Ca2+ channels, 5 μM verapamil (Sigma) were added to the extracellular fluid. Using a laser scanning confocal microscope, Fluo-3 AM was excited at 488 nm, and emission was measured at 510 nm. Digitized images were acquired, stored, and analyzed on a computer controlled by Leica-sp5 LAS AF software.
Detecting [Ca2+]i
[Ca2+]i of L-02, Bel7402, HepG2, Bel7402/FU, and HepG2/ADM using flow cytometry. Cells suspension in EP tube were washed three times with D-Hanks' solution and incubated with 5 μM Fluo-3 AM (Dojindo Laboratories, Kumamoto, Japan) for 30 min at 37 °C, followed by three washes and additional incubation in normal Hanks' solution for 10 min. Using a flow cytometer, Fluo-3 AM was excited at 488 nm, and emission was measured at 510 nm. Digitized images were acquired, stored, and analyzed on a computer controlled by FlowJo 7.6.1 software.
Statistical Analysis
Each experiment was performed at least in triplicate, and the measurements were performed in three independent experiments. Data are expressed as the means±s.d. Student's t-test was used to compare the means of two groups. P<0.05 was considered statistically significant. All analyses were performed using the SPSS 13.0 statistical packages (SPSS Inc., Chicago, IL, USA).
RESULTS
ASIC1a is Highly Expressed in Human HCC Tissue.
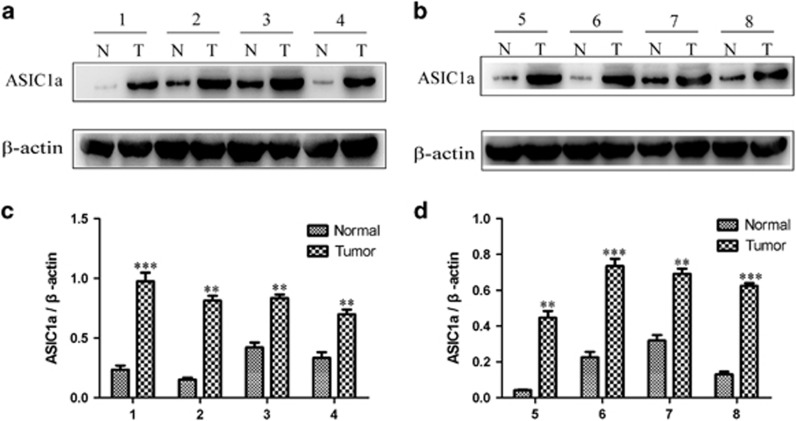
It has been found that the expression levels of the ASIC1a protein were significantly higher in HCC tissues than in adjacent non-tumor tissues by immunohistochemistry.20 To further determine the expression level of ASIC1a in hepatocellular carcinoma, the expression of ASIC1a was examined by western blotting in eight paired HCC tissues and adjacent non-tumor tissues. As shown in Figure 1, the ASIC1a protein is highly expressed in HCC tissues, which is consistent with a previous study.20 These data suggested that ASIC1a upregulation was positively correlated with the tumor progression in HCC.
Figure 1.
ASIC1a is highly expressed in human HCC tissue. (a and b): Western blotting analysis of ASIC1a protein expression levels in HCC tissue and adjacent non-tumor tissue. (c and d): Histogram showing the semiquantitative analyses of the gels from western blotting. Western blot bands are representative of three independent experiments. Data were expressed as the mean±s.d., **P<0.01 versus normal group, ***P<0.001 versus normal group, n=8.
The ASIC1a Expression was Significantly Upregulated in Resistant HCC Cells and On the Membrane
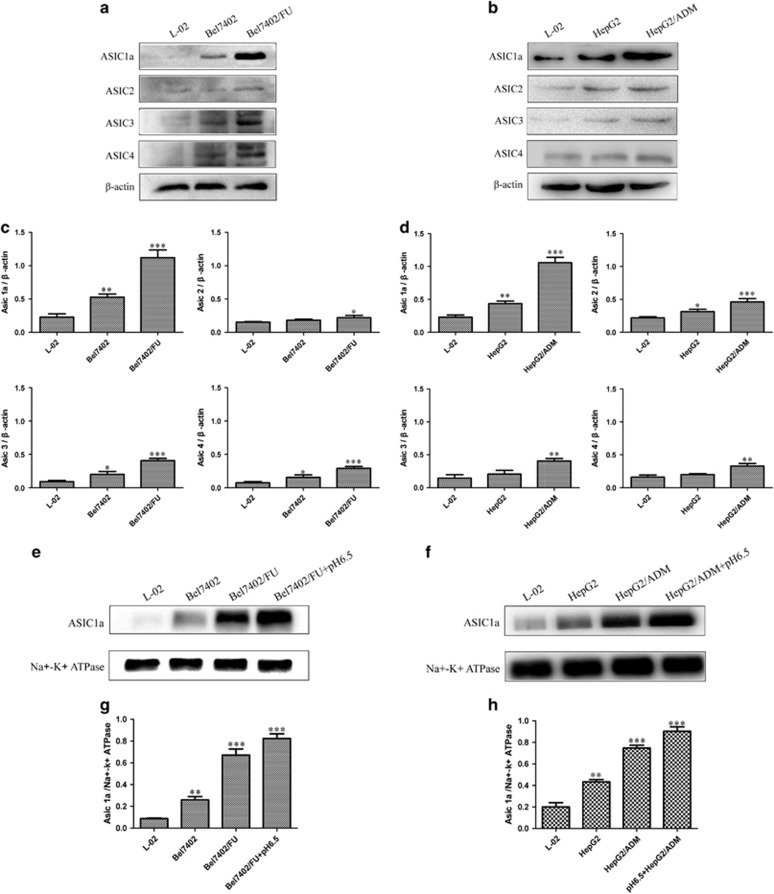
ASIC1a mediated tumor cell migration and invasion,20 which suggested that ASIC1a plays an important role in tumor progression. The relationship between tumor drug resistance and ASIC1a has not been investigated. Therefore, we investigated the expression of ASICs by western blotting in the drug resistance of liver cancer cells Bel7402/FU and HepG2/ADM. As shown in Figures 2a and c, compared with L-02 and Bel7402 cells, ASIC1a expression was significantly upregulated, but ASIC2, 3, and 4 expression was not obviously increased in Bel7402/FU cells. Similarly, ASIC1a expression was significantly upregulated rather than ASIC2, 3, and 4 in HepG2/ADM cells (Figures 2b and d).
Figure 2.
ASIC1a and 2, 3, 4 protein expression levels in resistant HCC cells. (a and b): Western blotting analysis of ASIC1a and 2, 3, 4 protein expression levels in L-02, Bel7402, Bel7402/FU, HepG2, and HepG2/ADM cells. (c and d): Histogram showing the semiquantitative analyses of the gels from western blotting. (e and f): Membrane ASIC1a protein expression levels in L-02, Bel7402, Bel7402/FU, HepG2, and HepG2/ADM cells. (g and h): Histogram showing the semiquantitative analyses of the gels from western blotting. Western blot bands are representative of three independent experiments. Data were expressed as the mean±s.d., *P<0.05 versus L-02 group, **P<0.01 versus L-02 group, ***P<0.001 versus L-02 group.
ASIC1a, with H+-gated cation channels, exerts its effect only under circumstances when it exists on the membrane.39, 40, 41 This led us to investigate the expression of ASIC1a on the membrane of the resistant HCC cells. Western blot analysis showed that membrane ASIC1a has a high expression on Bel7402/FU cells compared with L-02 and Bel7402 cells (Figures 2e and g). Additionally, membrane ASIC1a was markedly upregulated in HepG2/ADM cells (Figures 2f and h). ASIC1a has different expression at pH values, its level was upregulated at pH 6.5 compared with pH 7.4, which is the normal pH of the body.20 Therefore, we cultured Bel7402/FU and HepG2/ADM cells in a pH 6.5 medium and assessed membrane ASIC1a expression by western blotting. It is noteworthy that membrane ASIC1a has a higher expression on Bel7402/FU and HepG2/ADM cells at pH 6.5 than that at pH 7.4 (Figure 2). Our results showed that an acidic extracellular pH facilitates ASIC1a trafficking to the membrane.
Taken together, these data suggest that ASIC1a may act as a drug resistance candidate in drug resistance of human hepatocellular carcinoma.
Inhibiting the Activity of ASIC1a Enhances the Chemosensitivity of Bel7402/FU and HepG2/ADM Cells
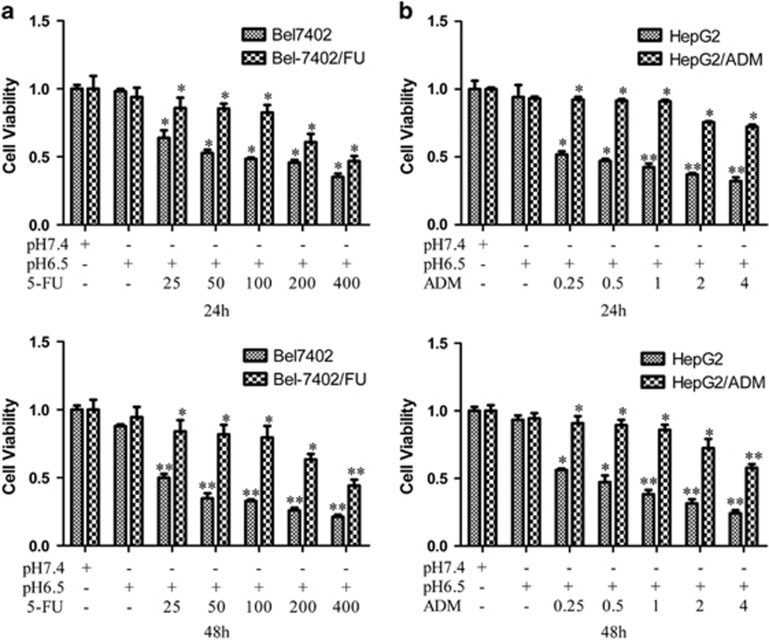
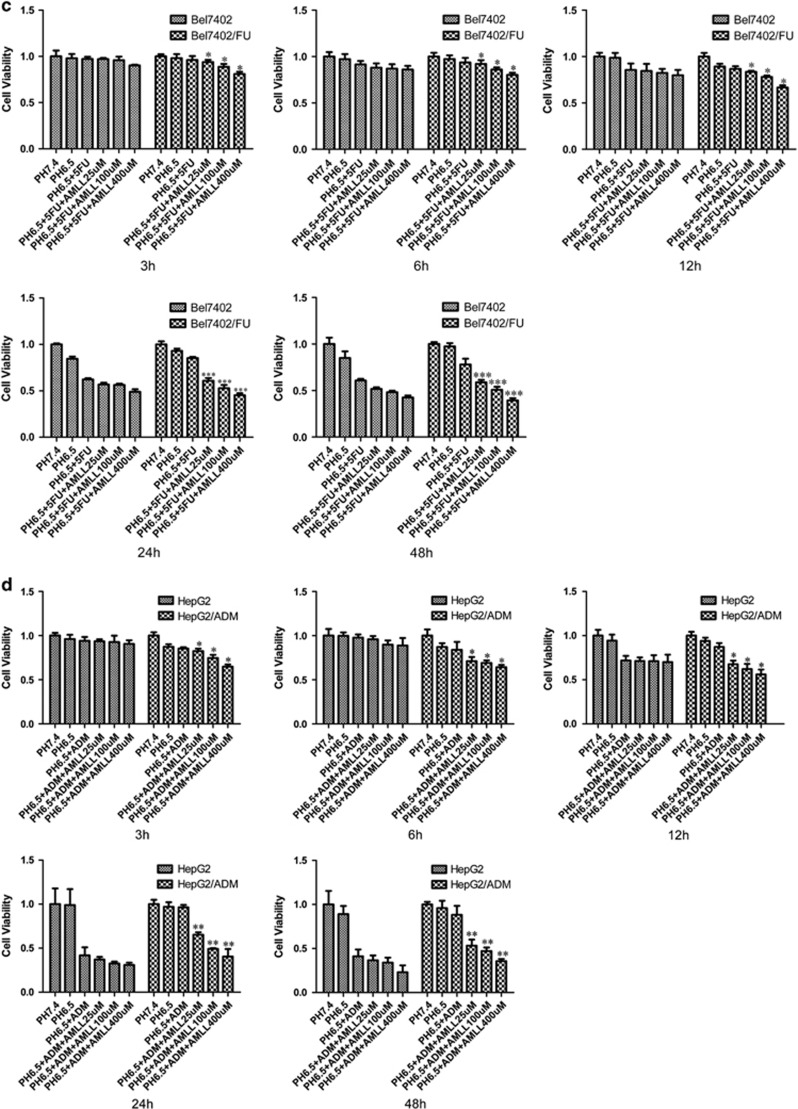
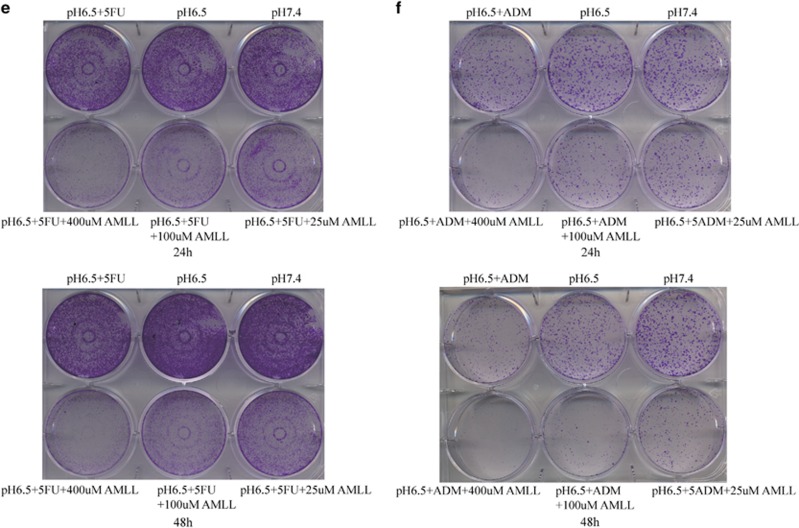
Because of the significant increase in ASIC1a expression in Bel7402/FU and HepG2/ADM cells (Figure 2), we inhibited the activity of ASIC1a by amiloride (a non-selective inhibitor of ASICs) to elucidate the direct implication of ASIC1a in the chemosensitivity of Bel7402/FU and HepG2/ADM cells. First, we examined the chemoresistance of Bel7402/FU and HepG2/ADM cells. In a pH 6.5 medium, the ability of 5-FU to inhibit the growth of Bel7402/FU cells and adriamycin (ADM) to inhibit the growth of HepG2/ADM cells was evaluated using MTT assay. As shown in Figures 3a and b, compared with Bel7402 and HepG2 cells, respectively, Bel7402/FU and HepG2/ADM cells had obvious chemoresistance. Furthermore, we investigated the activity of ASIC1a effect on drug resistance by MTT assay, the results showed that we inhibited the activity of ASIC1a by amiloride, significantly reducing the chemoresistance of Bel7402/FU and HepG2/ADM cells in an acidic medium (pH 6.5, Figures 3c and d). Additionally, colony formation assay revealed that the chemoresistance of Bel7402/FU and HepG2/ADM cells was significantly weakened when ASIC1a activity was inhibited (Figures 3e and f).
Figure 3.
Inhibition of the activity of ASIC1a enhances the chemosensitivity of Bel7402/FU and HepG2/ADM cells. (a and b): Chemosensitivity of Bel7402/FU and HepG2/ADM cells by MTT assay. MTT assays were conducted at 24 and 48 h. The concentrations of 5-FU were 25, 50, 100, 200, and 400 mg/l, and the concentrations of ADM were 0.25, 0.5, 1, 2, and 4 mg/l. (c and d): Effect of the activity of ASIC1a effect on drug resistance by MTT assay. MTT assays were conducted at 3, 6, 12, 24, and 48 h. The concentration of 5-FU was 100 mg/l, the concentration of ADM was 1 mg/l, the concentrations of amiloride were 25, 100, and 400 μmol/l. Data were expressed as the mean±s.d., *P<0.05 versus pH6.5+5FU or pH6.5+ADM group, **P<0.01 versus pH6.5+5FU or pH6.5+ADM group, ***P<0.001 versus pH6.5+5FU or pH6.5+ADM group. (e): Effect of the activity of ASIC1a effect on drug resistance by colony formation assay in Bel7402/FU cells. The concentration of 5-FU was 100 mg/l, and the concentrations of amiloride were 25, 100, and 400 μmol/l. (F): Effect of the activity of ASIC1a effect on drug resistance by colony formation assay in HepG2/ADM cells. The concentration of ADM was 1 mg/l, and the concentrations of amiloride were 25, 100, and 400 μmol/l. Colony formation assays were conducted at 24 and 48 h.
Silencing of the ASIC1a Gene Enhances the Chemosensitivity of Bel7402/FU and HepG2/ADM Cells
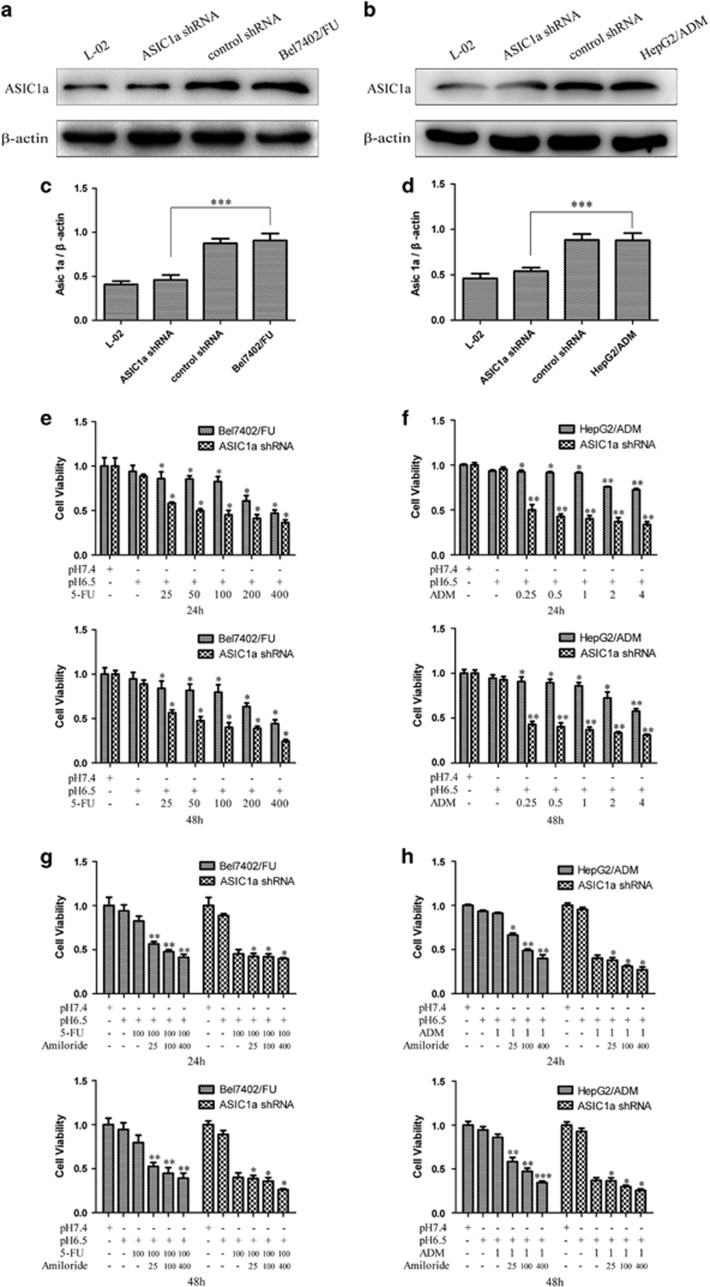
Our research showed that ASIC1a expression was significantly upregulated in Bel7402/FU and HepG2/ADM cells, either total proteins or membrane proteins. Therefore, we silenced the ASIC1a gene by shRNA to analyze the effect of the ASIC1a protein on drug resistance in the Bel7402/FU and HepG2/ADM cells. The silencing effect was confirmed by western blotting. As shown in Figures 4a and c, the expression level of ASIC1a was significantly reduced in Bel7402/FU-shASIC1a transfectants compared with control transfectants. Similarly, shASIC1a significantly downregulated ASIC1a protein expression in HepG2/ADM-shASIC1a compared with control transfected cells (Figures 4b and d).
Figure 4.
Silencing of the ASIC1a gene enhances the chemosensitivity of Bel7402/FU and HepG2/ADM cells. (a and b): ASIC1a protein expression levels were decreased in Bel7402/FU and HepG2/ADM cells by shRNA treatment. The silencing of ASIC1a in Bel7402/FU and HepG2/ADM cells was analyzed by western blotting. (c and d): Histogram showing the semiquantitative analyses of the gels from western blotting. Western blot bands are representative of three independent experiments. Data were expressed as the mean±s.d., ***P<0.001. (e and f): Chemosensitivity of Bel7402/FU-shASIC1a and HepG2/ADM-shASIC1a cells by MTT assay. MTT assays were conducted at 24 and 48 h. The concentrations of 5-FU were 25, 50, 100, 200, and 400 mg/l, and concentrations of ADM were 0.25, 0.5, 1, 2, and 4 mg/l. Data were expressed as the mean±s.d., *P<0.05 versus pH6.5+5FU or pH6.5+ADM group, **P<0.01 versus pH6.5+5FU or pH6.5+ADM group. (g and h): The effect of the activity of ASIC1a effect on drug resistance in Bel7402/FU-shASIC1a and HepG2/ADM-shASIC1a cells by MTT assay. MTT assays were conducted at 24 and 48 h. The concentration of 5-FU was 100 mg/l, the concentration of ADM was 1 mg/l, and the concentrations of amiloride were 25, 100, and 400 μmol/l. Data were expressed as the mean±s.d., *P<0.05 versus pH6.5+5FU or pH6.5+ADM group, **P<0.01 versus pH6.5+5FU or pH6.5+ADM group.
After ASIC1a shRNA transfection, the ability of 5-FU to inhibit the growth of Bel7402/FU cells and adriamycin to inhibit the growth of HepG2/ADM cells was evaluated using the MTT assay. The results showed that cell proliferation was significantly decreased in the Bel7402/FU-shASIC1a cells group compared with the control, which suggested that cell chemosensitivity was significantly enhanced when Bel7402/FU cells were treated with ASIC1a shRNA (Figure 4e). Additionally, cell chemosensitivity was significantly enhanced when HepG2/ADM cells were treated with ASIC1a shRNA (Figure 4f).
Then, we inhibited the activity of ASIC1a by amiloride, whereas the ability of 5-FU to inhibit the growth of Bel7402/FU-shASIC1a cells was evaluated using the MTT assay. As shown in Figure 4g, compared with Bel7402/FU cells, the ability of 5-FU to inhibit the growth of Bel7402/FU-shASIC1a cells was not enhanced when ASIC1a activity was inhibited by amiloride, which showed that amiloride enhanced the ability of 5-FU to inhibit the growth of Bel7402/FU cells via ASIC1a inhibition. Additionally, compared with HepG2/ADM cells, the ability of ADM to inhibit the growth of HepG2/ADM-shASIC1a cells was not enhanced when ASIC1a activity is inhibited by amiloride (Figure 4h), which showed that amiloride enhanced the ability of ADM to inhibit the growth of HepG2/ADM cells via ASIC1a inhibition.
Overexpression of the ASIC1a Gene Enhances the Chemoresistance of Bel7402 and HepG2 Cells
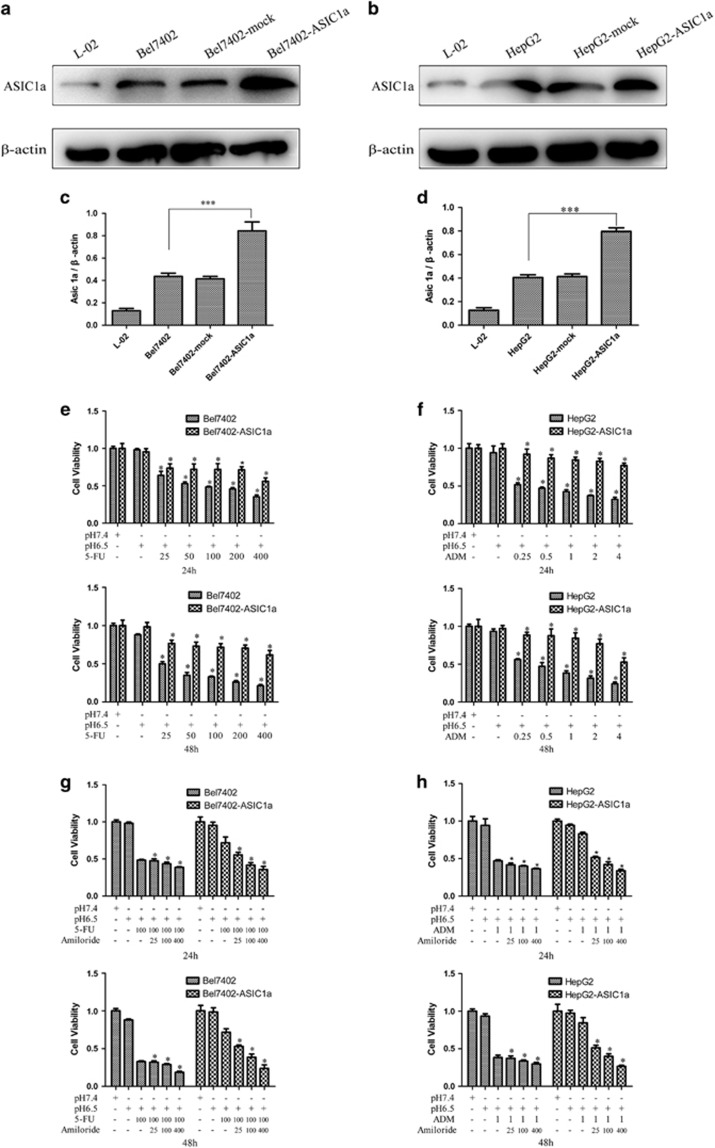
After verifying the effect of ASIC1a gene suppression on tumor cell chemosensitivity, we transfected Bel7402 and HepG2 cells with the ASIC1a expression vector and determined the effect of the overexpression of ASIC1a genes on the chemoresistance of Bel7402 and HepG2 cells. As shown in Figures 5a and b, compared with control transfectants, markedly increased levels of ASIC1a protein were detected by western blotting in Bel7402 transfectants and HepG2 transfectants.
Figure 5.
Overexpression of the ASIC1a gene enhances the chemoresistance of Bel7402 and HepG2 cells. (a and b): Markedly increased levels of the ASIC1a protein were detected by western blotting in Bel7402 transfectants and HepG2 transfectants. (c and d): Histogram showing the semiquantitative analyses of the gels from western blotting. Western blot bands are representative of three independent experiments. Data were expressed as the mean±s.d., ***P<0.001. (e and f): Chemosensitivity of Bel7402-ASIC1a and HepG2-ASIC1a cells by MTT assay. MTT assays were conducted at 24 and 48 h. The concentrations of 5-FU were 25, 50, 100, 200, and 400 mg/l, and the concentrations of ADM were 0.25, 0.5, 1, 2, and 4 mg/l. Data were expressed as the mean±s.d., *P<0.05 versus pH6.5+5FU or pH6.5+ADM group. (g and h): Effect of the activity of ASIC1a effect on drug resistance in Bel7402-ASIC1a and HepG2-ASIC1a cells by MTT assay. The concentration of 5-FU was 100 mg/l, the concentration of ADM was 1 mg/l, and the concentrations of amiloride were 25, 100, and 400 μmol/l. MTT assays were conducted at 24 and 48 h. Data were expressed as the mean±s.d., *P<0.05 versus pH6.5+5FU or pH6.5+ADM group.
Then, we examined the chemoresistance of Bel7402-ASIC1a and HepG2-ASIC1a cells by MTT assay. The results showed that cell proliferation was significantly increased in the Bel7402-ASIC1a cells group compared with the control (Figure 5e), which suggested that cell chemoresistance was significantly enhanced when Bel7402 cells were transfected with the ASIC1a expression vector. Likewise, using MTT assay, we observed, that compared with controls, cell proliferation was significantly increased when HepG2 cells were transfected with ASIC1a expression vector (Figure 5f). In other words, the overexpression of the ASIC1a gene enhances the chemoresistance of HepG2 cells.
Next, we inhibited the activity of ASIC1a by amiloride, whereas the ability of 5-FU to inhibit the growth of Bel7402-ASIC1a cells was evaluated using MTT assay. As shown in Figure 5g, compared with Bel7402 cells, the ability of 5-FU to inhibit the growth of Bel7402-ASIC1a cells was enhanced when ASIC1a activity was inhibited by amiloride, which showed that amiloride enhanced the ability of 5-FU to inhibit the growth of Bel7402-ASIC1a cells via ASIC1a inhibition. Additionally, compared with HepG2 cells, the ability of ADM to inhibit the growth of HepG2-ASIC1a cells were enhanced when ASIC1a activity is inhibited by amiloride (Figure 5h), which showed that amiloride enhanced the ability of ADM to inhibit the growth of HepG2-ASIC1a cells via ASIC1a inhibition.
[Ca2+]i was Significantly Increased in Bel7402/FU and HepG2/ADM Cells
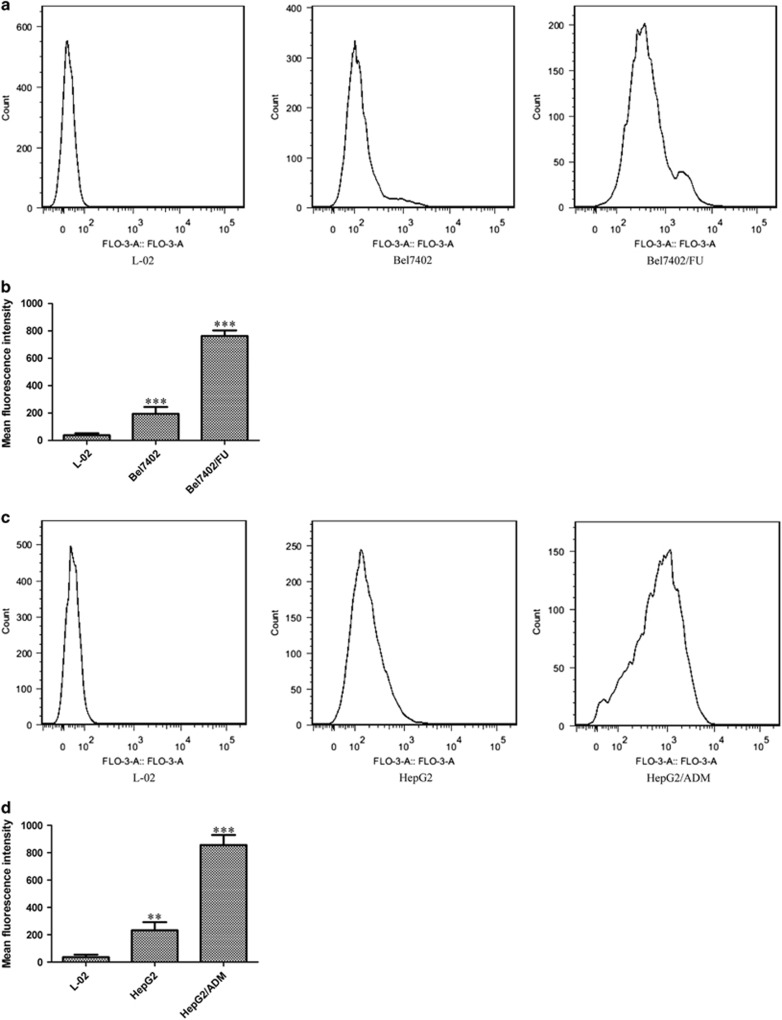
As an important intracellular second messenger, Ca2+ plays a key role in tumor cell proliferation, apoptosis, autophagy, and drug resistance.28, 29, 30 Therefore, we examined [Ca2+]i in Bel7402/FU and HepG2/ADM cells. Ca2+ was labeled with Fluo-3 AM, a fluorescent marker; then, we examined [Ca2+]i by flow cytometry. As shown in Figures 6a and b, compared with L-02 and Bel7402 cells, the mean fluorescence intensity was significantly increased in Bel7402/FU cells, which showed that [Ca2+]i was significantly increased in Bel7402/FU cells. Additionally, compared with L-02 and HepG2 cells, [Ca2+]i was significantly increased in HepG2/ADM cells (Figures 6c and d).
Figure 6.
[Ca2+]i was significantly increased in Bel7402/FU and HepG2/ADM cells. (a and b): Compared with L-02 and Bel7402 cells, the mean fluorescence intensity was significantly increased in Bel7402/FU cells according to flow cytometry. (c and d): Compared with L-02 and HepG2 cells, the mean fluorescence intensity was significantly increased in HepG2/ADM cells according to flow cytometry. The data are means±s.d. of three independent assays (***P<0.001 versus L-02 group).
ASIC1a Mediates Ca2+ Influx in Bel7402/FU and HepG2/ADM Cells
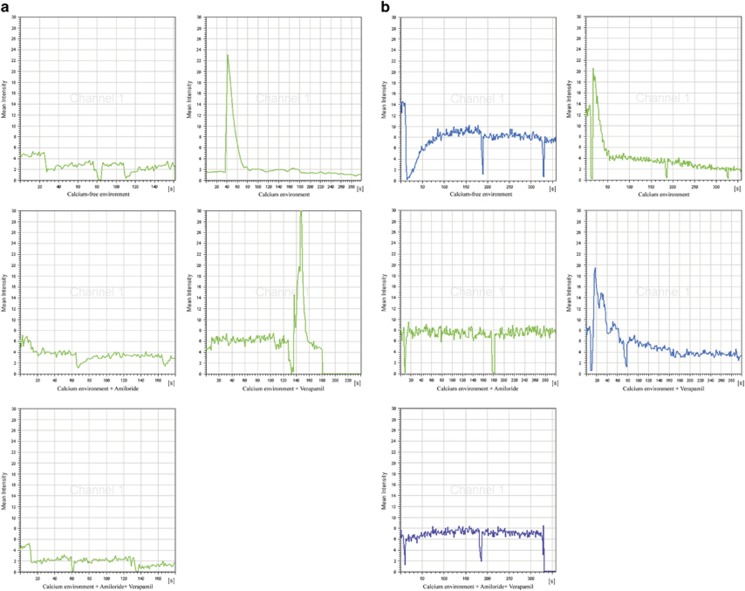
Our research showed that [Ca2+]i was significantly increased in Bel7402/FU and HepG2/ADM cells. Interestingly, the current study found that ASIC1a mediates Ca2+ influx.24 Therefore, we examined whether the increase of [Ca2+]i was caused by ASIC1a- mediated calcium influx. The effects of acidic solution (pH 6.5) on [Ca2+]i were investigated by fluorescent Ca2+-imaging experiment in Bel7402/FU and HepG2/ADM cells. As shown in Figure 7a, the increase in evoked [Ca2+]i appeared as a single sharp peak by acidic and Ca2+-containing solution rather than only acidic solution in Bel7402/FU cells. It is noteworthy that the acid-induced increase in [Ca2+]i was significantly attenuated by amiloride in Bel7402/FU cells. The acid-induced increase in [Ca2+]i was not diminished by verapami to block voltage-gated Ca2+ channels. However, the acid-induced increase in [Ca2+]i was obviously diminished in the presence of amiloride and verapami. Therefore, the elevation in [Ca2+]i induced by acidic and Ca2+-containing solution was inhibited by amiloride to inhibit ASIC1a activity. Equally, the increase in [Ca2+]i induced by acidic and Ca2+-containing solution, and acid-induced increase in [Ca2+]i was significantly attenuated by amiloride to inhibit ASIC1a activity rather than verapami to block voltage-gated Ca2+ channels in HepG2/ADM cells (Figure 7b). These data demonstrate that an essential role for ASIC1a in mediating acid-induced calcium influx in Bel7402/FU and HepG2/ADM cells.
Figure 7.
ASIC1a mediates Ca2+ influx in Bel7402/FU and HepG2/ADM cells. (a): The effects of acidic solution (pH 6.5) on [Ca2+]i were investigated by fluorescent Ca2+-imaging experiment in Bel7402/FU cells. The concentration of amiloride was 100 μmol/l, and the concentration of verapamil was 5 μmol/l. (b): The effects of acidic solution (pH 6.5) on [Ca2+]i were investigated by fluorescent Ca2+-imaging experiment in HepG2/ADM cells. The concentration of amiloride was 100 μmol/l, and the concentration of verapamil was 5 μmol/l.
ASIC1a Regulates the PI3K/AKT Signaling Pathway by Mediating Its Calcium Influx
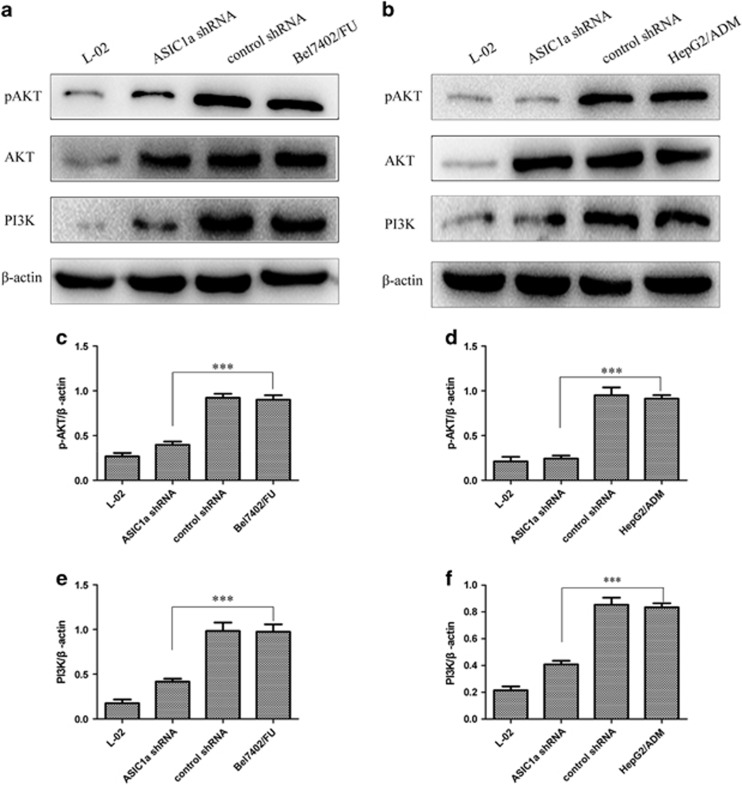
Early studies have shown that Ca2+ can regulate the PI3K/AKT signaling pathway,34, 35, 36 but it was unclear whether ASIC1a involved. Even more interesting is that the PI3K/AKT signaling pathway cause drug resistance by mediating tumor cells escape from apoptosis.37, 38 Given the critical role of the PI3K/AKT signaling pathway in tumor cell drug resistance, we investigated whether ASIC1a mediated calcium influx to regulate the PI3K/AKT signaling pathway. Western blot analysis showed that the levels of PI3K and the phosphorylation of AKT were decreased in Bel7402/FU and HepG2/ADM cells treated with ASIC1a shRNA (Figure 8). These data together implied that ASIC1a might regulate the PI3K/AKT pathway by mediating its calcium influx with the involvement of tumor cell drug resistance.
Figure 8.
ASIC1a regulates the PI3K/AKT signaling pathway. (a and b): Western blot analysis showed that the levels of PI3K and phosphorylated AKT were decreased in Bel7402/FU and HepG2/ADM cells treated with ASIC1a shRNA. (c and e, d and f): Histogram shows the semiquantitative analyses of the gels from western blotting. Western blot bands are representative of three independent experiments. The data are means±s.d. of three independent assays (***P<0.001).
The Inhibition of the PI3K/AKT Signaling Pathway Modulates the Chemosensitivity of Bel7402/FU and HepG2/ADM Cells.
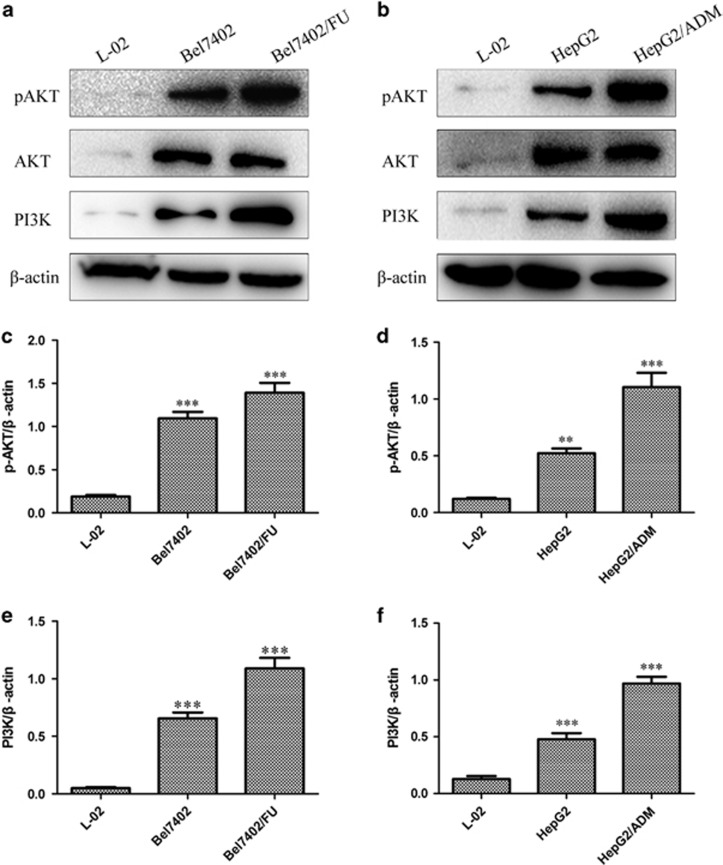
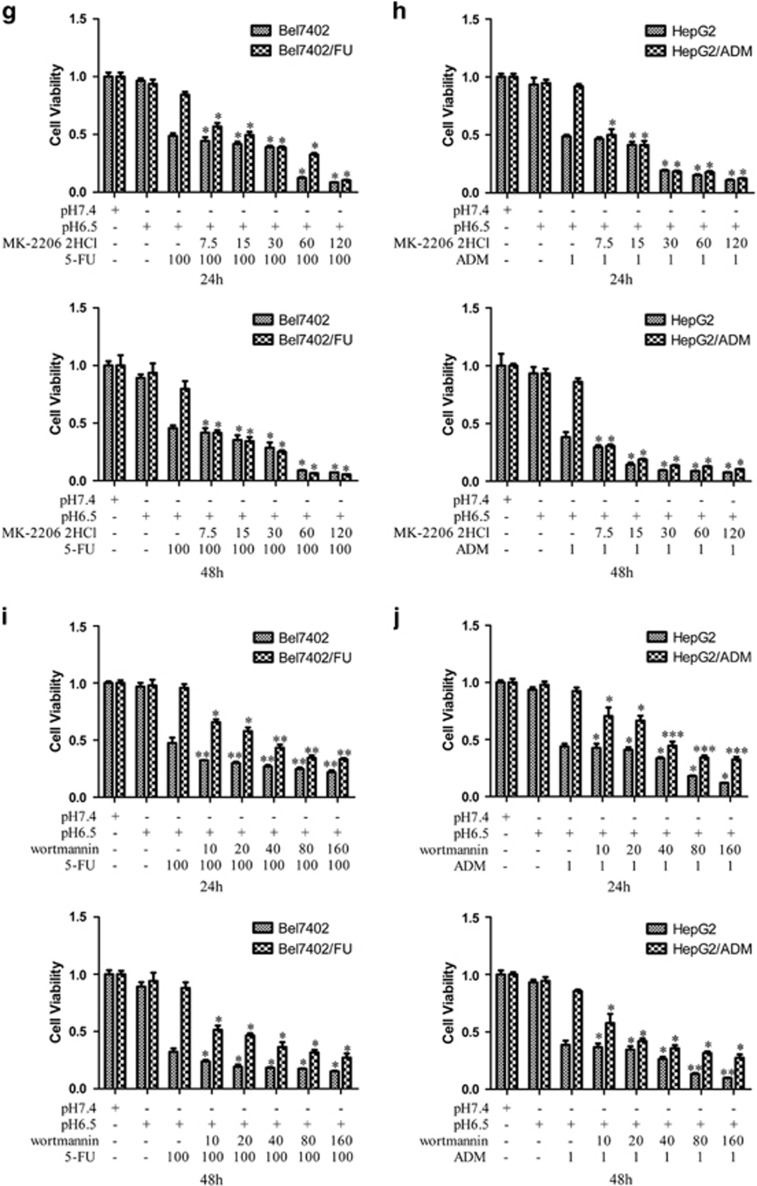
To further determine the role of the PI3K/AKT signaling pathway in Bel7402/FU and HepG2/ADM cells, we first investigated the protein expression levels of PI3K and the phosphorylation of AKT by western blotting. As shown in Figure 9a, compared with L-02 and Bel7402 cells, PI3K and phosphorylated AKT expression was significantly upregulated in Bel7402/FU cells. Similarly, PI3K and phosphorylated AKT expression was significantly upregulated in HepG2/ADM cells (Figure 9b). Then, we examined the effect of PI3K/AKT signaling pathway on the chemosensitivity of Bel7402/FU and HepG2/ADM cells by MTT assay. We observed that the inactivation of the PI3K/AKT pathway by wortmannin (a specific inhibitor of the PI3K/AKT signaling pathway) or MK-2206 2HCl (a specific inhibitor of AKT) made Bel7402/FU cells sensitive to 5-FU (Figures 9g and i). Similar results were also obtained in HepG2/ADM cells (Figures 9h and j). These data implicated a role of the PI3K/AKT signaling pathway in modulating the chemoresistance of Bel7402/FU and HepG2/ADM cells.
Figure 9.
Inhibition of the PI3K/AKT signaling pathway modulates the chemosensitivity of Bel7402/FU and HepG2/ADM cells. (a and b): Western blot analysis showed that the levels of PI3K and phosphorylated AKT were increased in Bel7402/FU and HepG2/ADM cells. (c and e, d and f): Histogram showing the semiquantitative analyses of the gels from western blotting. Western blot bands were representative of three independent experiments. The data are means±s.d. of three independent assays, **P<0.01 versus L-02 group, ***P<0.001 versus L-02 group. (g and i, h and j): The effect of the PI3K/AKT signaling pathway on the chemosensitivity of Bel7402/FU and HepG2/ADM cells by MTT assay. MTT assays were conducted at 24 and 48 h. The concentrations of wortmannin were 10, 20, 40, 80, and 160 μmol/l, the concentrations of MK-2206 2HCl were 7.5, 15, 30, 60, and 120 μmol/l, the concentration of 5-FU was 100 mg/l, and the concentration of ADM was 1 mg/l. The data are means±s.d. of three independent assays, *P<0.05 versus pH6.5+5FU or pH6.5+ADM group, **P<0.01 versus pH6.5+5FU or pH6.5+ADM group, ***P<0.001 versus pH6.5+5FU or pH6.5+ADM group.
DISCUSSION
Major changes in extracellular pH homoeostasis are shared features of most solid tumors, and evidence has strongly indicated that acidosis contributes to tumor development, migration, invasion, and drug resistance.42, 43, 44, 45 However, little is known how tumor cells sense the acidic signal in tumor microenvironment and then activate the acidosis-mediated signaling, leading to aggressiveness of tumor cells and development of the malignant tumor. As is well known, acidity is harmful to normal cell growth and proliferation. However, during a long time of co-evolution with the host, tumor cells have adapted well to acidic tumor microenvironment. ASIC1a as an acid sensor has been shown to promote tumor cell migration and invasion. At present, it is not clear that ASIC1a function and its molecular mechanism in resistant HCC cells. Therefore, identification of ASIC1a function and its molecular mechanism in resistant HCC cells in this study provides a plausible explanation as to why acidic conditions are beneficial to resistant tumor cells for their advances.
Consistent with a previous study, ASIC1a expression was significantly higher in HCC tissues than in adjacent non-tumor tissues, which suggest that it is involved the development of the malignant tumor. Given that extracellular acidosis is a common feature for solid tumors, these findings may have a broad impact.
To elucidate the mechanism of tumor drug resistance, we investigated the ASICs in drug-resistant human HCC cell lines, Bel7402/FU and HepG2/ADM cells. The results showed that ASIC1a was dramatically increased in resistant cells, but ASIC2, 3, and 4 expression was not obviously increased, which indicates that ASIC1a is a major subunit of ASICs rather than ASIC2, 3, and 4 in resistant HCC cells. Because ASIC1a exerts its effect only in circumstances when it exists on the membrane, we also examined its expression in the cell membrane. Similarly, membrane ASIC1a was obviously upregulated in Bel7402/FU and HepG2/ADM cells. It is noteworthy that membrane ASIC1a has a higher expression on Bel7402/FU and HepG2/ADM at pH 6.5 than at pH7.4, suggesting that an acidic extracellular pH is not only an activator of ASIC1a, but also facilitates it trafficking to the membrane. These data showed that ASIC1a upregulation may be positively correlated with tumor drug resistance in HCC.
The aberrant expression of ASIC1a has been detected in resistant HCC cells, and whether ASIC1a plays a key role in tumor drug resistance is an interesting problem. However, a comprehensive understanding of how ASIC1a correlates with the drug resistance of human HCC cells is not currently available. Therefore, we inhibited the activity of ASIC1a by amiloride to elucidate the direct implication of ASIC1a in the chemosensitivity of Bel7402/FU and HepG2/ADM cells by MTT assay and colony formation assay. The results showed that the inhibition of the activity of ASIC1a by amiloride, which causes chemoresistance of Bel7402/FU and HepG2/ADM cells, was significantly reduced in an acidic medium (pH 6.5). In addition, silencing of the ASIC1a genes enhances the chemosensitivity of Bel7402/FU and HepG2/ADM cells. Additionally, the overexpression of the ASIC1a gene enhances the chemoresistance of BEL7402 and HepG2 cells. The above data clearly showed that the altered level of ASIC1a was responsible for changed drug-resistant phenotypes of human HCC cells. In other words, ASIC1a mediates tumor drug resistance in human HCC cells.
As an important intracellular second messenger, Ca2+ plays a key role in tumor cell proliferation, apoptosis, autophagy, and drug resistance. Voltage-gated calcium channels have been widely recognized to mediate calcium influx. It has been found that ASIC1a is permeable to Ca2+. However, it is unknown whether ASIC1a facilitates the drug resistance of HCC cells by mediating its calcium influx. Our research showed that ASIC1a mediated calcium influx rather than voltage-gated calcium channels in Bel7402/FU and HepG2/ADM cells. This showed that ASIC1a mediates tumor drug resistance via its induced calcium influx; however, its molecular mechanisms need to be studied.
It is noteworthy that Ca2+ regulates the PI3K/AKT signaling pathway.34, 35, 36 The PI3K/AKT signaling pathway causes drug resistance by mediating tumor cells to escape apoptosis. Extracellular acidosis contributes to drug resistance, including reduced apoptotic potential, genetic alterations, and the elevated activity of the multidrug transporter, p-glycoprotein. The PI3K/AKT signaling pathway controls the expression and function of many proteins that are necessary for tumor cell drug resistance.46, 47, 48 Increasing evidence indicates that the PI3K/AKT signaling pathway enhances drug efflux by ABC transporters, maintaining the drug resistance of tumor cells.49 It has been found that the PI3K inhibitor LY294002 has therapeutic potential when combined with doxorubicin in the treatment of MRP1-mediated drug resistance50 and is able to block P-gp efflux in mouse leukemic cell lines.51 The inhibition of the PI3K/AKT signaling pathway by LY2940002 or AKT siRNA led to the inhibition of PrPC-induced drug resistance and P-gp upregulation in gastric cancer cells.52 Our previous studies have found that ASIC1a mediated tumor drug resistance via its induced calcium influx in Bel7402/FU and HepG2/ADM cells. On the basis of the above findings, we investigated whether ASIC1a-mediated calcium influx induced tumor drug resistance via the PI3K/AKT signaling pathway. We demonstrated that the resistant cell lines Bel7402/FU and HepG2/ADM presented higher PI3K/AKT activity than the sensitive lines, which was in accordance with the tumor drug resistance phenotype. The altered expression of ASIC1a markedly modulated the activity of the PI3K/AKT signaling pathway in human HCC cell lines. In addition, the inhibition of the PI3K/AKT pathway with the PI3K/AKT signaling pathway-specific inhibitor wortmannin or AKT-specific inhibitor MK-2206 2HCl reversed the chemoresistance of Bel7402/FU and HepG2/ADM cells (Figure 9). These results indicated that ASIC1a-modulated HCC cell drug resistance was, at least in part, PI3K/AKT dependent. Here we found that the expression of ASIC1a had a positive relationship with the activity of the PI3K/AKT signaling pathway in human HCC cell lines, Bel7402 and Bel7402/FU, HepG2 and HepG2/ADM.
Taken together, altered ASIC1a showed the unusual property of association with human HCC cells' drug resistance by modulating the Ca2+/PI3K/AKT signaling pathway in the extracellular acidic microenvironment. Although we have found that ASIC1a induces drug resistance and its molecular mechanisms in resistant HCC cells, other potential mechanisms may still be unidentified. Furthermore, we did not explore the downstream mechanism of the PI3K/AKT signaling pathway in the drug resistance of HCC. Therefore, the molecular mechanisms of tumor drug resistance remain to be further investigated.
Acknowledgments
This work was supported by the Beijing Medical Award Foundation (D.X., YJHYXYJJ-428) and the Natural Science Foundation of Anhui Province (D.X., 11040606M222).
The authors declare no conflict of interest.
References
- Xu N, Zhang J, Shen C et al. Cisplatin-induced downregulation of miR-199a-5p increases drug resistance by activating autophagy in HCC cell. Biochem Biophys Res Commun 2012;423:826–831. [DOI] [PubMed] [Google Scholar]
- Tong SW, Yang YX, Hu HD et al. Proteomic investigation of 5-fluorouracil resistance in a human hepatocellular carcinoma cell line. J Cell Biochem 2012;113:1671–1680. [DOI] [PubMed] [Google Scholar]
- Fang JS, Gillies RD, Gatenby RA. Adaptation to hypoxia and acidosis in carcinogenesis and tumor progression. Semin Cancer Biol 2008;18:330–337. [DOI] [PMC free article] [PubMed] [Google Scholar]
- Gatenby RA, Smallbone K, Maini PK et al. Cellular adaptations to hypoxia and acidosis during somatic evolution of breast cancer. Br J Cancer 2007;97:646–653. [DOI] [PMC free article] [PubMed] [Google Scholar]
- Tavakol S. Acidic pH derived from cancer cells may induce failed reprogramming of normal differentiated cells adjacent tumor cells and turn them into cancer cells. Med Hypotheses 2014;83:668–672. [DOI] [PubMed] [Google Scholar]
- Wojtkowiak JW, Verduzco D, Schramm KJ et al. Drug resistance and cellular adaptation to tumor acidic pH microenvironment. Mol Pharm 2011;8:2032–2038. [DOI] [PMC free article] [PubMed] [Google Scholar]
- Lotz C, Kelleher DK, Gassner B et al. Role of the tumor microenvironment in the activity and expression of the p-glycoprotein in human colon carcinoma cells. Oncol Rep 2007;17:239–244. [PubMed] [Google Scholar]
- Thews O, Gassner B, Kelleher DK et al. Impact of extracellular acidity on the activity of P-glycoprotein and the cytotoxicity of chemotherapeutic drugs. Neoplasia 2006;8:143–152. [DOI] [PMC free article] [PubMed] [Google Scholar]
- Bohloli M, Atashi A, Soleimani M et al. Investigating effects of acidic pH on proliferation, invasion and drug-induced apoptosis in lymphoblastic leukemia. Cancer Microenviron 2016. [DOI] [PMC free article] [PubMed]
- Mendoza EE, Pocceschi MG, Kong X et al. Control of glycolytic flux by AMP-activated protein kinase in tumor cells adapted to low pH. Transl Oncol 2012;5:208–216. [DOI] [PMC free article] [PubMed] [Google Scholar]
- Rozhin J, Sameni M, Ziegler G et al. Pericellular pH affects distribution and secretion of cathepsin B in malignant cells. Cancer Res 1994;54:6517–6525. [PubMed] [Google Scholar]
- Shi Q, Le X, Wang B et al. Regulation of vascular endothelial growth factor expression by acidosis in human cancer cells. Oncogene 2001;20:3751–3756. [DOI] [PubMed] [Google Scholar]
- Swietach P, Vaughan-Jones RD, Harris AL. Regulation of tumor pH and the role of carbonic anhydrase 9. Cancer Metastasis Rev 2007;26:299–310. [DOI] [PubMed] [Google Scholar]
- Xu L, Fidler IJ. Acidic pH-induced elevation in interleukin 8 expression by human ovarian carcinoma cells. Cancer Res 2000;60:4610–4616. [PubMed] [Google Scholar]
- Krishtal O. The ASICs: signaling molecules? Modulators? Trends Neurosci 2003;26:477–483. [DOI] [PubMed] [Google Scholar]
- Li MH, Leng T, Feng XC et al. Modulation of acid-sensing ion channel 1a by intracellular pH and its role in ischemic stroke. J Biol Chem 2016. [DOI] [PMC free article] [PubMed]
- Liu MG, Li HS, Li WG et al. Acid-sensing ion channel 1a contributes to hippocampal LTP inducibility through multiple mechanisms. Sci Rep 2016;6:23350. [DOI] [PMC free article] [PubMed] [Google Scholar]
- Wang YC, Li WZ, Wu Y et al. Acid-sensing ion channel 1a contributes to the effect of extracellular acidosis on NLRP1 inflammasome activation in cortical neurons. J Neuroinflammation 2015;12:246. [DOI] [PMC free article] [PubMed] [Google Scholar]
- Jin C, Yuan FL, Gu YL et al. Over-expression of ASIC1a promotes proliferation via activation of the beta-catenin/LEF-TCF axis and is associated with disease outcome in liver cancer. Oncotarget 2016. [DOI] [PMC free article] [PubMed]
- Jin C, Ye QH, Yuan FL et al. Involvement of acid-sensing ion channel 1alpha in hepatic carcinoma cell migration and invasion. Tumour Biol 2015;36:4309–4317. [DOI] [PubMed] [Google Scholar]
- Kapoor N, Bartoszewski R, Qadri YJ et al. Knockdown of ASIC1 and epithelial sodium channel subunits inhibits glioblastoma whole cell current and cell migration. J Biol Chem 2009;284:24526–24541. [DOI] [PMC free article] [PubMed] [Google Scholar]
- Gupta SC, Singh R, Asters M et al. Regulation of breast tumorigenesis through acid sensors. Oncogene 2016;35:4102–4111. [DOI] [PMC free article] [PubMed] [Google Scholar]
- Herrera Y, Katnik C, Rodriguez JD et al. Sigma-1 receptor modulation of acid-sensing ion channel a (ASIC1a) and ASIC1a-induced Ca2+ influx in rat cortical neurons. J Pharmacol Exp Ther 2008;327:491–502. [DOI] [PubMed] [Google Scholar]
- Xu TL, Duan B. Calcium-permeable acid-sensing ion channel in nociceptive plasticity: a new target for pain control. Prog Neurobiol 2009;87:171–180. [DOI] [PubMed] [Google Scholar]
- Friese MA, Craner MJ, Etzensperger R et al. Acid-sensing ion channel-1 contributes to axonal degeneration in autoimmune inflammation of the central nervous system. Nat Med 2007;13:1483–1489. [DOI] [PubMed] [Google Scholar]
- Wang YZ, Wang JJ, Huang Y et al. Tissue acidosis induces neuronal necroptosis via ASIC1a channel independent of its ionic conduction. Elife 2015;4:e05682. [DOI] [PMC free article] [PubMed] [Google Scholar]
- Yermolaieva O, Leonard AS, Schnizler MK et al. Extracellular acidosis increases neuronal cell calcium by activating acid-sensing ion channel 1a. Proc Natl Acad Sci USA 2004;101:6752–6757. [DOI] [PMC free article] [PubMed] [Google Scholar]
- Vanoverberghe K, Vanden Abeele F, Mariot P et al. Ca2+ homeostasis and apoptotic resistance of neuroendocrine-differentiated prostate cancer cells. Cell Death Differ 2004;11:321–330. [DOI] [PubMed] [Google Scholar]
- Tang J, Guo YS, Yu XL et al. CD147 reinforces [Ca2+]i oscillations and promotes oncogenic progression in hepatocellular carcinoma. Oncotarget 2015;6:34831–34845. [DOI] [PMC free article] [PubMed] [Google Scholar]
- Hao J, Bao X, Jin B et al. Ca2+ channel subunit alpha 1D promotes proliferation and migration of endometrial cancer cells mediated by 17beta-estradiol via the G protein-coupled estrogen receptor. FASEB J 2015;29:2883–2893. [DOI] [PubMed] [Google Scholar]
- Tian Y, Qin L, Qiu H et al. RPS3 regulates melanoma cell growth and apoptosis by targeting Cyto C/Ca2+/MICU1 dependent mitochondrial signaling. Oncotarget 2015;6:29614–29625. [DOI] [PMC free article] [PubMed] [Google Scholar]
- East DA, Campanella M. Ca2+ in quality control: an unresolved riddle critical to autophagy and mitophagy. Autophagy 2013;9:1710–1719. [DOI] [PubMed] [Google Scholar]
- Ishiuchi S, Yoshida Y, Sugawara K et al. Ca2+-permeable AMPA receptors regulate growth of human glioblastoma via Akt activation. J Neurosci 2007;27:7987–8001. [DOI] [PMC free article] [PubMed] [Google Scholar]
- Divolis G, Mavroeidi P, Mavrofrydi O et al. Differential effects of calcium on PI3K-Akt and HIF-1alpha survival pathways. Cell Biol Toxicol 2016;32:437–449. [DOI] [PubMed] [Google Scholar]
- Zheng F, Soellner D, Nunez J et al. The basal level of intracellular calcium gates the activation of phosphoinositide 3-kinase-Akt signaling by brain-derived neurotrophic factor in cortical neurons. J Neurochem 2008;106:1259–1274. [DOI] [PMC free article] [PubMed] [Google Scholar]
- Danciu TE, Adam RM, Naruse K et al. Calcium regulates the PI3K-Akt pathway in stretched osteoblasts. FEBS Lett 2003;536:193–197. [DOI] [PubMed] [Google Scholar]
- Wang R, Zhang Q, Peng X et al. Stellettin B induces G1 arrest, apoptosis and autophagy in human non-small cell lung cancer A549 cells via blocking PI3K/Akt/mTOR pathway. Sci Rep 2016;6:27071. [DOI] [PMC free article] [PubMed] [Google Scholar]
- Srinivas KP, Viji R, Dan VM et al. DEPTOR promotes survival of cervical squamous cell carcinoma cells and its silencing induces apoptosis through downregulating PI3K/AKT and by up-regulating p38 MAP kinase. Oncotarget 2016;7:24154–24171. [DOI] [PMC free article] [PubMed] [Google Scholar]
- van Bemmelen MX, Huser D, Gautschi I et al. The human acid-sensing ion channel ASIC1a: evidence for a homotetrameric assembly state at the cell surface. PLoS One 2015;10:e0135191. [DOI] [PMC free article] [PubMed] [Google Scholar]
- Zeng WZ, Liu DS, Duan B et al. Molecular mechanism of constitutive endocytosis of acid-sensing ion channel 1a and its protective function in acidosis-induced neuronal death. J Neurosci 2013;33:7066–7078. [DOI] [PMC free article] [PubMed] [Google Scholar]
- Chai S, Li M, Branigan D et al. Activation of acid-sensing ion channel 1a (ASIC1a) by surface trafficking. J Biol Chem 2010;285:13002–13011. [DOI] [PMC free article] [PubMed] [Google Scholar]
- Som A, Bloch S, Ippolito JE et al. Acidic extracellular pH of tumors induces octamer-binding transcription factor 4 expression in murine fibroblasts in vitro and in vivo. Sci Rep 2016;6:27803. [DOI] [PMC free article] [PubMed] [Google Scholar]
- Ge Y, Wu S, Xue Y et al. Preferential extension of short telomeres induced by low extracellular pH. Nucleic Acids Res 2016;44:8086–8096. [DOI] [PMC free article] [PubMed] [Google Scholar]
- Alfarouk KO. Tumor metabolism, cancer cell transporters, and microenvironmental resistance. J Enzyme Inhib Med Chem 2016;31:1–8. [DOI] [PubMed] [Google Scholar]
- Kharaishvili G, Simkova D, Bouchalova K et al. The role of cancer-associated fibroblasts, solid stress and other microenvironmental factors in tumor progression and therapy resistance. Cancer Cell Int 2014;14:41. [DOI] [PMC free article] [PubMed] [Google Scholar]
- Lin X, Zhang X, Wang Q et al. Perifosine downregulates MDR1 gene expression and reverses multidrug-resistant phenotype by inhibiting PI3K/Akt/NF-kappaB signaling pathway in a human breast cancer cell line. Neoplasma 2012;59:248–256. [DOI] [PubMed] [Google Scholar]
- Li L, Wei XH, Pan YP et al. LAPTM4B: a novel cancer-associated gene motivates multidrug resistance through efflux and activating PI3K/AKT signaling. Oncogene 2010;29:5785–5795. [DOI] [PubMed] [Google Scholar]
- Bao R, Lai CJ, Wang DG et al. Targeting heat shock protein 90 with CUDC-305 overcomes erlotinib resistance in non-small cell lung cancer. Mol Cancer Ther 2009;8:3296–3306. [DOI] [PubMed] [Google Scholar]
- Tazzari PL, Cappellini A, Ricci F et al. Multidrug resistance-associated protein 1 expression is under the control of the phosphoinositide 3 kinase/Akt signal transduction network in human acute myelogenous leukemia blasts. Leukemia 2007;21:427–438. [DOI] [PubMed] [Google Scholar]
- Abdul-Ghani R, Serra V, Gyorffy B et al. The PI3K inhibitor LY294002 blocks drug export from resistant colon carcinoma cells overexpressing MRP1. Oncogene 2006;25:1743–1752. [DOI] [PubMed] [Google Scholar]
- Barancik M, Bohacova V, Sedlak J et al. LY294,002, a specific inhibitor of PI3K/Akt kinase pathway, antagonizes P-glycoprotein-mediated multidrug resistance. Eur J Pharm Sci 2006;29:426–434. [DOI] [PubMed] [Google Scholar]
- Liang J, Ge F, Guo C et al. Inhibition of PI3K/Akt partially leads to the inhibition of PrP(C)-induced drug resistance in gastric cancer cells. FEBS J 2009;276:685–694. [DOI] [PubMed] [Google Scholar]


