

Abstract
Human age-related diseases, including obesity and type 2 diabetes (T2DM), have long been associated to mitochondrial dysfunction; however, the role for adipose tissue mitochondria in these conditions remains unknown. We have tackled the impact of aging and T2DM on adipocyte mitochondria from obese patients by quantitating not only the corresponding abundance changes of proteins, but also the redox alterations undergone by Cys residues thereof. For that, we have resorted to a high-throughput proteomic approach based on isobaric labeling, liquid chromatography and mass spectrometry. The alterations undergone by the mitochondrial proteome revealed aging- and T2DM-specific hallmarks. Thus, while a global decrease of oxidative phosphorylation (OXPHOS) subunits was found in aging, the diabetic patients exhibited a reduction of specific OXPHOS complexes as well as an up-regulation of the anti-oxidant response. Under both conditions, evidence is shown for the first time of a link between increased thiol protein oxidation and decreased protein abundance in adipose tissue mitochondria. This association was stronger in T2DM, where OXPHOS mitochondrial- vs. nuclear-encoded protein modules were found altered, suggesting impaired mitochondrial protein translocation and complex assembly. The marked down-regulation of OXPHOS oxidized proteins and the alteration of oxidized Cys residues related to protein import through the redox-active MIA (Mitochondrial Intermembrane space Assembly) pathway support that defects in protein translocation to the mitochondria may be an important underlying mechanism for mitochondrial dysfunction in T2DM and physiological aging. The present draft of redox targets together with the quantification of protein and oxidative changes may help to better understand the role of oxidative stress in both a physiological process like aging and a pathological condition like T2DM.
Abbreviations: 2D, Second-Dimension; ACN, acetonitrile; BMI, Body Mass Index; BN, Blue-Native; DAPs, Differentially Abundant Proteins; ETC, Electron Transport Chain; FDR, False Discovery Rate; GO, Gene Ontology; IAA, Iodoacetamide; IR, Insulin Resistance; iTRAQ, isobaric Tags for Relative and Absolute Quantification; LC-MS, Liquid-Chromatography coupled to Mass Spectrometry; MCX, Mixed-mode Cationic eXchange; MIA, Mitochondrial Intermembrane space Assembly; mtDNA, mitochondrial DNA; oxCys, oxidized Cys; OXPHOS, Oxidative Phosphorylation; RIPA, RadioImmunoPrecipitation Assay buffer; ROS, Reactive Oxygen Species; SD, Standard Deviation; SVF, Stromal-Vascular Fraction; T2DM, Type 2 Diabetes Mellitus; TCA, TriCarboxilic Acid cycle; TEAB, TriEthylAmmoniumBicarbonate; TFA, TriFluoroacetic Acid; VAT, Visceral Adipose Tissue; WB, Western-Blot; Zc, standardized log2 ratio at the Category level; Zp, standardized log2 ratio at the Peptide level; Zq, standardized log2 ratio at the Protein level
Keywords: Adipose tissue, Mitochondria, OXPHOS, Redox proteomics, Thiol oxidation, Type 2 diabetes
Graphical abstract

Highlights
-
•
First high-throughput redox proteomic analysis of human adipocyte mitochondria.
-
•
Thiol protein oxidation is inversely correlated to protein levels in adipocyte mitochondria.
-
•
OXPHOS Mitochondrial- vs. nuclear-encoded protein modules are altered in T2DM.
-
•
Redox proteomics highlights defects in protein import through the MIA pathway in aging and T2DM.
-
•
Complex IV emerges as a common target of oxidative modifications connecting aging and T2DM.
1. Introduction
The mitochondrion harbors crucial cellular processes including ATP supply, metabolites generation for cytosolic processes, amino acid catabolism, ketogenesis and urea cycle, ion homeostasis, calcium cycling, oxygen sensing and other cell signaling pathways such as autophagy/mitophagy and apoptosis [1], and therefore it is considered a central integrator of the homeostatic signals in the organism [2]. Additionally, mitochondria enclose main cellular generators of reactive oxygen species (ROS), such as the components of the respiratory chain, a number of redox enzymes and potent anti-oxidative defense systems [1], [3] which make this organelle a key player in cellular redox homeostasis.
Obesity and obesity-associated pathologies have long been related to mitochondrial dysfunction [4]. Obesity is the most prevalent metabolic disease worldwide and is caused by an augmentation of the body fat due to a disproportion between energy uptake and expenditure [5]. White adipose tissue, the main adiposity regulator, is not merely a fat reservoir, but also a complex, essential endocrine organ [6]. Detrimental accumulation of the major intra-abdominal fat depot, the visceral adipose tissue (VAT), significantly increases the risk for metabolic comorbidities, like insulin resistance (IR) and type 2 diabetes mellitus (T2DM) [7].
Obesity-driven IR clinical manifestations initiate when insulin target cells, such as adipocytes, inadequately respond to insulin, and over time T2DM pathology emerges [8]. Some of the key factors contributing to IR are: i) excessive nutrient supply to adipocytes, which leads to ROS production; ii) pro-inflammatory processes; iii) endoplasmic reticulum stress; iv) cell aging; and v) altered mitochondrial dynamics (such as fusion and fission events) [9], [10], [11]. Thus, mitochondrion is both the origin and target of multiple metabolic signals whose integration maintains insulin sensitivity. Importantly, it has been suggested that mitochondrial redox signaling has a key role in white adipose tissue, regulating different processes such as adipocyte differentiation or adiponectin secretion through the modulation of redox-sensitive transcriptional factors [12], [13]. Not surprisingly, given that white adipose tissue is the greatest endocrine organ in the human body any alteration in adipocyte mitochondria could result in significant homeostatic disturbances.
Although most mitochondrial functions are ubiquitous to all tissues, tissue-specific functions and tissue-specific control of mitochondrial capacity have been extensively reported [14]. Despite that adipose tissue in involved in regulating energy expenditure and insulin signaling [15], there is limited understanding of the relevance of mitochondria in this organ, mainly due to the scarcity of this organelle in white adipocytes [16].
We have linked obesity to the down-regulation of mitochondrial functions [17]. In this work we have extended our previous results, exploring the adipocyte mitochondrial proteome to further investigate, in obesity, the influence of a physiological process, aging, and a pathological process, T2DM. For that, we have relied on a high-throughput multiplexed proteomic approach with isobaric labeling followed by liquid chromatography coupled to mass spectrometry (LC-MS) analysis, which allows the simultaneous identification and quantification of proteins. It is noteworthy that very few proteomic studies based on human mitochondria have been reported [18], [19], [20], [21]. Using visceral adipocytes, Lindinger et al. [20] identified 62 mitochondrial proteins associated with obesity. Similarly to our study, the authors resorted to MS for protein identification, although the quantification relied on immunoblot analysis.
Since oxidation and reduction of thiol proteins are one of the major mechanisms by which reactive oxidants integrate into cellular signal pathways [22], a number of proteomic technologies have been recently developed for the enrichment, identification, and characterization of thiol-based redox modifications, what is known as redox proteomics [23], [24]. Cys is considered the most important redox-responsive amino acid due to its chemical properties and the range of its different oxidation states, together with its involvement in highly conserved functional positions in proteins. Additionally, due to their relevance and specificity, reversible Cys modifications have been suggested to play a main role in the regulation of protein activity and signal transduction [25], [26]. In spite of their enormous potential, the function of oxidative modifications under physiological and pathophysiological conditions remains largely unknown. For these reasons, in this work we have further coupled our proteomic analysis with the study of dynamic alterations of oxidized Cys residues (oxCys) using a GELSILOX-based method [27].
Here, the application of state-of-the-art redox proteomics approaches to obese adipose tissue has uncovered a significant increase of Cys oxidation levels in oxidative phosphorylation (OXPHOS) subunits and, remarkably, an inverse correlation between Cys oxidation levels and protein abundance in both aging and T2DM conditions. Our results suggest impaired assembly of mitochondrial complexes together with defective import of nuclear-encoded proteins to the mitochondrion in diabetic patients. As far as we know, this work constitutes the most comprehensive depiction of the human mitochondrial proteome to date, as well as the first assessment of redox changes in adipocyte mitochondria.
2. Material and methods
2.1. Ethic statement
The study was conducted according to the recommendations of the Declaration of Helsinki and was approved by the Ethics Committees of Hospital Clínico San Carlos and Hospital Gregorio Marañón (Madrid, Spain). Signed informed consent was obtained from all subjects.
2.2. Biological samples
VAT samples were collected from 32 obese women (Body Mass Index, BMI≥40 kg/m2) who underwent bariatric surgery. All the patients were of Caucasian origin. The surgeon aimed to obtain the samples at the beginning of the surgery and from the same anatomical location (omentum) in all patients. None of the non-diabetic patients suffered T2DM or other obesity-associated comorbidity (hypertension, dyslipidemia, obstructive sleep apnea syndrome or cardiovascular disease). Inclusion criterion for the diabetic group was suffering T2DM for at least two years. T2DM was defined by fasting plasma glucose >7 mmol/L and HbA1c >6.5%. All T2DM subjects were being treated with oral anti-diabetic drugs and in one case with insulin in order to control the comorbidities. Exclusion criteria encompassed: i) clinically significant hepatic, neurological, or other major systemic disease, including malignancy; ii) history of drug or alcohol abuse, defined as >80 g/day, or serum transaminase activity more than twice the upper normal range limit; iii) elevated serum creatinine concentrations; iv) acute illnesses and current evidence of chronic inflammatory or infectious diseases; and v) mental illness rendering the subjects unable to understand the scope of the analysis.
2.3. Separation protocol
After sample collection, fresh VAT was suspended in Hank's Balanced Medium 199 (Cat. 22350, GIBCO®-Life Technologies) and immediately processed for adipocytes and stromal-vascular fraction (SVF) separation according to standard procedures. Briefly, 6g of adipose tissue were washed three times with PBS and minced until 1–2 mm3 pieces were obtained. Digestion was carried out in 0.2% Collagenase type I (M0A3689, Worthington Biochemical Corp.) solution in PBS for 60 min in water bath at 37 °C. The enzyme was inactivated with fetal bovine serum (FBS) and the suspension was centrifuged at 1,000 rpm for 10 min. Three different phases could be recognized: the upper phase with the adipocytes; the middle phase with the digestion solution, and a red pellet which constitutes the SVF. Adipocytes were collected and suspended in PBS for filtering through a 500 µm steel mesh. Three washing steps were performed for adipocytes at 800 rpm for 3 min to remove SVF particles. Different volumes of adipocytes (250 μL up to 1 mL) were separated and stored at −80 °C for subsequent analyses.
2.4. Preparation of mitochondrial protein extracts and tryptic digestion
For proteome profiling, mitochondrial enrichment was carried out with the Mitochondria Isolation Kit (Cat. 130-094-532, Miltenyi Biotec.) adapting the manufacturer's instructions to our sample. Frozen adipocytes (1 mL) were thawed and suspended in the Lysis Buffer provided by the kit, supplemented with a protease inhibitor cocktail (Halt Protease Inhibitor Cocktail, Thermo Scientific) and homogenized on ice for 15 min with a douncer homogenizer using 25 strokes (pestle type B). After homogenization, the adipocyte sample was suspended in the Separation Buffer provided by the kit and magnetically labeled with human anti-TOM22 microbeads. After the application of a magnetic field, the retained mitochondria were eluted and centrifuged at 16,000 rpm during 2 min. The mitochondria-enriched pellets were dried and frozen at −80 °C until protein extraction. Mitochondrial isolation was verified by electron microscopy (Supplementary Fig. 1). The mitochondrial pellets were treated with radioimmunoprecipitation assay buffer (RIPA) (25 mM Tris-HCl pH 7.6, 150 mM NaCl, 1% NP-40, 1% sodium deoxycholate, 0.1% SDS) supplemented with 50 mM iodoacetamide (IAA). Sample pooling (n=4 per group) was performed prior to digestion. Protein concentration was measured by the Pierce BCA Protein Assay (Life Technologies, Thermo Scientific). All samples were assayed in triplicate with less than 1% variation. For each pool, a total of 60 µg of proteins were digested with trypsin following a GELSILOX-based approach [27]. Experimental proteomic procedures are summarized in Supplementary Fig. 2.
2.5. iTRAQ labeling and peptide fractionation
For iTRAQ (isobaric Tags for Relative and Absolute Quantification) labeling, the dried peptides were taken up in 30 μL of 0.5 M triethylammoniumbicarbonate (TEAB) buffer and labeled with the corresponding iTRAQ reagent in 70% (v/v) ethanol for 1 h at room temperature. Then, 100 μL of 0.5% (v/v) trifluoroacetic acid (TFA) was added to stop the labeling reaction. The peptide samples were mixed, vacuum concentrated and diluted in 200 μL of 1% (v/v) TFA for desalting on Oasis HLB C18 cartridges (Waters). One-fourth of the tagged peptides were directly analyzed by LC-MS, and the remaining three-fourths were subject to mixed-mode cationic exchange (MCX) fractionation. The iTRAQ-labeled peptides were suspended in 5 mM ammonium formate with 25% (v/v) acetonitrile (ACN), pH 3.0, and separated into 5 fractions using MCX Oasis cartridges (Waters). The so-obtained peptide fractions were desalted using MicroSpin Columns C18 (The Next Group), vacuum-dried and kept at 4 °C for later LC-MS analysis.
2.6. LC-MS analyses and protein identification
High-resolution LC-MS analysis of iTRAQ-labeled peptides was carried out on an Easy nLC 1000 nano-HPLC apparatus (Thermo Scientific) coupled to an Orbitrap Fusion tribrid mass spectrometer (Thermo Scientific). Peptides were suspended in 0.1% formic acid and then loaded onto an PepMap100 C18 LC pre-column (75 µm I.D., 2 cm, Thermo Scientific) and eluted on line onto an analytical NanoViper PepMap™ 100 C18 LC column (75 µm I.D., 50 cm, Thermo Scientific) with a continuous gradient consisting of 8–31% B in 240 min (B=90% ACN, 0.1% formic acid) at 200 nL/min. Peptides were ionized using a Picotip emitter nanospray needle (New Objective). Each MS run consisted of enhanced FT-resolution spectra (120,000 resolution) in the 390–1,200 m/z range followed by data-dependent MS/MS spectra of the 20 most intense parent ions acquired along the chromatographic run. The AGC target value for the survey scan was set to 106. Fragmentation in the Orbitrap was performed at 33% normalized collision energy with a target value of 10,000 ions. The full target was set to 30,000, with 1 microscan and 100 ms injection time, and the dynamic exclusion was set to 0.5 min. A total of 5 MS data sets, two from unfractionated material and three from the corresponding MCX fractions, were registered with 25 h total acquisition time. For peptide identification the MS/MS spectra were searched with the SEQUEST HT algorithm implemented in Proteome Discoverer 1.4.0.29 (Thermo Scientific). Database searching against human protein sequences from the UniProt database (September 2014, 147,615 entries) was performed with the following parameters: trypsin digestion with 2 maximum missed cleavage sites; precursor and fragment mass tolerances of 2 Da and 0.02 Da, respectively; carbamidomethyl and methylthio Cys and Met oxidation as dynamic modifications; and N-terminal and Lys iTRAQ modifications as fixed modifications. The results were analyzed using the probability ratio method [28] and the FDR (False Discovery Rate) for peptide identification was calculated based on the search results against a decoy database using the refined method [29].
2.7. Western-Blot analyses
A second cohort of patients (n=20) was independently considered for orthogonal validation analyses. Mitochondria were obtained from mature frozen adipocytes using the Mitochondria Isolation Kit (Cat. ab110171, Abcam), according to the manufacturer's instructions. Concentration of mitochondrial suspension was determined by Pierce BCA Protein Assay. Ten μg of protein extracts were loaded, resolved on SDS-PAGE and transferred to Hybond ECL nitrocellulose membranes which were stained with 0.15% Ponceau red to ensure proper transfer and then blocked with 5% (w/v) BSA in TBS buffer with 0.1% Tween 20. The primary antibodies used for protein validation were 1:2000 rabbit anti-SOD2 (ADI-SOD-111, Enzo Life Sciences); 1:5000 rabbit anti-CS (C5498, Sigma-Aldrich); 1:2000 mouse anti-COX5B (sc-374417, Santa Cruz Biotechnology); 1:2000 mouse anti-VDAC1 (ab14734), 1:1000 rabbit anti-TFAM (ab47517), 1:1000 mouse anti-NDUFA9 (ab14713), 1:1000 rabbit anti-SDHC (ab155999) and 1:1000 mouse Total OXPHOS Human WB Antibody Cocktail (ab11041) including anti-UQCRC2 (ab14745), anti-MTCO2 (ab110258) and anti-ATP5A1 (ab14748) (Abcam). Blots were incubated with the appropriate IgG-HRP-conjugated secondary antibodies. The immunoreactive bands were visualized with Amersham ECL Western Blotting Detection Reagent (GE Healthcare). Blots were exposed for different times. Exposures in the linear range of signal were selected for densitometric evaluation with Image J analysis software. Additionally, infrared-labeled secondary antibodies were also used (Li-Cor Biosciences). The bands were detected using the Odyssey Infrared Imaging System (Li-Cor Biosciences), and the images were analyzed with Odyssey Application Software.
2.8. Mitochondrial activity assays
Mitochondria were obtained using the Mitochondria Isolation Kit (Abcam). Complex IV activity was measured using a microplate assay kit (Cat. ab109909, Abcam). Briefly, mitochondria were mildly digested and complex IV was immunocaptured within the wells. Bovine Heart Mitochondria (ab110338, Abcam) was used as a positive control. As negative control, the experiment was performed in the absence of substrate (reduced cytochrome C). All samples were assayed in triplicate. Activity was determined by measuring the changes in absorbance at 550 nm due to the oxidation of reduced cytochrome C.
2.9. Blue native electrophoresis
To prepare native mitochondrial proteins, pellets were solubilized in 30–100 μL buffer containing 1.5 M aminocaproic acid, 50 mM Bis-Tris, pH 7.0. Mitochondria were extracted with a digitonin:protein ratio of 4g/g. Solubilized samples were incubated on ice for 20 min and centrifuged for 30 min at 13,000 rpm at 4 °C . Then the supernatant was suspended in 750 mM aminocaproic acid, 50 mM Bis-Tris, 0.5 mM EDTA and 5% Serva Blue G-250 prior to loading. Thirty μg of protein were loaded in Native PAGE™ Novex® 3–12% Bis-Tris Protein Gels (Invitrogen). Duplicate gels were used for second-dimension (2D) 10% SDS-PAGE gels. Proteins were transferred at 1.3A constant for 10 min and probed with 1:1000 mouse anti-COX5A (ab110262), 1:1000 mouse anti-NDUFA9 (ab14713) and 1:2000 mouse anti-VDAC1 (ab14734) (Abcam). Blots were incubated with the appropriate IgG-HRP-conjugated secondary antibodies. The immunoreactive bands were visualized with Cheluminate-HRP PicoDetect Kit for Western Blotting (Panreac AppliChem).
2.10. Statistical analyses
Descriptive results of continuous variables are expressed as mean±standard deviation (SD). Statistical analyses were performed using the Statistical Package for Social Science software (v. 22, SPSS, Inc). One-way ANOVA (using Bonferroni's post hoc test) was used to compare the anthropometrical and clinical data from the patients. The relation between variables was evaluated by Pearson's Correlation Coefficient. Unpaired Student's t-test was used for direct comparisons between two groups of samples. Statistical significance was set at p<0.05 in all cases. A 1% peptide FDR threshold was considered. Peptide and protein abundance changes were assessed using the iTRAQ reporter ion intensities retrieved from MS/MS scans by QuiXoT software [30], [31] as inputs to the WSPP model [32]. This model circumvents the statistical issues reported for protein quantitation from iTRAQ-labeled peptides [33] and, by decomposing the different variance components, takes into account variance non-homogeneity and the highly unbalanced structure of this kind of data [32]. The model also provides a robust framework for the full integration of quantitative and error information from a given level to a superior level (e.g. peptide to protein); thus, the standardized variable, Zq, is defined as the mean-corrected log2 ratio expressed in units of standard deviation at the protein level. For the quantitation of Cys oxidation, oxCys peptide abundance was evaluated by the corresponding standardized log2ratio, Zp, therefore avoiding biased calculations due to changes in the abundance of the proteins from which these peptides originated [27]. The threshold for differential protein and peptide abundance was set at |Zq|≥2 and |Zp|≥2, respectively. For the analysis of coordinated protein responses [34] a standardized log2 ratio, Zc, was calculated for each functional protein category. Categories with at least 5 protein components and FDR<0.05 were considered significantly differential and were subjected to cluster analysis.
2.11. Annotation databases and electronic resources
The database used for ontological protein classification contained ca. 2.3·106 functional categories with relevance to adipose tissue and obesity. These categories were retrieved from the DAVID database (https://david.ncifcrf.gov/) [35] including information from KEGG, PANTHER and GO_FAT annotations. Mitochondrial protein terms were obtained from both the GO Mitochondrion annotation (GO:0005739, http://www.geneontology.org/) and Human MitoCarta v2.0 [36]. Enrichment analyses were performed using DAVID software [37].
3. Results & discussion
3.1. Mitochondrial proteome of human adipocytes
Our recent findings unveiled different patterns of mitochondrial remodeling in the aging and T2DM processes when studying whole adipose tissue in obese patients [38]. To further define the hallmarks of aging and T2DM in obese adipocyte mitochondria, we have resorted to a high-throughput proteomic procedure based on peptide iTRAQ labeling and LC-MS analysis (Supplementary Fig. 2). Mitochondrial samples were obtained from adipocytes previously isolated from VAT biopsies from 32 obese subjects (Fig. 1A). For proteome profiling, a subgroup of 12 obese women was selected according to the most homogeneous clinical features, and split in three different groups: diabetic over 45 years (n=4); non-diabetic over 45 years (n=4) and non-diabetic under 35 years (n=4) (Fig. 1B, Table 1). This facilitated two differential proteomic studies in a single experiment: diabetic vs. non-diabetic women over 45 years (T2DM differences), and older (mean age 50 years) vs. younger (mean age 32 years) non-diabetic women (age differences). For orthogonal validation analyses, a second cohort of patients (n=20) was independently considered.
Fig. 1.

The human adipocyte mitochondrial proteome. (A) Representative images showing critical steps during sample preparation. Fresh VAT samples were obtained from obese patients (BMI ≥40) and processed to separate adipocyte and SVF components. Mitochondria-enriched pellets were obtained from mature adipocytes and proteins were extracted from each individual sample. (B) Selection of obese patients and comparative proteomic studies. Three clinical groups (n=4 each) were constituted as follows: diabetic women over 45 years, non-diabetic women over 45, and non-diabetic women under 35 years. Proteins from each individual sample were pooled into their corresponding group and digested. The peptide pools were tagged with iTRAQ labels (indicated with different colors) and mixed accordingly to achieve two differential expression studies: T2DM differences in obese women (114 vs. 116) and age differences in non-diabetic obese women (116 vs. 117). (C) Protein identification refinement workflow. After matching the measured MS/MS spectra against the whole human UniProt database most of the proteins reliably identified were filtered out as no evidence for their mitochondrial origin was found. This led to the final set of 706 bona fide mitochondrial proteins finally considered for the quantitative proteomic analysis of mitochondria-enriched samples. (D) Relative distribution of bona fide mitochondrial proteins across major organelle compartments.
Table 1.
Clinical characteristics of obese patients considered for mitochondrial proteome profiling. Clinical variables are expressed as mean±SD. One-way ANOVA was used to compare clinical variables. Significance was set at p<0.05.
| Non-diabetic women under 35 years (n=4) | Non-diabetic women over 45 years (n=4) | Diabetic women over 45 years (n=4) | p | |
|---|---|---|---|---|
| Age (years) | 32±4 | 51±5* | 50±6* | 0.00 |
| Body Mass Index, BMI (kg/m2) | 43.65±3.37 | 44.75±6.85 | 46.63±6.05 | 0.76 |
| Waist circumference (cm) | 117.25±8.77 | 120.50±8.23 | 127.25±2.99 | 0.19 |
| Fasting glucose (mmol/L) | 5.29±0.27 | 5.64±0.63 | 8.78±4.12 | 0.13 |
| HbA1c (%) | 5.55±0.24 | 5.60±0.14 | 7.50±2.00 | 0.07 |
| Fasting triglycerides (mmol/L) | 1.31±0.32 | 1.65±0.53 | 2.08±1.18 | 0.40 |
| Total cholesterol (mmol/L) | 4.95±0.67 | 5.28±0.52 | 4.46±1.46 | 0.52 |
| cLDL (mmol/L) | 2.91±0.30 | 3.11±0.43 | 2.31±1.01 | 0.26 |
| cHDL (mmol/L) | 1.44±0.38 | 1.40±0.15 | 1.20±0.14 | 0.37 |
p<0.01, significant differences as compared to non-diabetic obese women under 35 years by Bonferroni's post hoc test.
LC-MS analysis allowed the identification of 27,578 unique peptides at 1% FDR, corresponding to 3,542 proteins codified by 3,306 human genes (Supplementary Table 1). Of note, 841 out of 1,158 proteins currently annotated in Human MitoCarta [36], [39] were identified (Fig. 1C), covering 88% of the adipose tissue-specific proteins detected in mouse [36]. Co-isolated non-mitochondrial proteins were excluded from statistical analysis based on GO mitochondrion annotation (GO:0005739) and the Human MitoCarta database. Furthermore, since protein functional categories often result from non-experimental annotations [40], several additional proteins were filtered out based on their canonical functions and other sources of evidence such as The Human Protein Atlas [41]. Thus, 706 bona fide mitochondrial proteins were finally subjected to quantitative statistical analysis. The distribution of protein content across the main organelle compartments revealed a consistent and reliable mitochondrial proteome, as expected [42] (Fig. 1D). Worth mentioning, 12 out of the 13 mitochondrial DNA (mtDNA)-encoded proteins were successfully detected (Supplementary Table 1). To our knowledge, our study has unveiled the largest number of mitochondrial proteins from a human sample, despite the stringent criteria applied to peptide identification (1% FDR), together with the carefully selected and manually curated functional database annotations considered.
3.2. Quantitative proteomic analysis in aging and T2DM
LC-MS data obtained from the mitochondrial adipocyte samples were subjected to comprehensive statistical analysis using the WSPP model [32]. Proteins with |Zq|≥2 (corresponding to p<0.05) were considered differentially abundant proteins (DAPs) in each comparison. Out of the 706 bona fide mitochondrial proteins considered, a total of 63 and 62 DAPs were identified in the age and T2DM assessments, respectively (Supplementary Table 2). The occurrence of shared features between aging and T2DM explains that 37% of DAPs were found common to the two comparisons. Thus, cytochrome c oxidase subunit 6B1 (COX6B1), a key player in cytochrome c oxidase activity [43], [44], was found down-regulated in the age (Zq=−2.75) and T2DM (Zq=−5.06) comparisons.
Since cellular processes are accomplished by proteins working together in complexes or functional pathways, we have also resorted to a systems biology model [45] to assess whether the protein abundance changes took place in a coordinated manner, a biological event that is well-known [46]. These analyses revealed that global OXPHOS down-regulation is a key hallmark of age progression in adipocyte mitochondria (Fig. 2 A, Supplementary Table 3). These results were confirmed by Western Blot (WB) in an independent set of mitochondria samples using selected OXPHOS markers (Supplementary Fig. 3A). Additionally, the up-regulation of Vitamin D metabolism was also found associated with aging. In the T2DM comparison, protein-coordination analyses highlighted an up-regulation of Response to oxygen levels process, among other protein functional categories (Fig. 2B, Supplementary Table 3). The Response to oxygen levels is illustrated by a significant increase of relevant components of the cellular antioxidant machinery like mitochondrial thioredoxin (TXN2) or mitochondrial superoxide dismutase (SOD2), which were found up-regulated in the T2DM assessment (Zq=4.02 and Zq=4.45, respectively). SOD2 is a key scavenging enzyme that converts superoxide to hydrogen peroxide and molecular oxygen in the mitochondrial matrix. SOD2 levels were also found increased in diabetic compared to non-diabetic patients by WB, using a second cohort of patients (Supplementary Fig. 3B), in agreement with earlier studies [47], [48]. To further illustrate the above-described degree of coordinated behavior in aging and T2DM comparisons, the cumulative frequency distribution of protein changes (Zq) was plotted for the least redundant categories within the aging and T2DM clusters (Fig. 2C, D). Altogether, the coordinated responses highlight that the proteome alterations follow well-differentiated patterns of adipocyte mitochondrial dysfunction in both conditions, supporting our previous studies based on whole VAT [38].
Fig. 2.

Coordinated protein responses in adipocyte mitochondria in aging and T2DM. (A-B) Protein functional categories differentially modulated in the age (A) and T2DM (B) comparisons. A color scale was used to represent the overlapping frequency of protein terms among categories that were up- (yellow) or down-regulated (purple). Category terms and clusters are fully described in Supplementary Table 3. (C-D) Coordinated protein regulation in the age (C) and T2DM (D) comparisons. The cumulative frequency of changes (Zq values) for the least redundant category in each of the clusters is represented together with the theoretical curve, showing a normal distribution of data, as well as the experimental curve, representing Zq for the whole set of proteins quantified in this study (n=706). An up- or down-wards shift from the theoretical curve means a coordinated up- or down-regulation, respectively. (For interpretation of the references to color in this figure legend, the reader is referred to the web version of this article).
3.3. Regulation of mitochondrial complexes
Mitochondrial ATP is produced by the OXPHOS machinery coupling two set of reactions: first, the electron transfer of reducing equivalents to molecular oxygen through an exclusive assemblage of protein complexes, the electron transport chain (ETC); and second, the ADP phosphorylation through ATP synthase thanks to the proton-motive force previously generated. OXPHOS subunits have dual genetic origin, nuclear and mitochondrial, with the exception of complex II subunits that are exclusively nuclear-encoded. Our study has successfully identified the majority of protein components of mitochondrial complexes (Fig. 3, Fig. 4): 49 structural and assembly factors for NADH:ubiquinone oxidoreductase (complex I); 3 for succinate oxidoreductase (complex II); 11 for ubiquinol-cytochrome c reductase (complex III); 23 for cytochrome c oxidase (complex IV) and 20 ATP synthase subunits and related proteins (also referred as complex V). This work represents the largest number of OXPHOS proteins identified in human fat cells to date. This has enabled us to pinpoint quantitative protein changes in each of the OXPHOS complexes in both the aging and T2DM assessments.
Fig. 3.

ETC mitochondrial complexes, OXPHOS subunits and related proteins in aging. (A) Heat-map representing protein abundance changes within the mitochondrial complexes. For each protein gene symbols are displayed together with the corresponding Zq (standardized log2 ratio) values in a color scale (yellow means up-regulated and purple down-regulated). Color proportion resembles the global regulation tendency in the complex. Sigmoidal curves representing the cumulative frequency of changes for each mitochondrial complex are shown in Supplementary Fig. 4A. (B-C) Protein changes within mitochondrial complex I and IV naïve structures. (B) Schematic representation of mitochondrial complex I subunits along its structure modules: the membrane proton pumping arm (P module) and the matrix arm composed by the electron transferring element (Q module) and the NADH binding and oxidizing part (N module). (C) Schematic representation of monomeric cytochrome c oxidase (complex IV). Some cytochrome c oxidase subunits are not represented due to lack of information. Boxes are colored according to the relative protein abundance change in each comparison. Three-dimensional colored structures emphasize the global behavior of modules. Proteins containing oxCys residues are in red color. Assembly factors are not represented. Further information about specific Zq values can be found in Supplementary Table 2. (For interpretation of the references to color in this figure legend, the reader is referred to the web version of this article).
Fig. 4.

ETC mitochondrial complexes, OXPHOS subunits and related proteins in T2DM. (A) Heat-map representing protein abundance changes within the mitochondrial complexes. For each protein gene symbols are displayed together with the corresponding Zq (standardized log2 ratio) values in a color scale (yellow means up-regulated and purple down-regulated). Sigmoidal curves representing the cumulative frequency of changes for each mitochondrial complex are shown in Supplementary Fig. 4B. (B-C) Protein changes within mitochondrial complex I and IV naïve structures. (B) Schematic representation of mitochondrial complex I subunits along its structure modules as described in Fig. 3B. (C) Schematic representation of complex IV as described in Fig. 3C. Boxes are colored according to the relative protein abundance change in each comparison. Three-dimensional colored structures emphasize the global behavior of modules. Proteins containing oxCys residues are in red color. Assembly factors are not represented. Further information about specific Zq values can be found in Supplementary Table 2. (For interpretation of the references to color in this figure legend, the reader is referred to the web version of this article).
Although, as described above, the proteins belonging to Oxidative phosphorylation function were coordinately down-regulated in the aging comparison (Fig. 2C), the individual analysis of each mitochondrial complex demonstrated that complex I, II, III and IV were indeed significantly reduced, whilst ATP synthase was not regulated (Fig. 3A, Supplementary Fig. 4A). Protein changes in two of the most well-known ETC complexes, I and IV, were studied in detail (Fig. 3B, C). Complex I is the largest enzyme complex of the respiratory chain encompassing 45 different subunits and requiring at least 13 specific assembly factors, and its activity facilitates the main entry of reducing power (through NADH) into the oxidative machinery [49], [50]. Its L-shaped structure is made up of a peripheral arm containing two functional blocks, the N (NADH binding) and the Q (ubiquinone binding) modules, and a membrane arm consisting of the P (proton pumping) element [51]. Complex IV is the terminal oxidase set of ETC enzymes, where the electrons are transported by four redox-active centers to molecular oxygen [52]. Complex IV relies on a dimeric structure where the three core components (MT-CO1, MT-CO2 and MT-CO3), translated within the organelle, must be assembled with the rest of nuclear-encoded components to reach an active form [53]. The schematic representation of protein abundance along complex I and IV structures, according to up-to-date information [49], [50], [53], [54], clearly evidenced the down-regulation of most of the protein components of these complexes as obese patients age (Fig. 3B, C). Interestingly, this effect is more pronounced in the N module of complex I, involved in NADH binding (Fig. 3B), as well as in the two core proteins (MT-CO1 and MT-CO2) and two peripherally localized subunits (COX6B1 and COX6C) of complex IV (Fig. 3C). Since the decreased level of these proteins could contribute not only to the instability of both complex structures but also to their activity decline, our data could suggest an impairment of the electron flux within the mitochondrial ETC in the adipocytes from older compared to younger obese subjects.
On the other hand, our results have shown a strong down-regulation of mtDNA-encoded proteins associated with aging progression (Supplementary Fig. 5A). Notably, the mitochondrial transcription factor A (TFAM), the main player in the regulation of mtDNA copy number [55], and involved in mtDNA stability, replication and transcription [56], was also found significantly diminished in older compared to younger obese patients (Zq=−3.05). These results were confirmed by WB analyses (Supplementary Fig. 3A). The involvement of TFAM in aging is tissue-specific [57] and has been mainly investigated in several rodent tissues. Remarkably, an aged-related decrease in TFAM amount in muscle and liver tissues of rats has been reported [57], [58], further validating our results. Noteworthy, we previously described nuclear-encoded mitochondrial protein reduction in whole VAT biopsies with aging [38]. Altogether, our data support the decrease of ETC complexes with aging progression in adipocyte mitochondria.
In the T2DM study, the detailed analysis of individual mitochondrial complexes revealed a normal distribution for complex I, whilst complex III, IV and V were slightly decreased (Fig. 4A, Supplementary Fig. 4B). Earlier studies in subcutaneous adipose tissue also reported the down-regulation of mitochondrial complex III, IV and V in obesity-associated IR [59], in agreement with our results. Protein changes in the different complex I modules are illustrated in the schematic representation shown in Fig. 4B. Results highlighted a distinctive protein expression pattern depending on the complex modules. Thus, the P module was found up-regulated while the Q and N modules were mostly down-regulated. Moreover, a pronounced increase of succinate dehydrogenase cytochrome b560 protein (SDHC) was uncovered. SDHC is the membrane-anchoring subunit C of complex II in charge of transferring electrons from succinate to ubiquinone, and also participates in the tricarboxylic acid cycle (TCA). On the other hand, complex II is the minor site of entry of reducing equivalents into the ETC (from FADH2). Our data suggest that complex II increase could be a compensatory response for the reduction of the oxidative capacity in diabetic compared to non-diabetic patients, due to the down-regulation of complex III, IV and V. In consonance with our results, complex II increased activity together with complex I, III and IV deficiencies, have been reported in the adipose tissue from a mouse model [60]. These authors also reported an enhancement of citrate synthase (CS) activity. Similarly, our results revealed that CS, a key enzyme of TCA, was up-regulated in the T2DM comparison (Zq=3.28; Supplementary Fig. 3B, Supplementary Table 2), suggesting a metabolic shift favoring succinate (complex II)-driven respiration in the adipose tissue of our diabetic patients.
Noteworthy, and in contrast with the results found in the age comparison, the mtDNA-encoded proteins were mostly found up-regulated in T2DM (Supplementary Fig. 5B). This may be accounted for by the alteration of mtDNA-encoded protein translation [61] and/or underline the impairment of complex assembly owing to abnormal accumulation of specific modules. Our hypothesis about defective complex assembly is in agreement with the protein changes observed for complex I and IV structures, where clear differences between modules are observed in the relative abundance of nuclear vs. mtDNA-encoded proteins (Fig. 4B, C). Thus, the P module from complex I, which contains the highest number of mtDNA-encoded proteins, is up-regulated while the N module, which is exclusively made up of nuclear-encoded subunits, was found down-regulated (Fig. 4B). Likewise, in complex IV data revealed differences in the relative abundance between mtDNA (core module) and nuclear-encoded proteins (Fig. 4C). Of note, both the P module in complex I and the core module in complex IV are gathered in the first steps of the complex assembly process [49], [53], strengthening our premise about defects in the accumulation of specific modules during complex assembly. This defective accumulation of mtDNA-encoded protein modules may be due, in part, to an impaired translocation of nuclear-encoded subunits to the mitochondrion in diabetic compared to non-diabetic subjects that would consequently lead to deficient complex assembly. Nuclear-encoded proteins are synthesized in the cytosol and transported to the mitochondrion mainly via chaperones like heat shock protein 70 (HSP70), and into the mitochondrion via mitochondrial membrane transporters (mostly TOM and TIM complexes) [62], [63]. Interestingly, we have previously reported significantly lower levels of HSP70 in diabetic compared to non-diabetic patients [17], and in the present study we have found a down-regulation of several TOMM proteins, like TOMM70A (Zq=−3.31) and TOMM20 (Zq=−2.07) (Supplementary Table 2), further supporting our hypothesis.
Previous studies addressing changes in mtDNA copy number have shown inverse correlation between mtDNA content and T2DM [64], [65], in contrast with our results. Nevertheless, these studies were carried out in whole tissue samples and, therefore, could be affected by differences in the mitochondrial mass. It has to be noted that the current work is based on samples containing the same amount of mitochondria, thus avoiding such kind of differences.
3.4. Quantitation of cysteine oxidation in mitochondrial adipocytes
For several years, ROS production was considered unregulated and their targets were thought to be randomly distributed leading to the accumulation of damaged biological molecules, which were in turn pointed out as potential contributors to several pathologies [66]. Currently, there are clear evidences that ROS production has also favorable effects due to their implication in several signal transduction pathways involving reversible reduction and oxidation of specific amino acids [26].
To gain insight into mitochondrial redox signaling in obesity, we have carried out a large-scale identification and quantitation of reversible thiol oxidative modifications in adipocyte mitochondria based on a proteomic procedure that enables to independently ascertain quantitative changes at both the protein and the oxCys abundance levels. Our aim has been to evaluate the dual role of ROS as secondary messengers vs. stress molecules through the analysis of Cys oxidative modifications in aging (a physiological condition) and T2DM (a pathological or stressful condition), respectively. To our knowledge, this study constitutes the first description of reversible Cys oxidation in human adipose tissue, particularly in adipocyte mitochondria.
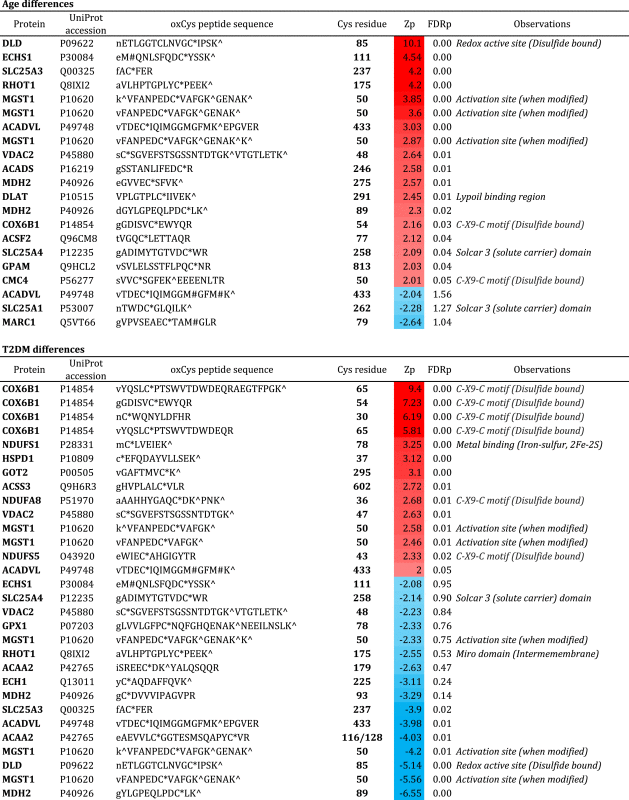
A total of 229 oxCys peptides were identified at 1% FDR, corresponding to 244 oxCys sites within a set of 116 proteins (Supplementary Table 4). The oxCys proteins were mainly oxidoreductases involved in Antioxidant activity or Nucleotide binding functions representing key mitochondrial processes such as Oxidative phosphorylation, Tricarboxylic acid cycle or β-oxidation among others (Supplementary Table 5). Of note, 44 of the oxCys peptides identified (about 20%) pertained to OXPHOS subunits. Some of these oxCys-containing proteins belonged to complex I and IV, as shown in red color in Figs. 3B-C and 4B-C. It is noteworthy that no oxCys sites were identified in mtDNA-encoded proteins (intra-membrane subunits); only proteins located in the inter-membrane or the matrix spaces exhibited these modifications (Figs. 3B-C, 4B-C). The WSPP statistical model revealed 21 and 30 oxCys peptides differentially abundant in the aging and the T2DM comparisons, respectively (Table 2, Supplementary Table 4). Remarkably, a considerable number of the altered oxCys sites corresponded to known disulfide bonds or to C-X9-C type motifs (e.g. Cys 30 and Cys 65 of COX6B1 and Cys 36 of NADH dehydrogenase [ubiquinone] 1 alpha subcomplex subunit 8, NDUFA8) (Table 2). These C-X9-C domains are localized in nuclear-encoded proteins that are imported into the mitochondrion through the evolutionary conserved redox-active MIA (Mitochondrial Intermembrane space Assembly) pathway [67]. This minor pathway depends on redox-regulated folding events that stabilize, trap and finally import into the mitochondrion the C-X9-C domain-carrying proteins like NDUFA8, NDUFS5 and COX6B1. NDUFA8, NDUFS5 are important accessory molecules that take part in the last stages of complex I assembly [68], whereas COX6B1 is a key protein involved in the biogenesis [69] and the stabilization of complex IV subunits [43]. Noteworthy, our redox proteomics data revealed that in T2DM comparison Cys-peptides from the aforementioned C-X9-C domain-carrying proteins were significantly oxidized; likewise, in the aging comparison several oxCys-containing peptides from COX6B1 were significantly increased (Table 2). Altogether, these data suggest an inadequate import of nuclear-encoded proteins into the mitochondria through the MIA pathway, with consequent compromised complex assembly. Since aging has long been associated to IR progression [70], [71], the alteration of MIA pathway emerges as a connecting link between the pathology (i.e. IR) and the physiological aging. To our knowledge, this is the first time that defective protein transport alongside the organelle is pointed out as a hallmark of mitochondrial dysfunction in aging and T2DM.
Table 2.
Differentially abundant oxCys peptides in the age and T2DM comparisons. Protein name, UniProt accession code and oxCys peptide sequences are shown. The position of the oxCys residues in each protein is specified together with the structural observations reported by UniProt. Zp corresponds to the standardized log2 ratio at the peptide level; the red-blue scale means increased or decreased oxidation, respectively. FDRp refers to FDR at the peptide level. M#, Methionine oxidation; C*, Cysteine methylthio modification (referring to oxidation site); K^, Lysine iTRAQ 4-plex tag. The iTRAQ modified N-terminal residues are shown in lower case.
 |
3.5. Linking Cys oxidation to protein function in adipocyte mitochondria
Taking advantage of the deep mitochondrial proteome coverage reached in this study we have further investigated the association between Cys oxidation levels (as measured by the corresponding Zp values) and protein abundance (assessed by Zq) in the aging and T2DM assessments. Correlation analyses revealed that the changes in abundance of oxCys were inversely associated to protein abundance levels, both in the aging (R=−0.26, p<0.0001) and T2DM comparisons (R=−0.38, p<0.0001) (Supplementary Fig. 6A). Noteworthy, this inverse correlation was more pronounced considering only OXPHOS proteins in aging (R=−0.35, p<0.05) and, particularly, in the T2DM assessment (R=−0.64, p<0.0001) (Supplementary Fig. 6B). In addition, the analysis of the cumulative frequency of changes in oxCys peptides and OXPHOS oxidized proteins in both assessments showed that most of the oxCys peptides identified in these proteins tended to be up-regulated, whereas the corresponding proteins showed the opposite trend (Fig. 5).
Fig. 5.

Cys oxidation levels in OXPHOS proteins. Cumulative frequency of changes in oxCys peptides (Zp) and OXPHOS oxidized proteins (Zq) in the age (upper panel) and T2DM (lower panel) comparisons. Changes in oxCys peptides (red line) are represented together with their corresponding oxidized protein changes (dashed grey line). An up- or down-wards shift from the theoretical curve means a coordinated tendency to up- or down-regulation, respectively. (For interpretation of the references to color in this figure legend, the reader is referred to the web version of this article).
Although the role of reversible Cys modifications in redox signaling has been well appreciated [72], to date little is known about the biological implications of these modifications. Our data have revealed that oxCys abundance follows distinctive patterns concerning OXPHOS complexes in the two comparisons. In aging, the oxidation was mainly localized in complex III and IV, which also comprised the most down-regulated proteins (Fig. 6A). In T2DM, however, the oxidation was restricted to complex I and IV (Fig. 6B), where most oxidized proteins showed down-regulated and oxCys peptides were significantly more abundant. This outcome is particularly pronounced in COX6B1, where oxidative changes in the C-X9-C domains could lead to its defective import into the mitochondrion through the MIA pathway, as earlier pointed out. Accordingly, our data suggest that COX6B1 oxidation could contribute to complex IV dysfunction. To further investigate this issue, we examined complex IV activity in a different set of mitochondrial samples. Interestingly, our data showed a significant decrease of complex IV activity in diabetic compared to non-diabetic patients (Fig. 7A). Remarkably, previous studies had evidenced that resveratrol, an anti-oxidant metabolite, improves complex IV activity [43], thus strengthening our results. In addition, Blue Native (BN)-PAGE analyses of digitonin-solubilized adipocyte mitochondria revealed that complex IV was found significantly decreased in diabetic compared to non-diabetic patients (Fig. 7B), potentially accounting for the reduction of complex IV activity in T2DM. Consequently this alteration may support the respiratory dysfunction postulated for T2DM, since complex IV is associated to complex I and III in the different supercomplexes (SCs) [73]. Thus, 2D BN-PAGE assays revealed a trend toward the down-regulation of these SCs in diabetic patients (Fig. 7C). In agreement with these observations, impaired SCs assembly has been reported in muscle mitochondria from diabetic subjects [74].
Fig. 6.

OxCys modifications in OXPHOS proteins. Heat maps representing oxCys peptide changes and oxidized protein abundance changes in the OXPHOS complexes regarding aging (A) and T2DM (B) differences. The yellow-purple columns represent protein abundance changes according to Zq scale. The red-blue scale represents the oxCys-peptide abundance changes (Zp values) and the position of the oxCys residues in each protein is specified. Note that yellow-purple scale means up- or down-regulation and red-blue scale means increased or decreased oxidation. Further information about Zp values of oxCys-peptides is shown in Supplementary Table 4. (For interpretation of the references to color in this figure legend, the reader is referred to the web version of this article).
Fig. 7.

Adipocyte mitochondrial function in T2DM. (A) Complex IV activity in T2DM. Results represent the distribution of average activities of adipocyte mitochondria from diabetic (n=5, grey box) and non-diabetic (n=7, white box) patients. All samples were assayed in triplicate. Statistical significance was set at * p<0.05. (B) Results represent adipocyte mitochondria from diabetic (n=4, black bars) and non-diabetic (n=3, white bars) patients analyzed by 1D BN-PAGE. Complex IV bands were revealed by COX5 A. Graph bars represent the optical density means±SD from two independent experiments. Statistical significance was set at * p<0.05. (C) Representative 2D BN/SDS-PAGE analysis from diabetic and non-diabetic mitochondrial samples. Membranes were incubated with antibodies against NDUFA9 and COX5 A to reveal supercomplexes (SCs) associations. Db, diabetic; Non-db, non-diabetic.
4. Conclusions
In the current work we have used adipose tissue from obese patients to address two different events previously related to oxidative stress and mitochondrial dysfunction: aging, a physiological situation, and T2DM, a severe obesity-associated disorder. In these two comparisons Cys oxidation levels correlated negatively with protein abundance, notably in T2DM, where a greater number of these proteins were OXPHOS subunits. In diabetic patients the proteomic signature of mitochondrial dysfunction comprises: i) a decrease of specific OXPHOS subunits together with reduced complexes and SCs; ii) an increase of the antioxidant response; iii) adjustment of mitochondrial- vs. nuclear-encoded protein modules suggesting a dysfunctional protein translocation into the mitochondria; and iv) oxidative Cys modifications related to defects in protein import through the MIA pathway. We have demonstrated an impaired activity of complex IV, which brings together the most down-regulated and, at the same time, the most oxidized OXPHOS protein components. Oxidative damage and protein changes undergone by the OXPHOS system may compromise the metabolic status of the adipocyte due to an imbalance of NADH/NAD+ and/or ATP/ADP levels. In addition, the modifications of proteins related to mitochondrial transport could also impact intra- and inter-organelle crosstalk, severely disrupting adipocyte homeostasis and therefore leading to aberrant insulin sensitivity. The hallmark of age progression on mitochondrial remodeling also includes down-regulation of OXPHOS components together with increased Cys oxidation levels, albeit to a lesser extent as compared with the T2DM condition. It is not surprising that ROS and oxidative modifications play a more relevant role in a pathological condition like T2DM as compared to a physiological event like aging. In this sense, Complex IV emerges as a common target connecting the oxidative hallmarks of T2DM and aging progression, potentially accounting for the progression of insulin resistance over time in obese individuals.
Setting aside the analysis of individual proteins we have resorted to an innovative combination of redox proteomics and systems biology approaches. The unprecedented capacity of this methodology has generated a vast amount of biologically relevant information, producing a molecular picture of the complex interplay between mitochondrial dysfunction and aging, obesity and T2DM. Furthering our knowledge about reversible oxidative modifications and their implications would help to develop advanced integrative models of proteome regulation and redox signaling pathways, providing a basis for improved redox-based therapeutics in obese patients.
Conflict of interest
All authors declare that they have no financial conflict or competing interests that might be construed to influence the results or interpretation of the manuscript.
Funding
This work was supported by grant SAF2012-33014 from MINECO, Spain (B.P.) and partially financed with FEDER funds, FPI-UAM Program (M.G.S.), PI15/01199 from ISCIII, Spain (A.T.) and Pro CNIC Foundation (E.C., J.A.L. and J.V). All data and materials are available.
Acknowledgments
The authors wish to thank all the patients for their collaboration. We thank Raquel Mesa (from CNIC), Pablo Talavera, Ester Martín, Esteban Martín and Carmen Hernández (from Hospital Clínico San Carlos); and Miguel Ángel Steiner, Laura Gómez-Lanz, Jose María Monturiol and Jorge de Tomás Palacios (from Hospital Gregorio Marañón) for their kind contributions. We also acknowledge Dr. G. Eisinhofer and Dr. M. Mittelbrunn for the SDHC and TFAM antibodies and Dr. C. Ugalde and Dr. R. Pérez-Pérez for the critical reading of this manuscript.
Footnotes
Supplementary data associated with this article can be found in the online version at doi:10.1016/j.redox.2016.12.013.
Appendix A. Supplementary material
Supplementary material
.
Supplementary material
.
Supplementary material
.
Supplementary material
.
Supplementary material
.
References
- 1.Starkov A.A. The role of mitochondria in reactive oxygen species metabolism and signaling. Ann. N.Y. Acad. Sci. 2008;1147:37–52. doi: 10.1196/annals.1427.015. [DOI] [PMC free article] [PubMed] [Google Scholar]
- 2.Cheng Z., Ristow M. Mitochondria and metabolic homeostasis. Antioxid. Redox Signal. 2013;19:240–242. doi: 10.1089/ars.2013.5255. [DOI] [PubMed] [Google Scholar]
- 3.Murphy M.P. Mitochondrial thiols in antioxidant protection and redox signaling: distinct roles for glutathionylation and other thiol modifications. Antioxid. Redox Signal. 2012;16:476–495. doi: 10.1089/ars.2011.4289. [DOI] [PubMed] [Google Scholar]
- 4.James A.M., Collins Y., Logan A., Murphy M.P. Mitochondrial oxidative stress and the metabolic syndrome. Trends Endocrinol. Metab.: TEM. 2012;23:429–434. doi: 10.1016/j.tem.2012.06.008. [DOI] [PubMed] [Google Scholar]
- 5.James W.P. The epidemiology of obesity: the size of the problem. J. Intern. Med. 2008;263:336–352. doi: 10.1111/j.1365-2796.2008.01922.x. [DOI] [PubMed] [Google Scholar]
- 6.Kershaw E.E., Flier J.S. Adipose tissue as an endocrine organ. J. Clin. Endocrinol. Metab. 2004;89:2548–2556. doi: 10.1210/jc.2004-0395. [DOI] [PubMed] [Google Scholar]
- 7.Neeland I.J., Turer A.T., Ayers C.R., Powell-Wiley T.M., Vega G.L., Farzaneh-Far R., Grundy S.M., Khera A., McGuire D.K., de Lemos J.A. Dysfunctional adiposity and the risk of prediabetes and type 2 diabetes in obese adults. JAMA: J. Am. Med. Assoc. 2012;308:1150–1159. doi: 10.1001/2012.jama.11132. [DOI] [PMC free article] [PubMed] [Google Scholar]
- 8.Ahima R.S. Digging deeper into obesity. J. Clin. Investig. 2011;121:2076–2079. doi: 10.1172/JCI58719. [DOI] [PMC free article] [PubMed] [Google Scholar]
- 9.Gao A.W., Canto C., Houtkooper R.H. Mitochondrial response to nutrient availability and its role in metabolic disease. EMBO Mol. Med. 2014;6:580–589. doi: 10.1002/emmm.201303782. [DOI] [PMC free article] [PubMed] [Google Scholar]
- 10.Petersen K.F., Befroy D., Dufour S., Dziura J., Ariyan C., Rothman D.L., DiPietro L., Cline G.W., Shulman G.I. Mitochondrial dysfunction in the elderly: possible role in insulin resistance. Science. 2003;300:1140–1142. doi: 10.1126/science.1082889. [DOI] [PMC free article] [PubMed] [Google Scholar]
- 11.Patti M.E., Corvera S. The role of mitochondria in the pathogenesis of type 2 diabetes. Endocr. Rev. 2010;31:364–395. doi: 10.1210/er.2009-0027. [DOI] [PMC free article] [PubMed] [Google Scholar]
- 12.Wang X., Hai C. redox modulation of adipocyte differentiation: hypothesis of "redox chain" and novel insights into intervention of adipogenesis and obesity. Free Radic. Biol. Med. 2015;89:99–125. doi: 10.1016/j.freeradbiomed.2015.07.012. [DOI] [PubMed] [Google Scholar]
- 13.Jankovic A., Korac A., Buzadzic B., Otasevic V., Stancic A., Daiber A., Korac B. Redox implications in adipose tissue (dys)function – a new look at old acquaintances. Redox Biol. 2015;6:19–32. doi: 10.1016/j.redox.2015.06.018. [DOI] [PMC free article] [PubMed] [Google Scholar]
- 14.Holmstrom M.H., Iglesias-Gutierrez E., Zierath J.R., Garcia-Roves P.M. Tissue-specific control of mitochondrial respiration in obesity-related insulin resistance and diabetes. Am. J. Physiol. Endocrinol. Metab. 2012;302:E731–E739. doi: 10.1152/ajpendo.00159.2011. [DOI] [PubMed] [Google Scholar]
- 15.Kusminski C.M., Scherer P.E. Mitochondrial dysfunction in white adipose tissue. Trends Endocrinol. Metab.: TEM. 2012;23:435–443. doi: 10.1016/j.tem.2012.06.004. [DOI] [PMC free article] [PubMed] [Google Scholar]
- 16.Boudina S., Graham T.E. Mitochondrial function/dysfunction in white adipose tissue. Exp. Physiol. 2014;99:1168–1178. doi: 10.1113/expphysiol.2014.081414. [DOI] [PubMed] [Google Scholar]
- 17.Perez-Perez R., Garcia-Santos E., Ortega-Delgado F.J., Lopez J.A., Camafeita E., Ricart W., Fernandez-Real J.M., Peral B. Attenuated metabolism is a hallmark of obesity as revealed by comparative proteomic analysis of human omental adipose tissue. J. Proteom. 2012;75:783–795. doi: 10.1016/j.jprot.2011.09.016. [DOI] [PubMed] [Google Scholar]
- 18.Rabilloud T., Kieffer S., Procaccio V., Louwagie M., Courchesne P.L., Patterson S.D., Martinez P., Garin J., Lunardi J. Two-dimensional electrophoresis of human placental mitochondria and protein identification by mass spectrometry: toward a human mitochondrial proteome. Electrophoresis. 1998;19:1006–1014. doi: 10.1002/elps.1150190616. [DOI] [PubMed] [Google Scholar]
- 19.Taylor S.W., Fahy E., Zhang B., Glenn G.M., Warnock D.E., Wiley S., Murphy A.N., Gaucher S.P., Capaldi R.A., Gibson B.W., Ghosh S.S. Characterization of the human heart mitochondrial proteome. Nat. Biotechnol. 2003;21:281–286. doi: 10.1038/nbt793. [DOI] [PubMed] [Google Scholar]
- 20.Lindinger P.W., Christe M., Eberle A.N., Kern B., Peterli R., Peters T., Jayawardene K.J., Fearnley I.M., Walker J.E. Important mitochondrial proteins in human omental adipose tissue show reduced expression in obesity. J. Proteom. 2015;124:79–87. doi: 10.1016/j.jprot.2015.03.037. [DOI] [PubMed] [Google Scholar]
- 21.Lefort N., Yi Z., Bowen B., Glancy B., De Filippis E.A., Mapes R., Hwang H., Flynn C.R., Willis W.T., Civitarese A., Hojlund K., Mandarino L.J. Proteome profile of functional mitochondria from human skeletal muscle using one-dimensional gel electrophoresis and HPLC-ESI-MS/MS. J. Proteom. 2009;72:1046–1060. doi: 10.1016/j.jprot.2009.06.011. [DOI] [PMC free article] [PubMed] [Google Scholar]
- 22.Winterbourn C.C., Hampton M.B. Thiol chemistry and specificity in redox signaling. Free Radic. Biol. Med. 2008;45:549–561. doi: 10.1016/j.freeradbiomed.2008.05.004. [DOI] [PubMed] [Google Scholar]
- 23.Ckless K. Redox proteomics: from bench to bedside. Adv. Exp. Med. Biol. 2014;806:301–317. doi: 10.1007/978-3-319-06068-2_13. [DOI] [PubMed] [Google Scholar]
- 24.Wojdyla K., Rogowska-Wrzesinska A. Differential alkylation-based redox proteomics – lessons learnt. Redox Biol. 2015;6:240–252. doi: 10.1016/j.redox.2015.08.005. [DOI] [PMC free article] [PubMed] [Google Scholar]
- 25.Bak D.W., Weerapana E. Cysteine-mediated redox signalling in the mitochondria. Mol. Biosyst. 2015;11:678–697. doi: 10.1039/c4mb00571f. [DOI] [PubMed] [Google Scholar]
- 26.Holmstrom K.M., Finkel T. Cellular mechanisms and physiological consequences of redox-dependent signalling. Nat. Rev. Mol. Cell Biol. 2014;15:411–421. doi: 10.1038/nrm3801. [DOI] [PubMed] [Google Scholar]
- 27.Martinez-Acedo P., Nunez E., Gomez F.J., Moreno M., Ramos E., Izquierdo-Alvarez A., Miro-Casas E., Mesa R., Rodriguez P., Martinez-Ruiz A., Dorado D.G., Lamas S., Vazquez J. A novel strategy for global analysis of the dynamic thiol redox proteome. Mol. Cell. Proteom.: MCP. 2012;11:800–813. doi: 10.1074/mcp.M111.016469. [DOI] [PMC free article] [PubMed] [Google Scholar]
- 28.Martinez-Bartolome S., Navarro P., Martin-Maroto F., Lopez-Ferrer D., Ramos-Fernandez A., Villar M., Garcia-Ruiz J.P., Vazquez J. Properties of average score distributions of SEQUEST: the probability ratio method. Mol. Cell. Proteom.: MCP. 2008;7:1135–1145. doi: 10.1074/mcp.M700239-MCP200. [DOI] [PubMed] [Google Scholar]
- 29.Navarro P., Vazquez J. A refined method to calculate false discovery rates for peptide identification using decoy databases. J. Proteome Res. 2009;8:1792–1796. doi: 10.1021/pr800362h. [DOI] [PubMed] [Google Scholar]
- 30.Lopez-Ferrer D., Ramos-Fernandez A., Martinez-Bartolome S., Garcia-Ruiz P., Vazquez J. Quantitative proteomics using 16O/18O labeling and linear ion trap mass spectrometry. Proteomics. 2006;6(Suppl. 1):S4–11. doi: 10.1002/pmic.200500375. [DOI] [PubMed] [Google Scholar]
- 31.Ramos-Fernandez A., Lopez-Ferrer D., Vazquez J. Improved method for differential expression proteomics using trypsin-catalyzed 18O labeling with a correction for labeling efficiency. Mol. Cell. Proteom.: MCP. 2007;6:1274–1286. doi: 10.1074/mcp.T600029-MCP200. [DOI] [PubMed] [Google Scholar]
- 32.Navarro P., Trevisan-Herraz M., Bonzon-Kulichenko E., Nunez E., Martinez-Acedo P., Perez-Hernandez D., Jorge I., Mesa R., Calvo E., Carrascal M., Hernaez M.L., Garcia F., Barcena J.A., Ashman K., Abian J., Gil C., Redondo J.M., Vazquez J. General statistical framework for quantitative proteomics by stable isotope labeling. J. Proteome Res. 2014;13:1234–1247. doi: 10.1021/pr4006958. [DOI] [PubMed] [Google Scholar]
- 33.Luo R., Zhao H. Protein quantitation using iTRAQ: review on the sources of variations and analysis of nonrandom missingness. Stat. Interface. 2012;5:99–107. doi: 10.4310/sii.2012.v5.n1.a9. [DOI] [PMC free article] [PubMed] [Google Scholar]
- 34.F. Garcia-Marques, M. Trevisan-Herraz, S. Martinez-Martinez, E. Camafeita, I. Jorge, J.A. Lopez, N. Mendez-Barbero, S. Mendez-Ferrer, M.A. Del Pozo, B. Ibanez, V. Andres, F. Sanchez-Madrid, J.M. Redondo, E. Bonzon-Kulichenko, J. VazquezA novel systems-biology algorithm for the analysis of coordinated protein responses using quantitative proteomics, Mol. Cell. Proteom.: MCP, 2016 [DOI] [PMC free article] [PubMed]
- 35.Huang da W., Sherman B.T., Lempicki R.A. Bioinformatics enrichment tools: paths toward the comprehensive functional analysis of large gene lists. Nucleic Acids Res. 2009;37:1–13. doi: 10.1093/nar/gkn923. [DOI] [PMC free article] [PubMed] [Google Scholar]
- 36.Calvo S.E., Clauser K.R., Mootha V.K. MitoCarta2.0: an updated inventory of mammalian mitochondrial proteins. Nucleic Acids Res. 2016;44:D1251–D1257. doi: 10.1093/nar/gkv1003. [DOI] [PMC free article] [PubMed] [Google Scholar]
- 37.Huang da W., Sherman B.T., Lempicki R.A. Systematic and integrative analysis of large gene lists using DAVID bioinformatics resources. Nat. Protoc. 2009;4:44–57. doi: 10.1038/nprot.2008.211. [DOI] [PubMed] [Google Scholar]
- 38.Gomez-Serrano M., Camafeita E., Garcia-Santos E., Lopez J.A., Rubio M.A., Sanchez-Pernaute A., Torres A., Vazquez J., Peral B. Proteome-wide alterations on adipose tissue from obese patients as age-, diabetes- and gender-specific hallmarks. Sci. Rep. 2016;6:25756. doi: 10.1038/srep25756. [DOI] [PMC free article] [PubMed] [Google Scholar]
- 39.Pagliarini D.J., Calvo S.E., Chang B., Sheth S.A., Vafai S.B., Ong S.E., Walford G.A., Sugiana C., Boneh A., Chen W.K., Hill D.E., Vidal M., Evans J.G., Thorburn D.R., Carr S.A., Mootha V.K. A mitochondrial protein compendium elucidates complex I disease biology. Cell. 2008;134:112–123. doi: 10.1016/j.cell.2008.06.016. [DOI] [PMC free article] [PubMed] [Google Scholar]
- 40.Smith A.C., Robinson A.J. MitoMiner v3.1, an update on the mitochondrial proteomics database. Nucleic Acids Res. 2016;44:D1258–D1261. doi: 10.1093/nar/gkv1001. [DOI] [PMC free article] [PubMed] [Google Scholar]
- 41.Uhlen M., Fagerberg L., Hallstrom B.M., Lindskog C., Oksvold P., Mardinoglu A., Sivertsson A., Kampf C., Sjostedt E., Asplund A., Olsson I., Edlund K., Lundberg E., Navani S., Szigyarto C.A., Odeberg J., Djureinovic D., Takanen J.O., Hober S., Alm T., Edqvist P.H., Berling H., Tegel H., Mulder J., Rockberg J., Nilsson P., Schwenk J.M., Hamsten M., von Feilitzen K., Forsberg M., Persson L., Johansson F., Zwahlen M., von Heijne G., Nielsen J., Ponten F. Proteomics. Tissue-based map of the human proteome. Science. 2015;347:1260419. doi: 10.1126/science.1260419. [DOI] [PubMed] [Google Scholar]
- 42.B. Alberts, A. Johnson, J. Lewis, P. Walter, M. Raff, K. Roberts. Molecular Biology of the Cell 4th Edition edition: International Student Edition, 2002, Routledge
- 43.Abdulhag U.N., Soiferman D., Schueler-Furman O., Miller C., Shaag A., Elpeleg O., Edvardson S., Saada A. Mitochondrial complex IV deficiency, caused by mutated COX6B1, is associated with encephalomyopathy, hydrocephalus and cardiomyopathy. Eur. J. Hum. Genet. 2015;23:159–164. doi: 10.1038/ejhg.2014.85. [DOI] [PMC free article] [PubMed] [Google Scholar]
- 44.Massa V., Fernandez-Vizarra E., Alshahwan S., Bakhsh E., Goffrini P., Ferrero I., Mereghetti P., D'Adamo P., Gasparini P., Zeviani M. Severe infantile encephalomyopathy caused by a mutation in COX6B1, a nucleus-encoded subunit of cytochrome c oxidase. Am. J. Hum. Genet. 2008;82:1281–1289. doi: 10.1016/j.ajhg.2008.05.002. [DOI] [PMC free article] [PubMed] [Google Scholar]
- 45.Garcia-Marques F., Trevisan-Herraz M., Martinez-Martinez S., Camafeita E., Jorge I., Lopez J.A., Mendez-Barbero N., Mendez-Ferrer S., Del Pozo M.A., Ibanez B., Andres V., Sanchez-Madrid F., Redondo J.M., Bonzon-Kulichenko E., Vazquez J. A novel systems-biology algorithm for the analysis of coordinated protein responses using quantitative proteomics. Mol. Cell. Proteom.: MCP. 2016;15:1740–1760. doi: 10.1074/mcp.M115.055905. [DOI] [PMC free article] [PubMed] [Google Scholar]
- 46.Sprinzak E., Cokus S.J., Yeates T.O., Eisenberg D., Pellegrini M. Detecting coordinated regulation of multi-protein complexes using logic analysis of gene expression. BMC Syst. Biol. 2009;3:115. doi: 10.1186/1752-0509-3-115. [DOI] [PMC free article] [PubMed] [Google Scholar]
- 47.Aguer C., Pasqua M., Thrush A.B., Moffat C., McBurney M., Jardine K., Zhang R., Beauchamp B., Dent R., McPherson R., Harper M.E. Increased proton leak and SOD2 expression in myotubes from obese non-diabetic subjects with a family history of type 2diabetes. Biochim. Biophys. Acta. 1832;1624–1633:2013. doi: 10.1016/j.bbadis.2013.05.008. [DOI] [PubMed] [Google Scholar]
- 48.Han Y.H., Buffolo M., Pires K.M., Pei S., Scherer P.E., Boudina S. Adipocyte-specific deletion of manganese superoxide dismutase protects from diet-induced obesity through increased mitochondrial uncoupling and biogenesis. Diabetes. 2016;65:2639–2651. doi: 10.2337/db16-0283. [DOI] [PMC free article] [PubMed] [Google Scholar]
- 49.Mimaki M., Wang X., McKenzie M., Thorburn D.R., Ryan M.T. Understanding mitochondrial complex I assembly in health and disease. Biochim. Biophys. Acta. 1817;851–862:2012. doi: 10.1016/j.bbabio.2011.08.010. [DOI] [PubMed] [Google Scholar]
- 50.D.A. Stroud, E.E. Surgenor, L.E. Formosa, B. Reljic, A.E. Frazier, M.G. Dibley, L.D. Osellame, T. Stait, T.H. Beilharz, D.R. Thorburn, A. Salim, M.T. Ryan, Accessory subunits are integral for assembly and function of human mitochondrial complex I. Nature 538 (2016) 123-126. [DOI] [PubMed]
- 51.Zickermann V., Wirth C., Nasiri H., Siegmund K., Schwalbe H., Hunte C., Brandt U. Structural biology. Mechanistic insight from the crystal structure of mitochondrial complex I. Science. 2015;347:44–49. doi: 10.1126/science.1259859. [DOI] [PubMed] [Google Scholar]
- 52.Srinivasan S., Avadhani N.G. Cytochrome c oxidase dysfunction in oxidative stress. Free Radic. Biol. Med. 2012;53:1252–1263. doi: 10.1016/j.freeradbiomed.2012.07.021. [DOI] [PMC free article] [PubMed] [Google Scholar]
- 53.Mick D.U., Fox T.D., Rehling P. Inventory control: cytochrome c oxidase assembly regulates mitochondrial translation. Nat. Rev. Mol. Cell Biol. 2011;12:14–20. doi: 10.1038/nrm3029. [DOI] [PMC free article] [PubMed] [Google Scholar]
- 54.Sanchez-Caballero L., Guerrero-Castillo S., Nijtmans L. Unraveling the complexity of mitochondrial complex I assembly: a dynamic process. Biochim. Et. Biophys. Acta. 1857;980–990:2016. doi: 10.1016/j.bbabio.2016.03.031. [DOI] [PubMed] [Google Scholar]
- 55.Larsson N.G., Wang J., Wilhelmsson H., Oldfors A., Rustin P., Lewandoski M., Barsh G.S., Clayton D.A. Mitochondrial transcription factor A is necessary for mtDNA maintenance and embryogenesis in mice. Nat. Genet. 1998;18:231–236. doi: 10.1038/ng0398-231. [DOI] [PubMed] [Google Scholar]
- 56.Campbell C.T., Kolesar J.E., Kaufman B.A. Mitochondrial transcription factor A regulates mitochondrial transcription initiation, DNA packaging, and genome copy number. Biochim. Biophys. Acta. 1819;921–929:2012. doi: 10.1016/j.bbagrm.2012.03.002. [DOI] [PubMed] [Google Scholar]
- 57.Picca A., Pesce V., Fracasso F., Joseph A.M., Leeuwenburgh C., Lezza A.M. Aging and calorie restriction oppositely affect mitochondrial biogenesis through TFAM binding at both origins of mitochondrial DNA replication in rat liver. PLoS One. 2013;8:e74644. doi: 10.1371/journal.pone.0074644. [DOI] [PMC free article] [PubMed] [Google Scholar]
- 58.Pesce V., Cormio A., Fracasso F., Lezza A.M., Cantatore P., Gadaleta M.N. Age-related changes of mitochondrialDNA content and mitochondrial genotypic and phenotypic alterations in rat hind-limb skeletal muscles. J. Gerontol. Ser. A Biol. Sci. Med. Sci. 2005;60:715–723. doi: 10.1093/gerona/60.6.715. [DOI] [PubMed] [Google Scholar]
- 59.Heinonen S., Buzkova J., Muniandy M., Kaksonen R., Ollikainen M., Ismail K., Hakkarainen A., Lundbom J., Lundbom N., Vuolteenaho K., Moilanen E., Kaprio J., Rissanen A., Suomalainen A., Pietilainen K.H. Impaired mitochondrial biogenesis in adipose tissue in acquired obesity. Diabetes. 2015;64:3135–3145. doi: 10.2337/db14-1937. [DOI] [PubMed] [Google Scholar]
- 60.Vernochet C., Mourier A., Bezy O., Macotela Y., Boucher J., Rardin M.J., An D., Lee K.Y., Ilkayeva O.R., Zingaretti C.M., Emanuelli B., Smyth G., Cinti S., Newgard C.B., Gibson B.W., Larsson N.G., Kahn C.R. Adipose-specific deletion of TFAM increases mitochondrial oxidation and protects mice against obesity and insulin resistance. Cell Metab. 2012;16:765–776. doi: 10.1016/j.cmet.2012.10.016. [DOI] [PMC free article] [PubMed] [Google Scholar]
- 61.Villarroya J., Giralt M., Villarroya, F Mitochondrial DNA: an up-and-coming actor in white adipose tissue pathophysiology. Obesity (Silver Spring) 2009;17:1814–1820. doi: 10.1038/oby.2009.152. [DOI] [PubMed] [Google Scholar]
- 62.Young J.C., Hoogenraad N.J., Hartl F.U. Molecular chaperones Hsp90 and Hsp70 deliver preproteins to the mitochondrial import receptor Tom70. Cell. 2003;112:41–50. doi: 10.1016/s0092-8674(02)01250-3. [DOI] [PubMed] [Google Scholar]
- 63.Schmidt O., Pfanner N., Meisinger C. Mitochondrial protein import: from proteomics to functional mechanisms. Nat. Rev. Mol. Cell Biol. 2010;11:655–667. doi: 10.1038/nrm2959. [DOI] [PubMed] [Google Scholar]
- 64.Lindinger A., Peterli R., Peters T., Kern B., von Flue M., Calame M., Hoch M., Eberle A.N., Lindinger, P. W Mitochondrial DNA content in human omental adipose tissue. Obes. Surg. 2010;20:84–92. doi: 10.1007/s11695-009-9987-3. [DOI] [PubMed] [Google Scholar]
- 65.Hsieh C.J., Weng S.W., Liou C.W., Lin T.K., Chen J.B., Tiao M.M., Hung Y.T., Chen I.Y., Huang W.T., Wang P.W. Tissue-specific differences in mitochondrial DNA content in type 2 diabetes. Diabetes Res. Clin. Pract. 2011;92:106–110. doi: 10.1016/j.diabres.2011.01.010. [DOI] [PubMed] [Google Scholar]
- 66.Harman D. Aging: a theory based on free radical and radiation chemistry. J. Gerontol. 1956;11:298–300. doi: 10.1093/geronj/11.3.298. [DOI] [PubMed] [Google Scholar]
- 67.Stojanovski D., Bragoszewski P., Chacinska A. The MIA pathway: a tight bond between protein transport and oxidative folding in mitochondria. Biochim. Biophys. Acta. 1823;1142–1150:2012. doi: 10.1016/j.bbamcr.2012.04.014. [DOI] [PubMed] [Google Scholar]
- 68.Szklarczyk R., Wanschers B.F., Nabuurs S.B., Nouws J., Nijtmans L.G., Huynen M.A. NDUFB7 and NDUFA8 are located at the intermembrane surface of complex I. FEBS Lett. 2011;585:737–743. doi: 10.1016/j.febslet.2011.01.046. [DOI] [PubMed] [Google Scholar]
- 69.Modjtahedi N., Tokatlidis K., Dessen P., Kroemer G. Mitochondrial proteins containing. Trends Biochem. Sci. 2016;41:245–260. doi: 10.1016/j.tibs.2015.12.004. [DOI] [PubMed] [Google Scholar]
- 70.Barzilai N., Huffman D.M., Muzumdar R.H., Bartke A. The critical role of metabolic pathways in aging. Diabetes. 2012;61:1315–1322. doi: 10.2337/db11-1300. [DOI] [PMC free article] [PubMed] [Google Scholar]
- 71.Fink R.I., Kolterman O.G., Griffin J., Olefsky J.M. Mechanisms of insulin resistance in aging. J. Clin. Investig. 1983;71:1523–1535. doi: 10.1172/JCI110908. [DOI] [PMC free article] [PubMed] [Google Scholar]
- 72.Go Y.M., Chandler J.D., Jones D.P. The cysteine proteome. Free Radic. Biol. Med. 2015;84:227–245. doi: 10.1016/j.freeradbiomed.2015.03.022. [DOI] [PMC free article] [PubMed] [Google Scholar]
- 73.Lapuente-Brun E., Moreno-Loshuertos R., Acin-Perez R., Latorre-Pellicer A., Colas C., Balsa E., Perales-Clemente E., Quiros P.M., Calvo E., Rodriguez-Hernandez M.A., Navas P., Cruz R., Carracedo A., Lopez-Otin C., Perez-Martos A., Fernandez-Silva P., Fernandez-Vizarra E., Enriquez J.A. Supercomplex assembly determines electron flux in the mitochondrial electron transport chain. Science. 2013;340:1567–1570. doi: 10.1126/science.1230381. [DOI] [PubMed] [Google Scholar]
- 74.Antoun G., McMurray F., Thrush A.B., Patten D.A., Peixoto A.C., Slack R.S., McPherson R., Dent R., Harper M.E. Impaired mitochondrial oxidative phosphorylation and supercomplex assembly in rectus abdominis muscle of diabetic obese individuals. Diabetologia. 2015;58:2861–2866. doi: 10.1007/s00125-015-3772-8. [DOI] [PubMed] [Google Scholar]
Associated Data
This section collects any data citations, data availability statements, or supplementary materials included in this article.
Supplementary Materials
Supplementary material
Supplementary material
Supplementary material
Supplementary material
Supplementary material