Abstract
We use long multiple trajectories generated by molecular dynamics simulations to probe the stability of oligomers of Aβ16–22 (KLVFFAE) peptides in aqueous urea solution. High concentration of urea promotes the formation of β-strand structures in Aβ16–22 monomers, whereas in water they adopt largely compact random coil structures. The tripeptide system, which forms stable antiparallel β-sheet structure in water, is destabilized in urea solution. The enhancement of β-strand content in the monomers and the disruption of oligomeric structure occur largely by direct interaction of urea with the peptide backbone. Our simulations suggest that the oligomer unbinding dynamics is determined by two opposing effects, namely, by the increased propensity of monomers to form β-strands and the rapid disruption of the oligomers. The qualitative conclusions are affirmed by using two urea models. Because the proposed destabilization mechanism depends largely on hydrogen bond formation between urea and the peptide backbone, we predict that high urea concentration will destabilize oligomers of other amyloidogenic peptides as well.
An increasing number of diseases are linked to aggregation of proteins and peptides (1). Although proteins implicated in this class of diseases are known, the mechanisms of their aggregation in the amyloid structures with a characteristic cross-β-pattern are not fully understood (2). It is important to characterize the cascade of events in the assembly pathway of disease related proteins because of the suspicion that low molecular weight soluble oligomers and protofibrils are the primary cause of neurotoxicity (3, 4). The finding that a common antibody recognizes mobile oligomers formed from proteins with little or no sequence similarity (5) suggests that there is a limited number of scenarios for their formation (6). Furthermore, the formation of ordered amyloid aggregates appears to be a generic property of all polypeptide chains (7).
Understanding the factors that contribute to the stability and dynamics of oligomers of amyloid β (Aβ) peptides, which are cleaved in a variety of lengths from the membrane amyloid precursor protein, is necessary for devising methods to block their formation. The interest in Aβ peptides is associated with their ability to form amyloid oligomers and fibrils, which have long been considered to be the primary pathogenic agents of the Alzheimer's disease (8). The amyloidogenic pathway for Aβ peptides is a complex cascade of molecular events, involving large conformational changes in the monomers, formation of soluble oligomeric intermediates, and gradual accumulation of protofibrils and fibril deposits. The hallmark of amyloid assembly is the emergence of ordered cross β-structure, in which the Aβ peptides are oriented perpendicular to a fibril axis to form long β-sheets. Solid-state NMR experiments have begun to reveal the details of the internal architecture of amyloid fibrils formed by the wild-type Aβ peptides and their fragments (9–12). These experiments suggest that depending on length and sequence both parallel or antiparallel aligned in-registry organizations of Aβ peptides are possible. Much less is known about the kinetics of amyloid assembly. Experimental studies suggested that transient formation of α-helical structure may be involved in amyloid assembly (13). This result is striking, because α-helical conformations are absent in both monomer aqueous solution structures (14) and amyloid fibrils (12).
Because of the complexity and the generic nature of amyloid assembly the molecular mechanisms of their formation may be gleaned by the detailed study of aggregation of short peptide fragments (15, 16). Simulations have been used to propose plausible fibril structures of Aβ peptides of various lengths (17). Fibrillization of fragments of Aβ peptides bear all of the characteristics of amyloidogenesis of the full-length wild-type peptides (11). Molecular dynamics (MD) study of the assembly of Aβ16–22 oligomers in explicit water (16) and simulations of the fragment of Sup35 using implicit solvent (18) show that the initial formation of mobile oligomers is driven by side chain hydrophobic and electrostatic interactions. Here, we examine the effect of aqueous urea solution on the stability of Aβ16–22 oligomers. We were motivated to undertake this study because interactions of urea with Aβ peptides can elucidate the mechanisms of amyloidogenesis. In addition, certain proteins, such as Ig light chains, assemble into fibrils in the presence of urea in vivo. We show that, although Aβ16–22 monomers prefer β-strand conformations in urea, the oligomers are destabilized at high urea concentrations.
Methods
MD Simulations. We performed MD simulations of Aβ16–22 (KLVFFAE) monomers and oligomers in aqueous urea solution by using the moil package (19) with a protocol similar to that described in ref. 16. The terminals of Aβ16–22 peptide are oppositely charged and are capped with neutral acetyl and amide groups. Starting with the hydrated peptide or oligomer system equilibrated at 300 K, we randomly replaced waters with urea molecules by taking into account that, at 8 M urea, the ratio of water to urea molecules is ≈4.5 and the overall density of the solution is 1.18 g/cm3. Solvent molecules that cause steric clashes were removed. The resulting system was then energy minimized, heated, and equilibrated at 300 K in a (34.7 Å)3 cube with periodic boundary conditions (16).
To test the force field dependence of the simulation results, we used two urea models. The first is the optimized potentials for liquid simulations (OPLS) urea model, which uses amber parameterization for covalent interactions (20, 21). The second model is the one developed recently by Weerasinghe and Smith (WS) (22). The WS model differs from OPLS mainly in the values of the partial charges on the urea oxygen, which is increased from –0.390e to –0.675e, and hydrogen, which is decreased from +0.333e to +0.285e. The WS model also uses a Lennard–Jones potential for urea hydrogens with σ = 0.158 nm and ε = 0.021 kcal/mol.
Simulation Details. For Aβ16–22 monomers, we generated four 10-ns trajectories in 8 M OPLS urea and four 10.5-ns trajectories for 8 M WS urea. Two independent sets of MD simulations were also performed for Aβ16–22 oligomers in 8 M urea solution. Starting with a disordered oligomer conformation (16), which is a precursor to the antiparallel β-sheet structure in Aβ16–22 oligomer, we generated four 11-ns trajectories by using the OPLS urea model. The second set of simulations (WS model, four 10.5-ns trajectories) tested the stability of an ordered, antiparallel registry of peptides in the Aβ16–22 oligomer. For this set of simulations, we started from the structure that is “close” to the ordered antiparallel conformation of the Aβ16–22 trimer (16).
Probes of Aβ16–22 Structure. We used a number of quantities to probe urea-induced changes in Aβ16–22 monomers and oligomers (16). In addition to the time-dependent changes in the α-helix and β-strand contents, we also computed the distributions of Aβ16–22 structural states [i.e., fractions of β-strand, α-helix, and random coil (RC) conformations] as described in ref. 16. The integrity of Aβ16–22 oligomers was examined by using the distance between the centers of mass of peptides i and j,  , and the accessible surface area (ASA) A(t).
Probes of Aβ16–22 Solvation. To probe peptide–solvent hydrogen bonds (HBs) we computed pair correlation functions gH-O(r), which report the density distribution of solvent along the distance between hydrogen (H) and oxygen (O) atoms. For reference, we used the backbone atoms, which are either carbonyl oxygen OB, oxygen in Glu side chain OE, amide hydrogen HB,or hydrogens in Lys side chain HK. The solvent atom is either water oxygen OW and hydrogen HW or urea oxygen OU and hydrogen HU. The pair correlation functions were calculated by averaging over all of the saved conformations and H O pairs from all trajectories obtained in a given set of simulations. All g(r) functions are normalized to approach unity at r → ∞. The first maximum in g(r) corresponds to the formation of the first solvation shell (FSS) around a backbone atom. Unless indicated otherwise, the FSS refers to an individual backbone atom. We also define a joint FSS, which combines all FSSs of identical atoms in a peptide. Backbone FSS is a union of OB and HB joint FSSs. We count only distinct solvent atoms in joint or backbone FSSs.
To verify that the functions g(r) accurately describe HBs, we computed the fractions of FSS solvent molecules that actually make a HB with a peptide. (A HB is formed if the distance between donor D and acceptor A is ≤3.5 Å and the angle D-H... A is ≥ 120°.) On average, >90% of FSS solvent molecules are hydrogen bonded to the peptide atoms. These calculations validate the analysis of hydrogen bonds based on g(r).
Results
Urea Enhances β-Strand Content in Aβ16–22 Monomers. Our previous work showed that, in water, almost 70% of Aβ16–22 monomers are in a RC state, whereas the β-strand conformations make up 29% (16). To probe the changes in the monomer conformations in 8 M aqueous urea, we generated four 10-ns trajectories. By classifying the peptide conformations as α-helix, β-strand, and RC (16), we find that the fraction of β-strand conformations (0.53) is larger than RC state, whereas the population of α-helix is negligible (0.01). Thus, 8 M aqueous urea promotes β-strand formation at the expense of RC conformations. Simulations of Aβ16–22 monomers in 4 M urea also show the enhanced β-strand propensity, which is very similar to that at 8 M. The enhanced β-strand content in Aβ16–22 monomers has implications for the stability of oligomers (see below).
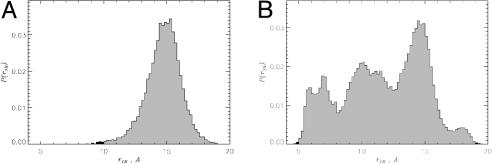
Urea-induced changes in peptide conformations are reflected in the distribution of the end-to-end distance P(r1N) (Fig. 1). The average of r1N in 8 M urea (14 Å) is larger than 〈r1N〉 = 12 Å in water. More importantly, P(r1N) in 8 M urea solution and water are drastically different (Fig. 1). In aqueous urea, P(r1N) has a single peak at ≈15 Å. In contrast, there are three maxima in water, two of which (at ≈10 and 14 Å) contain a mixture of β-strand and RC conformations. The third maximum at ≈ 6.5 Å represents only RC states. The broad distribution of P(r1N) in water is consistent with the large fraction of RC states and weaker propensity for β-strand structures. The increase in 〈r1N〉 in urea correlates with the changes in ASA, which grows from 1,159 Å2 in water to 1,219 Å2 in urea solution. Thus, various measures show that 8 M urea promotes β-strand formation in Aβ16–22 monomers.
Fig. 1.
The distributions of the end-to-end distance P(r1N) for Aβ16–22 monomer in aqueous OPLS urea (A) and water (B). Shift in P(r1N) distribution toward larger r1N indicates that Aβ16–22 peptides adopt more extended, open-like structures in urea solution.
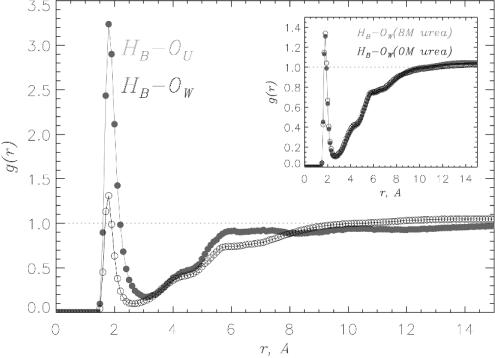
Electrostatic Interactions Between Urea and the Peptide Backbone Drive β-Strand Formation in Aβ16–22 Monomers.To probe the mechanism of enhanced β-strand propensity in 8 M urea solution, we analyzed the interactions between urea and the peptide by using a number of pair correlation functions for selected peptide and solvent atoms (Methods). To this end, we used four 10-ns trajectories for Aβ16–22 monomer in 8 M OPLS urea. The interactions between the backbone amide hydrogens HB and water OW or urea OU oxygens analyzed by using the functions gHB–OW(r) (black) and gHB–OU(r) (gray) show the preference of backbone amide groups to form HBs with urea as compared to water (Fig. 2). The maximum concentration of OU in the FSS of backbone HB (i.e., at the distance of r = 1.8 Å between HB and OU, which is typical for an optimal HB) exceeds the bulk value by a factor of 3.2, whereas the local water density exceeds the bulk value by only ≈30%. By integrating g(r) over the FSS, we find that the average number of urea and water molecules in the HB FSS is 0.43 and 0.58, respectively. Consequently, the ratio of water to urea oxygens in HB FSS is 1.3, whereas it is 4.5 in the bulk (Methods). Therefore, the relative concentration of urea in HB FSS increases by factor of 3.3. Urea also solvates backbone carbonyl groups better than water, but the preference is not as dramatic as for backbone amides.
Fig. 2.
The pair correlation functions gHB–OU(r) (gray) and gHB–OW(r) (black) probe the formation of HBs between backbone amides and urea or water molecules, respectively. Data are collected over 40,000 conformational snapshots of Aβ16–22 monomers from four 10-ns trajectories in 8 M OPLS urea solution. There is a dramatic preference for backbone amides to form HBs with urea molecules. (Inset) The functions gHB–OW(r) obtained for aqueous urea (gray) and water (black). Similarity between gHB–OW(r) plots suggests that urea causes minimal perturbation in local water structure.
To further probe the preferential solvation of Aβ16–22 backbone by urea, we monitored the number of water and urea molecules in the backbone FSS. If backbone groups (amides and carbonyls) do not have a preference to form HBs with urea, then the ratio  , where
  and
and  are the average number of water and urea molecules in backbone FSS, respectively. However, the simulations show that
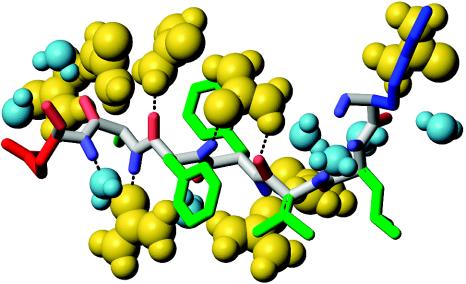
  , which implies that urea preferentially solvates the peptide backbone. The average number of solvent (water and urea) molecules in the joint HB FSS is 5.3. Because there are seven HB in Aβ16–22 peptide, approximately one urea and one water molecules make simultaneously two HBs (per solvent molecule) with backbone amides (Fig. 3). Similar computations show that, on an average, one of six urea molecules solvating Aβ16–22 backbone cross-bridges amide and carbonyl backbone groups. Interestingly, water is rarely engaged in such amide-carbonyl cross-bridging. Multiple HBs formed between single solvent molecule and Aβ16–22 backbone lend additional stability to the expanded peptide conformations.
Fig. 3.
Illustration of the mechanism of solvation of the Aβ16–22 monomer with urea (yellow) and water (light blue). The picture shows solvent molecules in the backbone FSS, which combines HB (pale blue) and OB (pale red) FSSs. Lys, Glu, and hydrophobic side chains are colored in blue, red, and green, respectively. Stable HBs between urea and amide groups result in significant increase in urea concentration near peptide backbone. A single urea molecule is shown to cross-bridge amide and carbonyl backbone groups by making two, OU–HB and HU–OB, HBs. Few representative HBs are indicated by dotted lines. Images were produced with molmol (31).
The solvated Aβ16–22 monomer in urea solution is highly mobile with rapid exchange of solvent molecules near the backbone occurring on a picoseconds time scale. The average residence time of water in the HB FSS is 9 ps, whereas the corresponding lifetime for urea–amide HB is 14 ps. These results are consistent with recent MD simulations of protein denaturation by urea (23). The HB lifetimes give another indication of the enhanced preference of urea over water for the solvation of the backbone of Aβ16–22 peptide. Although the total number of urea and water molecules near the peptide's backbone is approximately constant, their individual values undergo large, sometimes highly collective, fluctuations. Over time intervals as short as 1 ns, the number of urea molecules in the joint HB FSS changed from five to zero, whereas the number of waters increased from one to six.
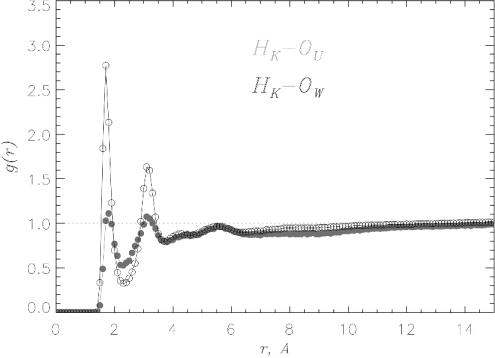
β-Strand Propensity Is Not Related to Solvation of Charged and Hydrophobic Side Chains. Aβ16–22 peptide has two charged side chains (K and E) and five contiguous hydrophobic residues. To eliminate the possibility that solvation of the side chains by urea increases β-strand propensity, we monitored the solvation of K, E, and the hydrophobic residues. Comparison of pair correlation functions gHK–OU(r) and gHK–OW(r) shows that the amide group in the lysine side chain is better solvated by water than urea (Fig. 4). The formation of the second solvation shell indicates further structuring of water around Lys side chain. By computing the number of water and urea molecules in the HK FSS we conclude that the relative (with respect to urea) concentration of water increases 50%. Similar effect is observed for the glutamic acid side chain (data not shown), in which OE oxygens accept most of HBs from water. The relative (with respect to urea hydrogens) concentration of water hydrogens in the OE FSS increases by nearly 30%. Thus, water solvates charged residues Lys and Glu to a greater extent than urea.
Fig. 4.
The pair correlation functions gHK–OU(r) (gray) and gHK–OW(r) (black) characterize the solvation of positively charged lysine side chain by urea and water, respectively. Water solvates Lys better than urea. An ordered second hydration shell around HK results in the second peak in g(r). Data were collected as for Fig. 2.
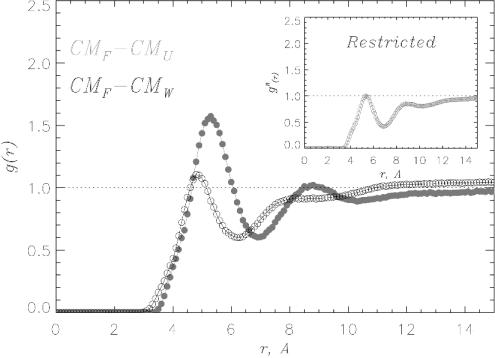
The interactions between urea and the hydrophobic side chains are probed by the pair correlation functions gCMH-CMS(r) between the centers of mass of hydrophobic side chains CMH (H = L,V,F,A) and solvent molecules CMS (S = W,U). There is an enhancement of urea concentration in the vicinity of Phe side chains relative to its bulk value, whereas the concentration of water barely changes (Fig. 5). Qualitatively similar results were obtained for other hydrophobic residues as well. To ascertain whether the well formed FSS of urea around Phe side chain is merely a consequence of the HBs between urea and Aβ16–22 backbone and not due to favorable interactions with hydrophobic residues, we computed the restricted pair correlation functions  , which exclude urea molecules interacting with the peptide backbone. In this case. the maximum urea concentration in the Phe FSS barely reaches the bulk value (Fig. 5 Inset). Therefore, formation of HBs between urea and peptide backbone automatically increases the concentration of urea around hydrophobic residues. Taken together these results show that the enhanced β-strand propensity in Aβ16–22 peptides is caused by direct hydrogen bond formation between urea oxygens and backbone amide hydrogens (21, 24–26).
Fig. 5.
The pair correlation functions gCMH–CMS(r) probe the solvation of Phe hydrophobic side chain. CMF is the center mass of Phe side chain and S is either water W (black) or urea U (gray). The excess of urea concentration in Phe FSS is entirely due to the HBs between urea and the peptide's backbone. (Inset) When gCMF–CMU(r) is restricted to the urea molecules not bound to the backbone, the excess of urea concentration is no longer observed. Data are collected as for Fig. 2.
Water Structure Is Not Perturbed by Urea. Water–backbone HBs are not altered by urea. For example, the functions gHB–OW(r) (Fig. 2 Inset) for Aβ16–22 monomers in water and aqueous 8 M urea are nearly identical. Although the average number of water molecules in the joint HB FSS decreases from 4.6 in water to 3.1 in urea solution, the characteristics of peptide backbone hydration by water remain unchanged. Similar observations were made earlier (27). This result is striking, because, on an average, there are 2.2 urea molecules in the vicinity of backbone amide groups.
Electrostatically Induced Enhancement of β-Strand Propensity in Urea Is Generic. To ascertain that the proposed mechanism of increased β-strand propensity is not an artifact of OPLS urea potentials, we used the recently developed WS urea model (22) to generate four 10.5-ns trajectories for Aβ16–22 monomers. Comparison of the results using the two models leads to the following conclusions: (i) The urea-induced propensity for β-structure is more pronounced for the WS model. The fraction of peptides in the β-strand state grows from 0.53 (OPLS) to 0.68 (WS), whereas the RC fraction decreases from 0.46 to 0.32. (ii) The solvation of Aβ16–22 peptides by WS urea is greatly enhanced. The maximum of the gHB–OU(r) function increases by a factor of 2 compared to the OPLS urea model. This results in a 5.5 times increase in the local urea concentration with respect to water in the HB FSS. The enhanced stability of urea–backbone amide HBs increases the average residence time of urea molecules in the HB FSS from 14 ps (OPLS) to 25 ps (WS). (iii) As a consequence of the enhancement of solvation of peptide backbone with WS urea, the solvation of hydrophobic residues is also increased. On an average, the WS model adds one urea molecule and eliminates about four water molecules from the joint FSS of hydrophobic residues.
Despite the quantitative differences both models are in qualitative agreement regarding the mechanism of solvation of Aβ16–22 monomers in aqueous urea. The difference between WS and OPLS models arises because of the variations in the partial charges on the urea and the treatment of Lennard–Jones interactions for urea hydrogens (Methods). The improvement in the solvation of backbone and additional enhancement of β-structure propensity for the WS urea model are exclusively traced to these modifications. Therefore, the main factor in the urea interaction with Aβ16–22 monomers is electrostatic interactions, which are responsible for the formation of HBs between urea and peptide backbone. The increase in the β-structure content is a consequence of interactions between backbone amides and urea molecules.
Urea Destabilizes Aβ16–22 Oligomers. Our previous work showed that, in water, Aβ16–22 trimers can rapidly form disordered oligomers (DO) (16). DOs are stabilized by favorable interpeptide interactions between hydrophobic residues. Because the DO structures typically do not have the required interpeptide salt bridges, they do not form antiparallel β-sheets. The low energy structures of Aβ16–22 trimers are ordered oligomers (OO), which are stabilized not only by interpeptide hydrophobic contacts, but also by the salt bridges between Lys+ and Glu– side chains. In the OO Aβ16–22 peptides are arranged in antiparallel β-sheets (16). To probe the mechanism of destabilization of Aβ16–22 oligomers in 8 M urea we used both, the DO and a structure, which rapidly converts to OO, as initial conformations.
We used DO initial structure for the Aβ16–22 trimer to generate four independent 11-ns trajectories to investigate the effect of 8 M urea solution on Aβ16–22 oligomers. There is a heterogeneity in the time scales and pathways of unbinding of peptides from the oligomer. In one of the trajectories the distances between centers of mass  and
and  increase >2-fold in 11 ns. The growth in
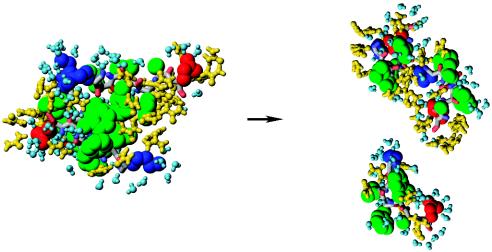
  reflects the separation of the peptide 1 from the oligomer. By the end of the trajectory (>8 ns), the remaining dimer consisting of the peptides 2 and 3 also disintegrates because all interpeptide contacts are disrupted (Fig. 6). As the oligomer breaks apart the ASA grows from ≈2,700 to 3,500 Å2 (a 30% increase). Another trajectory shows that the distances
  and
and  more than double after 2 ns because peptide 3 breaks away from the oligomer. Consequently, the ASA grows from ≈2,700 to 3,300 Å2. These results are in sharp contrast with the dynamics of Aβ16–22 oligomers in water, in which the distances between centers of mass of peptides do not change on the same time scale (16).
Fig. 6.
The disintegration of DO in one of the trajectories for 8 M OPLS urea solution is illustrated by using the same color scheme as in Fig. 3. The intact DO on the left is stabilized by interpeptide hydrophobic interactions. Ten nanoseconds later, DO is completely disrupted, when all interpeptide side chain contacts are broken and urea penetrates between Aβ16–22 peptides. Water and urea molecules form FSS around peptides. Images were produced with molmol (31).
The distances between peptides centers of mass,  , and the ASA, 〈A(t)〉, averaged over four trajectories indicate that, in 11 ns,
  increases ≈50%, whereas 〈A(t)〉 changes from <2,800 Å2 to 3,200 Å2 (14% change). In water, the ASA remains approximately constant fluctuating between 2,400 Å2 and 2,600 Å2. The orientational order in the Aβ16–22 oligomer is significantly reduced by urea. The variance in the orientational order δd (16) averaged over four trajectories in urea solution is 0.26, which is larger than δd = 0.16 for the DOs in water. These results show that urea dramatically reduces the stability of Aβ16–22 oligomers.
To verify that destabilization of Aβ16–22 oligomers in aqueous urea does not depend on the specific urea model or initial conditions, we also generated four trajectories by using the WS urea model. In these simulations the starting structure is the one which favors the formation of the OO in water (16). The OO simulations with WS urea also demonstrate dramatic increases in the average ASA and the distance between peptides centers of mass, which are similar to those observed for DO. In three of four trajectories at least one of the peptides completely breaks away from the oligomer. However, the time scale of OO disruption is larger than for DOs, which is consistent with enhanced stability of OO. For example, within 10.5 ns, OOs are partially dissolved only in two trajectories, whereas in the third trajectory it takes almost 20 ns for the peptide 3 to separate from the oligomer. By the end of WS simulations most of the interpeptide salt bridges in OO are broken. These results indicate gradual unraveling of the Aβ16–22 OOs.
The dynamics of urea-induced unraveling of the OOs is different from the disruption of the DOs. On a relatively short time scale urea transiently stabilizes the OO by promoting the interpeptide Lys–Glu salt bridges. The average probability of finding ordered dimer structures is Pd ≈ 0.30 on the time scale of 10.5 ns. For comparison, Pd computed from the simulations of Aβ16–22 OO in water, on comparable time scale, is less than 0.01. However, on a larger time scale (exceeding ≈20 ns), the OO structures are still disrupted. Thus, we conclude that urea-driven eventual denaturation of Aβ16–22 oligomers does not depend on the urea model or initial conditions. However, the pathways of the disintegration of Aβ16–22 oligomers critically depend on the starting structures.
Urea Decreases the Lifetime of α-Helical Intermediate in Aβ16–22 Oligomers. We have previously shown that the dominant pathway during the early stages of the assembly of Aβ16–22 DO in water is RC → α → β transition in which there is a transient accumulation of α-helical intermediate. Because there is a propensity in Aβ16–22 monomers to form β-strands in urea, we expect that urea should affect the lifetime and stability of the α-helical intermediate. The α-helix 〈H(t)〉 and β-strand 〈S(t)〉 contents averaged over four trajectories for Aβ16–22 oligomers in 8 M urea show that 〈H(t)〉 is initially larger than 〈S(t)〉. However, within 1 ns, 〈H(t)〉≈〈S(t)〉 and, on larger time scales, β-structure content rapidly grows and levels off at ≈0.4, whereas the α-helical content decreases and stays constant at ≈0.1.
These results are qualitatively similar to the assembly dynamics in water (16). However, comparison of α → β transitions in water and 8 M urea demonstrates that urea reduces the amount of transiently accumulated α-helix structure (〈H(t = 0) ≳ 0.4 in water, but ≲ 0.3 in 8 M urea). More importantly, α-helical intermediate converts into β-strand structure faster in urea. It takes <1 ns for 〈H(t)〉 to fall below 〈S(t)〉 in aqueous urea, as opposed to ≈5 ns in water (16). Simulations of Aβ16–22 OO using the WS urea model are in qualitative agreement with those based on the OPLS model. The WS urea model leads to even faster α → β transition and smaller accumulation of an α-helical intermediate than predicted by the OPLS model.
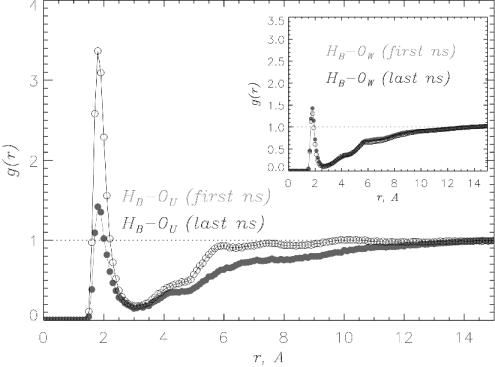
Hydrogen Bond Formation Between Urea and Peptide Backbone Destabilizes Aβ16–22 Oligomers. To probe the molecular mechanism of the disruption of Aβ16–22 oligomers by urea, we compute several pair correlation functions during the first and the last 1-ns segments of 11-ns MD trajectories for DOs. The function gHB–OW(r) remains virtually unchanged on the 11-ns time scale (Fig. 7 Inset, data in black), which implies that water does not play an important role in the oligomer denaturation. In contrast, the interactions of Aβ16–22 oligomers with urea show strong time dependence. Comparison of the solvation of peptide backbone amides by urea during the first and last 1-ns intervals (Fig. 7) shows that the maximum concentration of urea near amide hydrogens HB increases by a factor of 2.4. Backbone solvation with urea also enhances the solvation of hydrophobic residues. Accordingly, the concentration of urea in the FSS of Phe increases by 50% in 11 ns.
Fig. 7.
The pair correlation functions gHB–OU(r) (for the first and last nanoseconds in gray and black, respectively) are computed by using 11-ns simulations of Aβ16–22 DOs in 8 M OPLS urea solution. The plots offer dramatic illustration of the “invasion” of urea molecules into Aβ16–22 oligomers. The concentration of urea near peptide's backbone amides more than doubles in 11 ns. In contrast, the hydration of peptide backbone illustrated by gHB–OW(r) in Inset is virtually unchanged.
The radial distributions of water and urea molecules with respect to the center of mass of the oligomer gCM0–CMS(r) (S = W,U) offer a striking illustration of the urea-driven penetration of solvent into Aβ16–22 DO (Fig. 8). In the first nanosecond, the Aβ16–22 oligomer interior is essentially dry (Fig. 8 Left). The concentrations of urea and water approach their bulk values at r ≳ 12 Å, which roughly corresponds to the dimensions of the oligomer. After 11 ns, a “wave” of urea molecules penetrates into the oligomer structure (Fig. 8 Right). The exclusion of water from the oligomer interior observed in the simulations of Aβ16–22 oligomers in water (16) (solid curve in Fig. 8) shows no time dependence. Therefore, the interior of Aβ16–22 oligomer in water remains dry. The crucial difference between the simulations in water and 8 M urea is related to a dramatic solvent (largely, urea) “invasion” into Aβ16–22 oligomers in aqueous urea. These results show that the mechanism of oligomer destabilization is similar to the urea solvation of Aβ16–22 monomer, which leads to enhanced β-structure content.
Fig. 8.
The pair correlation functions gCM0–CMW(r) (black) and gCM0–CMU(r) (gray) describe solvent penetration into Aβ16–22 DO in 8 M OPLS urea solution (CMO,CMW, and CMU are the centers of mass of the oligomer, water, and urea molecules, respectively). During the first nanosecond, Aβ16–22 oligomer is generally devoid of solvent (Left, average over four trajectories). Ten nanoseconds later (Right, data for one of the trajectories), the wave of urea and water molecules penetrates the Aβ16–22 oligomer, compromising its stability. Simulations of Aβ16–22 oligomers in water show no signs of solvent penetration as the oligomer remains dehydrated during 10.7-ns MD trajectories (solid curve at Left).
Discussion and Conclusions
Here, we report the MD simulations of Aβ16–22 peptides and oligomers in aqueous 8 M urea solution. By using Aβ16–22 monomers and oligomers, different initial structures, and two urea models, we have obtained a number of results regarding the effect of urea on Aβ16–22 monomers and oligomers.
Because of preferential (with respect to water) solvation of the peptide backbone by urea, Aβ16–22 monomers undergo RC → β-strand transition in aqueous urea solution. Compared to water, in which RC state dominates, the majority of conformations of Aβ16–22 monomers in urea are classified as β-strand. Formation of HBs between urea and backbone amides increases the relative (with respect to water) concentration of urea near peptide backbone by 3- to 4-fold with respect to the bulk level (depending on the specific urea model). This effect, which is electrostatic in nature, is the dominant contribution to urea–protein interactions. Because the increase in urea concentration near hydrophobic residues is linked to the formation of HBs between urea and the peptide backbone, the urea-induced change in hydrophobic interactions plays a secondary role. These results are in accord with earlier experimental and theoretical findings (21, 24–26).
Urea molecules penetrate the interior of Aβ16–22 oligomers by making HBs with the peptide's backbone. As a consequence, urea coats hydrophobic side chains, increases the solvent exposure of oligomers, and compromises their stability. Partial or complete disintegration of Aβ16–22 oligomers is accompanied by a dramatic growth in the ASA. The dynamics of Aβ16–22 oligomers disruption is complex and involves a series of structural changes. Urea accelerates the α → β transition and destabilizes the transient α-helical intermediate, which is an on-pathway species emerging before the antiparallel β-sheet formation in water (16). Urea-induced β-strand bias temporarily elevates the population of ordered antiparallel dimer structures that are stabilized by salt bridges. On longer time scales, the oligomers, regardless of the initial structures, disintegrate, because Aβ16–22 monomers solvated with urea have lower free energy than the intact oligomers. As shown in ref. 16, electrostatic interactions alone cannot maintain the stability of Aβ16–22 oligomer when hydrophobic interactions are compromised.
Our results show that urea has two opposing effects on Aβ16–22 oligomers. Urea destabilizes Aβ16–22 oligomers, but it also increases the β-strand content in the monomer. At small concentration, urea is likely to accelerate the amyloid deposition, because the weak denaturing effect is not sufficient to destabilize the oligomers. However, at high urea concentrations, Aβ16–22 oligomers are destabilized, which, in turn, blocks amyloid fibril formation. Because of the opposing effects, there must be an optimal concentration of urea, at which the rates of amyloidogenesis are maximum. This conclusion is consistent with the prediction of a “turnover” in the rates of amyloid assembly as a function of denaturant concentration (28), which was based on the kinetic partitioning mechanism for monomeric folding (29). The “turnover” was also observed in the recent experimental study of Hamada and Dobson (30), who examined the effect of urea on the rates of amyloid deposition for lysozyme. Because the mechanisms of promotion of β-strand propensity in Aβ16–22 monomers and the destabilization of oligomers are likely to be generic, amyloid deposition rates should, in general, show nonmonotonic dependence on urea concentration, with a maximum occurring near the concentration of equilibrium between monomeric and oligomeric species.
Acknowledgments
This work was supported in part by National Institutes of Health Grant IR01 NS41356-01.
This paper was submitted directly (Track II) to the PNAS office.
Abbreviations: Aβ, amyloid β; MD, molecular dynamics; OPLS, optimized potentials for liquid simulations; WS, Weerasinghe and Smith; RC, random coil; ASA, accessible surface area; HB, hydrogen bond; FSS, first solvation shell; DO, disordered oligomers; OO, ordered oligomers.
References
- 1.Selkoe, D. J. (2003) Nature 426, 900–904. [DOI] [PubMed] [Google Scholar]
- 2.Koo, E. H., Lansbury, P. T. & Kelly, J. W. (1999) Proc. Natl. Acad. Sci. USA 96, 9989–9990. [DOI] [PMC free article] [PubMed] [Google Scholar]
- 3.Selkoe, D. J. (2002) Science 298, 789–791. [DOI] [PubMed] [Google Scholar]
- 4.Kikitadze, M. D., Bitan, G. & Teplow, D. B. (2002) J. Neurosci. Res. 69, 567–577. [DOI] [PubMed] [Google Scholar]
- 5.Kayed, R., Head, E., Thompson, J. L., McIntire, T. M., Milton, S. C., Cotman, C. W. & Glabe, C. G. (2003) Science 300, 486–489. [DOI] [PubMed] [Google Scholar]
- 6.Thirumalai, D., Klimov, D. K. & Dima, R. I. (2003) Curr. Opin. Struct. Biol. 13, 146–159. [DOI] [PubMed] [Google Scholar]
- 7.Dobson, C. M. (2003) Nature 426, 884–890. [DOI] [PubMed] [Google Scholar]
- 8.Hardy, J. & Selkoe, D. J. (2002) Science 297, 353–356. [DOI] [PubMed] [Google Scholar]
- 9.Lansbury, P. T., Costa, P. R., Griffiths, J. M., Simon, E. J., Auger, M., Halverson, K., Kocisko, D. A., Hendsch, Z. S., Ashburn, T. T., Spencer, R., et al. (1995) Nat. Struct. Biol. 2, 990–998. [DOI] [PubMed] [Google Scholar]
- 10.Burkoth, T. S., Benzinger, T., Urban, V., Morgan, D. M., Gregory, D. M., Thiyagarajan, P., Botto, R. E., Meredith, S. C. & Lynn, D. G. (2000) J. Am. Chem. Soc. 122, 7883–7889. [Google Scholar]
- 11.Balbach, J. J., Ishii, Y., Antzutkin, O. N., Leapman, R. D., Rizzo, N. W., Dyda, F., Reed, J. & Tycko, R. (2000) Biochemistry 39, 13748–13759. [DOI] [PubMed] [Google Scholar]
- 12.Tycko, R. (2003) Biochemistry 42, 3151–3159. [DOI] [PubMed] [Google Scholar]
- 13.Kirkitadze, M. D., Condron, M. M. & Teplow, D. B. (2001) J. Mol. Biol. 312, 1103–1119. [DOI] [PubMed] [Google Scholar]
- 14.Lee, J. P., Stimson, E. R., Ghilardi, J. R., Mantyh, P. W., Lu, Y. A., Felix, A. M., Llanos, W., Behbin, A., Cummings, M., Criekinge, M. V., et al. (1995) Biochemistry 34, 5191–5200. [DOI] [PubMed] [Google Scholar]
- 15.Kammerer, R. A., Kostrewa, D., Zurdo, J., Detken, A., Garcia-Echeverria, C., Green, J. D., Muller, S. A., Meier, B. H., Winkler, F. K., Dobson, C. M. & Steinmetz, M. O. (2004) Proc. Natl. Acad. Sci. USA 101, 4435–4440. [DOI] [PMC free article] [PubMed] [Google Scholar]
- 16.Klimov, D. K. & Thirumalai, D. (2003) Structure (London) 11, 295–307. [DOI] [PubMed] [Google Scholar]
- 17.Ma, B. & Nussinov, R. (2002) Proc. Natl. Acad. Sci. USA 99, 14126–14131. [DOI] [PMC free article] [PubMed] [Google Scholar]
- 18.Gsponer, J., Haberthur, U. & Caflisch, A. (2003) Proc. Natl. Acad. Sci. USA 100, 5154–5159. [DOI] [PMC free article] [PubMed] [Google Scholar]
- 19.Elber, R., Roitberg, A., Simmerling, C., Goldstein, R., Li, H., Verkhiver, G., Keasar, C., Zhang, J. & Ulitsky, A. (1994) Comp. Phys. Commun. 91, 159–189. [Google Scholar]
- 20.Duffy, E. M., Kowalczyk, P. J. & Jorgensen, W. L. (1993) J. Am. Chem. Soc. 115, 9271–9275. [Google Scholar]
- 21.Tobi, D., Elber, R. & Thirumalai, D. (2003) Biopolymers 68, 359–369. [DOI] [PubMed] [Google Scholar]
- 22.Weerasinghe, S. & Smith, P. E. (2003) J. Phys. Chem. 107, 3891–3898. [Google Scholar]
- 23.Bennion, B. J. & Daggett, V. (2003) Proc. Natl. Acad. Sci. USA 100, 5142–5147. [DOI] [PMC free article] [PubMed] [Google Scholar]
- 24.Robinson, D. R. & Jencks, W. P. (1965) J. Am. Chem. Soc. 87, 2462–2470. [DOI] [PubMed] [Google Scholar]
- 25.Zou, Q., Habermann-Rottinghous, S. M. & Murphy, K. P. (1998) Proteins Struct. Funct. Genet. 31, 107–115. [PubMed] [Google Scholar]
- 26.Wallqvist, A., Covell, D. G. & Thirumalai, D. (1998) J. Am. Chem. Soc. 120, 427–428. [Google Scholar]
- 27.Tsai, J., Gerstein, M. & Levitt, M. (1996) J. Chem. Phys. 104, 9417–9430. [Google Scholar]
- 28.Massi, F. & Straub, J. E. (2001) Proteins 42, 217–229. [DOI] [PubMed] [Google Scholar]
- 29.Guo, Z. & Thirumalai, D. (1995) Biopolymers 36, 83–103. [Google Scholar]
- 30.Hamada, D. & Dobson, C. M. (2002) Prot. Sci. 11, 2417–2426. [DOI] [PMC free article] [PubMed] [Google Scholar]
- 31.Koradi, R., Billeter, M. & Wuthrich, K. (1996) J. Mol. Graphics. 14, 51–55. [DOI] [PubMed] [Google Scholar]


