Abstract
Counterions play a significant role in DNA structure and function, and molecular dynamics (MD) simulations offer the prospect of detailed description of the dynamical structure of ions at the molecular level. However, the motions of mobile counterions are notably slow to converge in MD on DNA. Obtaining accurate and reliable MD simulations requires knowing just how much sampling is required for convergence of each of the properties of interest. To address this issue, MD on a d(CGCGAATTCGCG) duplex in a dilute aqueous solution of water and 22 Na+ counterions was performed until convergence was achieved. The calculated first shell ion occupancies and DNA–Na+ radial distribution functions were computed as a function of time to assess convergence, and compared with relaxation times of the DNA internal parameters shift, slide, rise, tilt, roll, and twist. The sequence dependence of fractional occupancies of ions in the major and minor grooves of the DNA is examined, and the possibility of correlation between ion proximity and DNA minor groove widths is investigated.
Counterion structures and motions have been implicated in recent ideas about sequence effects on DNA structure axis curvature and ligand-induced bending (1–7). In each of these theories, the local interactions of ions with polyionic DNA complement the effects described by counterion condensation (CC) theory (8) and the Poisson Boltzmann (PB) equation (9, 10). Although the effect of ions and ionic strength on DNA structural and thermodynamics properties are implied from diverse experiments, obtaining a fully detailed molecular model of the ions interacting with DNA based on these results is usually not possible. Oligonucleotide crystal structures reveal only the few ions that are ordered and can be unequivocally assigned. The positions of ions around DNA are generally underdetermined in experiments based on biophysical methods. Recent studies requiring this information have turned to large-scale molecular dynamics (MD) simulations to obtain computational models (11). However, in MD modeling, the complex aggregate of oligonucleotide, water, counterions, and coions is slow to fully stabilize, and ion motions are a rate-determining step in total convergence (12). Current reviews of MD on DNA (12–14) indicate that all simulations to date are based on considerably shorter trajectories. Therefore, we initiated a project aimed at obtaining demonstrably converged results on ion structures and motions. A related question is the sensitivity of the fast internal motions of the DNA to ion convergence. Our analysis is based on an MD simulation on the prototype B-form duplex d(CGCGAATTCGCG) in a dilute aqueous solution of water and Na+ counterions carried out on a supercomputer until the point of convergence could be reliably determined. The trajectories are used to study the sequence dependence of ion distributions, the DNA–Na+ radial distribution functions, and the sensitivity of groove widths to ion proximity. The simulations are used as a basis for a comparison of results from MD on DNA with corresponding indices from CC and PB theory.
Background
The stability of the double helical structure of DNA is well known to depend on the presence of counterions and water (15). The counterions provide electroneutrality to the system and mitigate the electrostatic repulsion between anionic phosphates of the DNA via mean field effects (the ion atmosphere) and sequence-dependent contact or water-mediated structures. Solvent water molecules serve to insulate charges by means of dielectric screening and are thought to play a structural role in the stability of the double helix as well (16). From this, it follows that a proper description of the ions around DNA is essential for accurate MD modeling of the dynamical structure of DNA. An extensive literature on the theoretical treatment of the counterion structure around DNA has developed based on CC theory (8) and PB-based continuum electrostatics (9, 10, 17). The CC model leads to a description of ion atmosphere of DNA in terms of site- and territorial-bound ions and the idea that “condensed” monovalents, within 7 Å of the DNA, neutralize ≈76% of the DNA charge. Continuum electrostatics is based on the distribution of a highly discretized model of charges, which satisfies the PB equation for a given ionic strength (17, 18). The ability to obtain an all-atom model of the DNA, water, and counterions from molecular simulation is of a much more recent vintage, and required force field development (19), new methodology (20), and access to the latest generation of research supercomputers. MD simulation has now been applied successfully to a number of DNA oligonucleotides in solution (13, 14, 21–23). In particular, close accord between MD results and observed NMR NOESY peak volumes and structures obtained for d(CGCGAATTCGCG)2, with the addition of residual dipolar couplings, has been established (24).
The oligomer d(CGCGAATTCGCG)2 was the subject of the first x-ray crystal structure of a B-form DNA (25). Refinement at 2.2 Å did not identify any small counterions in close proximity to the DNA. This observation suggested a model of DNA solvation in which counterions move fairly freely, and a spine of bound water molecules in the minor groove provides additional stability to the double helix (26). An early crystal structure of the CpG dinucleotide (27) showed an ion bound in the minor groove region, suggesting that ions could play a structural role. MD simulations on d(CGCGAATTCGCG)2 raised the possibility that Na+ counterions could occupy positions within the minor groove previously attributed to water (28). NMR evidence (3, 29, 30) supported the idea of ions in the minor groove, and notable charge effects on gel migration rates of A-tract containing DNA have been reported (31). Williams and coworkers (32) reported a crystal structure of the d(CGCGAATTCGCG) duplex at 1.4 Å that was interpreted in terms of fractional occupancy of ions in the grooves of DNA. Subsequently, the ions Rb+ and Tl+ have been reported crystallographically in the spine of hydration at the ATT region (1, 33, 34), and Rb+ was located in the minor groove (35, 36). The issue was revisited by Dickerson et al. (37) in a high-resolution crystal structure determination that argued against ions in the minor groove, and the Williams group responded (38). The crystallographic community is not in total accord on this issue. Soler-Lopez et al. (39) contributed additional perspectives on Mg2+ ions in d(GCGAATTCG)2 and spoke to the issue as well. NMR experiments examining the exchange of water and ions in and out of the grooves of DNA report that ion intrusion is a relatively rare event, but once it does occur, the ion can remain for up to 50 ns (3).
The possibility of environmental ions contributing to sequence-dependent structure and axis curvature of DNA (1, 5, 40) remains an intriguing hypothesis, and the role of groove-bound ions in DNA structure compared with the intrinsic structural preferences of the DNA has been debated (2, 4, 41). There is significant NMR evidence for DNA structural perturbations sensitive to ions (3, 42), but another study reports that Mg2+ and K+ titrations do not significantly perturb the structure (43). The relationship between DNA curvature and phosphate neutralization has been studied (1, 44, 45), and positive correlations suggest that partial neutralization of phosphates by site-bound ions could well have an effect. Feig and Pettit (46) found Na+ residency times of ≈2 ns in 10 ns MD on DNA and 20% occupancy in the AATT region. McConnell and Beveridge (47) reported MD on DNA oligonucleotides containing A-tracts and found fractional occupancies in the minor groove to be ≈10%, but noted a possible sensitivity of axis curvature to ion proximity in the A-tract region. Mocci and Saba (48) reported MD on A4T4 and T4A4 motifs and found ions resided longer at the ApT step than TpA. Hamelberg et al. (49) carried out MD and reported a positive correlation between ion proximity and minor groove width. Because groove narrowing is a well known feature of A-tracts (50), a linkage of ion effects to A-tract induced axis curvature is implied. Stefl and Koca (51) studied ion atmosphere effects on the A-to-B transition of DNA with MD. Rueda et al. (52) provide a recent detailed review of this issue and new results on locating long-lived binding sites in AATT tracts, but the question of spontaneous access of Na+ to this site is still a matter of debate.
Ion convergence in MD on DNA in solution was examined in a recent review by Cheatham and Young (12), based on first shell ion occupancies calculated from MD on DNA on the d(CGCGAATTCGC) duplex (53, 54). Because this sequence is palindromic, ion occupancies on the two different strands of the DNA should display that symmetry as well, and deviation from it in the calculated ion occupancies is a highly sensitive test of MD convergence. The results showed that, in a 14-ns MD trajectory, although the DNA internal parameters were quite stable, the ion occupancies are far from convergence. More recently, a 20-ns study of EcoRI has emerged, but issues of ion convergence are not taken up (55). Rueda et al. (52) also comment on the ion convergence problem. This situation motivated us to perform a simulation up to the point that convergence occurs and to consider three basic issues: (i) the extent of convergence of mobile counterion motions, (ii) the effect of ion convergence on the MD calculated conformational and helicoidal parameters of DNA, and (iii) the effect of ions on the width of the minor groove of the DNA.
Methods
The starting point for the extended simulation was initially a canonical B-form structure of d(CGCGAATTCGCG)2. The system for simulation was comprised of DNA and 3,949 water molecules together with 22 Na+ cations in a cubic cell with periodic boundary conditions. Long range interactions were treated by using the particle mesh Ewald method (20). The simulation was performed by using the amber 7.0 suite of programs (56) and the parm94 force field (19). Intermolecular interactions involving sodium ions use the Aqvist parameters (57). MD trajectories for this system were obtained at a sampling rate of ≈0.3 ns per day on the eight-multiprocessor SGI Origin2000 machine at the National Center for Supercomputer Applications.
In the analysis of results, the conventional measures of stability and convergence based on root mean square deviations of the MD structures from the starting configuration and from canonical forms of DNA structures (58) were considered. The conformational and helicoidal parameters of the DNA structures were calculated by using curves (59). Time correlation functions and relaxation times for the DNA structural parameters were computed by using methodology as described at www.itl.nist.gov/div898/handbook. The amber utility program ptraj was used to calculate interatomic distance for the determination of minor groove widths.
Calculation of the ion occupancies with respect to DNA atoms was carried out by using the proximity method (60, 61), in which each ion in each MD snapshot is assigned to a DNA atom based on closest approach. Ion occupancies for each atom are then calculated as ensemble averages of the populations within a cutoff distance of 5 Å, chosen as a value that well encompasses the first two solvation shells of ions around DNA. Simple summation of ion occupancies by atom leads to the number of ions assigned to each nucleotide by this method, and averages follow straightforwardly. DNA–Na+ distribution functions were calculated from DNA–ion distances averaged over all surface atoms of the inner 10 base pairs of the dodecamer sequence. The diffusion coefficient of the ions was calculated from the positional correlation function and Einstein's equation. Because the issue of ions presents a worst case scenario with respect to convergence, the emphasis in this article is on the MD description of ion motions and the immediate implications thereof.
Results
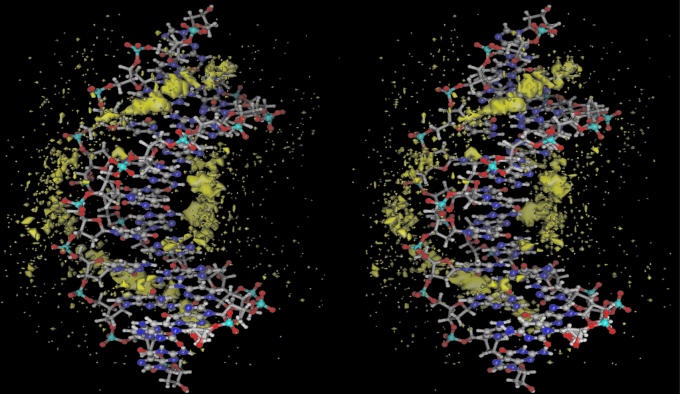
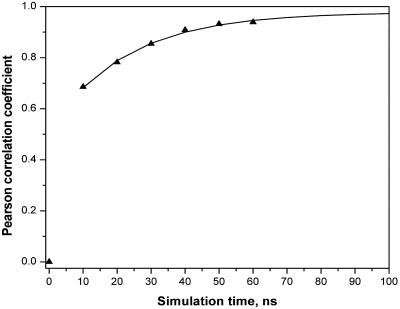
The MD trajectory was extended until a reasonable degree of convergence was obtained. The simulation length required to characterize this problem fully required 60 ns of MD and required ≈6 months of background computer time. A structural presentation of the calculated counterion density is shown as a superposition of MD snapshots in Fig. 1. The calculated sodium ion diffusion constant is on the order of 10–5 cm2/s, within a reasonable range of that for aqueous Na+ (62). The MD calculated ion occupancies for each of the DNA atoms is shown in Fig. 2. The results for the two strands of the duplex are displayed as positive and negative values and the extent of palindromic symmetry is immediately evident from the degree of mirror image symmetry with respect to the horizontal. As a point of reference, a statistical comparison of the ion occupancies of the two strands at 14 ns resulted in a correlation coefficient r = 0.69. After 60 ns, the correlation had improved to r = 0.94. The calculated correlation coefficient for the simulation as a function of time is plotted in Fig. 3. Extrapolation of the 60-ns results indicates that a correlation coefficient of 0.97 would be reached in ≈100 ns in the absence of quasiergodic problems.
Fig. 1.
Regions of high Na+ density around d(CGCGAATTCGCG)2 obtained as a superposition of 6,007 snapshots corresponding to 60-ns MD.
Fig. 2.
Calculated ion occupancies by atom for the two strands d(CGCGAATTCGCG)2. Results for one single strand are presented as positive values on the ordinate and results for the other single strand are presented as negative values of the ordinate. Because the sequence is palindromic, convergence in the ion motions can be assessed qualitatively by the extent of mirror image symmetry in this plot and quantitatively by the correlation coefficient between the two single strand distributions.
Fig. 3.
Correlation coefficient between calculated ion occupancies of the two single strands of d(CGCGAATTCGCG)2 as a function of time, by atom. Triangles indicate MD results from 0 to 60 ns. The solid line indicates exponential fit of the data from 10 to 60 ns and extrapolation to 100 ns.
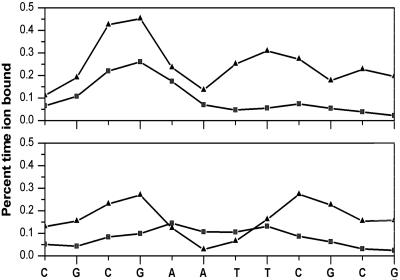
The calculated ion distributions from the MD at 60 ns were analyzed with respect to the base pair sequence of the DNA, and the results as a function of base pair step are shown in Fig. 4 (see also Fig. 1). The calculated occupancies of sodium ions in the grooves of the DNA are clearly seen to be sensitive to sequence. In the major groove, the preferred sites for ions are the G4:C21 and C9:G16 and are indicated to be 15% occupied by ions and 85% by water molecules. In the minor groove, the ion occupancy at the ApT step, an electronegative pocket (63), is <10%. Although electrostatic calculations favor the ApT pocket (63), apparently, the occupation such a small region of space comes with a high entropic cost and is not favored in free energy. The preferred sites in the minor groove are the 5′ and 3′ junctions of the AATT and CGCG with fractional occupancies of ≈30%. Thus, we find that the region of the 5′ and 3′ junction are the most favored positions for ions in both major and minor grooves (see Fig. 1). These regions are also the locus of axis deformation in the MD and the crystal structure of the DNA, lending support to the idea that ions may be implicated in the mechanism of axis curvature. This finding is consistent with the ideas of Hud and Plavec (5) for sequence-directed curvature in which A-tract DNA, which by their definition includes the AATT sequence, localizes ions into the minor groove at positions close to those found in the MD. However, cause and effect with respect to ions and DNA deformations and axis curvature remain to be established with certainty (23).
Fig. 4.
MD calculated ion occupancies as a function of sequence, by nucleotide. Minor (triangles) and major (squares) groove occupancies are shown for 14 (Upper) and 60 (Lower) ns of the simulation.
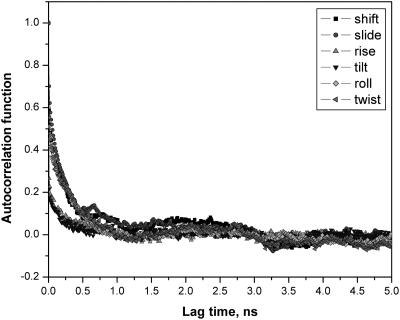
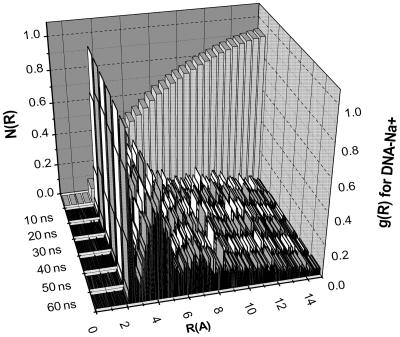
We next address the very important question of whether this means that all MD simulations on DNA need to be ≈100 ns, or whether shorter trajectories can still provide an adequate description of the dynamical structure of the DNA. To address this, time correlation functions for base pair step shift, slide, rise, tilt, roll, and twist and their corresponding relaxation times were calculated (Fig. 5). Results given are for G4pA5; others are similar. The helicoidal parameters are seen to settle much more rapidly than ion occupancies, with the relaxation times for the variables studies all ≈0.5 ns. The requisite inversion symmetry of the helicoidal parameters is observed (64). Overall, the MD values for DNA parameters appear to be well stabilized after 3–5 ns of MD, a currently quite practical trajectory length for applications and consistent with the rule of thumb that MD sampling of a variable should be ≈10 times the relaxation time. A plausible explanation is that the dynamical structure of the DNA per se stabilizes well under the influence of the mean field of the ion distributions, and that the extended sampling that we carried out was being applied to describing fine details or granularity in the motions of mobile counterions. To check this idea, DNA–Na+ radial distribution function as a function of time was calculated (Fig. 6). This quantity is clearly stable at ≈5nsof MD and shows no significant changes in further extension of the trajectory. The peaks in the distribution indicate significant DNA–ion correlations that are assumed to be negligible in continuum electrostatics. The calculated fraction of DNA charge neutralized by ions within the Manning radius of ≈9 Å is 0.76, a totally independent confirmation of a well known result of 0.76 obtained from counterion condensation theory (8). The distributions suggest a physical interpretation of the Manning radius as the distance within which ions have structure detectable to the DNA, i.e., indicated by peaks in the radial distribution function.
Fig. 5.
MD calculated correlation functions for the G4pA5 base pair step parameters shift, slide, rise, tilt, roll, and twist of the d(CGCGAATTCGCG)2.
Fig. 6.
Calculated DNA–Na+ cylindrical distribution functions g(R) as a function of radial distance R and time on an accumulated basis. Running coordination number N(R) expressed as the fraction of the total number of ions as a function of distance from the DNA is shown.
The MD results do support the idea of sequence-dependent fractional occupancy of ions in the major and minor grooves of DNA. To investigate whether the proximity of ions affects minor groove width, the correlation was examined based on the 60-ns level trajectory. The analysis is based on simply extending the proximity criterion to a definition of major and minor groove atoms and summing the results. The highest correlation coefficient for minor groove width and closest ion was 0.10, indicating essentially no correlation between these quantities in the MD model. However, we found that selecting a window of simulation time of 10 ns, a time scale on which the ions are clearly not converged, a correlation coefficient as high as 0.73 for the T7-G22 minor groove width, nearly an order of magnitude greater than that of the overall simulation for that step, could be obtained. This finding indicates that MD calculated properties sensitive to the granularity of ion distributions might be susceptible to convergence artifacts if sampling is not adequate.
Summary and Conclusions
MD on d(CGCGAATTCGCG)2 in a dilute aqueous solution of water and sodium counterions was performed until ion convergence was achieved. A correlation coefficient between ion occupancies of the two palindromic strands of 0.94 was reached at 60 ns for the calculated ion occupancies of symmetrically equivalent sites on two strands of a palindromic DNA duplex. The time correlation functions and relaxation times for all of the internal structural variables of the DNA were calculated. The results show that the relaxation times of the internal structural parameters in MD on DNA are much shorter than those of ion motions. These internal structural parameters are well converged at ≈5 ns, and insensitive to ion convergence beyond this point. The maximum fractional occupancies of ions in the major and minor groove regions of the DNA were found to be ≈15% and 30%, respectively, and localized at or near the junctions of the AATT and CGCG tracts. The correlation between ion proximity and DNA major and minor groove widths was examined and found to be negligibly small when analyzed over 60 ns of MD. However, false positives can be obtained when analyzing segments of the total trajectory even as large as 10 ns. Analysis of the calculated DNA–ion distribution functions with respect to time indicates converges of this property within 5 ns. This property reflects mean field effects of the ion atmosphere, indicating that the additional sampling required for convergence of ion occupancies is aimed at the fine granularity of the distribution rather than mean field effects. The MD results suggest that counterion condensation in CC theory refers to the region in which the DNA–ion radial distribution shows evidence of structure. The DNA–ion radial distribution function exhibits marked shell structure indicating small ion correlations, an effect not captured by PB continuum electrostatics.
Acknowledgments
This research was supported by National Institutes of Health Grant GM-37909 (to D.L.B.) and supercomputer time from the National Center for Supercomputer Applications under the Partnerships for Advanced Computational Infrastructure program. K.M.T. acknowledges support from National Institutes of Health Graduate Traineeship in Molecular Biophysics Grant GM-08271 (to Wesleyan University).
Author contributions: S.Y.P. performed research and analyzed data; and K.M.T. and D.L.B. designed research and wrote the paper.
Abbreviations: CC, counterion condensation; PB, Poisson Boltzmann; MD, molecular dynamics.
Note Added in Proof. While this article was being reviewed, a related article comparing the behavior of Na+ and K+ counterions around DNA was published (65).
References
- 1.Williams, L. D. & Maher, L. J., III (2000) Annu. Rev. Biophys. Biomol. Struct. 29, 497–521. [DOI] [PubMed] [Google Scholar]
- 2.Hud, N. V. & Polak, M. (2001) Curr. Opin. Struct. Biol. 11, 293–301. [DOI] [PubMed] [Google Scholar]
- 3.Denisov, V. P. & Halle, B. (2000) Proc. Natl. Acad. Sci. USA 97, 629–633. [DOI] [PMC free article] [PubMed] [Google Scholar]
- 4.McFail-Isom, L., Sines, C. C. & Williams, L. D. (1999) Curr. Opin. Struct. Biol. 9, 298–304. [DOI] [PubMed] [Google Scholar]
- 5.Hud, N. V. & Plavec, J. (2003) Biopolymers 69, 144–158. [DOI] [PubMed] [Google Scholar]
- 6.Record, M. T., Jr., Anderson, C. F. & Lohman, T. M. (1978) Q. Rev. Biophys. 11, 103–178. [DOI] [PubMed] [Google Scholar]
- 7.Misra, V. K., Hecht, J. L., Sharp, K. A., Friedman, R. A. & Honig, B. (1994) J. Mol. Biol. 238, 264–280. [DOI] [PubMed] [Google Scholar]
- 8.Manning, G. S. (1978) Q. Rev. Biophys. 11, 179–246. [DOI] [PubMed] [Google Scholar]
- 9.Anderson, C. F. & Record, M. T., Jr. (1982) Annu. Rev. Phys. Chem. 33, 191–222. [Google Scholar]
- 10.Honig, B. & Nicholls, A. (1995) Science 268, 1144–1149. [DOI] [PubMed] [Google Scholar]
- 11.Jayaram, B. & Beveridge, D. L. (1996) Annu. Rev. Biophys. Biomol. Struct. 25, 367–394. [DOI] [PubMed] [Google Scholar]
- 12.Cheatham, T. E., III, & Young, M. A. (2000) Biopolymers 56, 232–256. [DOI] [PubMed] [Google Scholar]
- 13.Beveridge, D. L. & McConnell, K. J. (2000) Curr. Opin. Struct. Biol. 10, 182–196. [DOI] [PubMed] [Google Scholar]
- 14.Orozco, M., Perez, A., Noy, A. & Luque, F. J. (2003) Chem. Soc. Rev. 32, 350–364. [DOI] [PubMed] [Google Scholar]
- 15.Saenger, W. (1984) Principles of Nucleic Acid Structure (Springer, New York).
- 16.Dickerson, R. E., Kopka, M. L. & Pjura, P. (1985) Biol. Macromol. Assemblies 2, 37–126. [Google Scholar]
- 17.Jayaram, B., Sharp, K. A. & Honig, B. (1989) Biopolymers 28, 975–993. [DOI] [PubMed] [Google Scholar]
- 18.Hecht, J. L., Honig, B., Shin, Y.-K. & Hubbell, W. L. (1995) J. Phys. Chem. 99, 7782–7786. [Google Scholar]
- 19.Cornell, W. D., Cieplak, P., Bayly, C. I., Gould, I. R., Merz, K. M., Jr., Ferguson, D. M., Spellmeyer, D. C., Fox, T., Caldwell, J. W. & Kollman, P. A. (1995) J. Am. Chem. Soc. 117, 5179–5197. [Google Scholar]
- 20.Darden, T., York, D. & Pedersen, L. (1993) J. Chem. Phys. 98, 10089–10092. [Google Scholar]
- 21.Cheatham, T. E., III, & Kollman, P. A. (2000) Annu. Rev. Phys. Chem. 51, 435–471. [DOI] [PubMed] [Google Scholar]
- 22.MacKerell, A. D., Jr., Banavali, N. & Foloppe, N. (2000) Biopolymers 56, 257–265. [DOI] [PubMed] [Google Scholar]
- 23.Beveridge, D. L., Dixit, S. B., Barreiro, G. & Thayer, K. M. (2004) Biopolymers 73, 380–403. [DOI] [PubMed] [Google Scholar]
- 24.Arthanari, H., McConnell, K. J., Beger, R., Young, M. A., Beveridge, D. L. & Bolton, P. H. (2003) Biopolymers 68, 3–15. [DOI] [PubMed] [Google Scholar]
- 25.Drew, H. R., Wing, R. M., T. Takano, C. Broka, S. Tanaka, Itikura, K. & Dickerson, R. E. (1981) Proc. Nat. Acad. Sci. USA 78, 2179–2183. [DOI] [PMC free article] [PubMed] [Google Scholar]
- 26.Drew, H. R. & Dickerson, R. E. (1981) J. Mol. Biol. 151, 535–556. [DOI] [PubMed] [Google Scholar]
- 27.Seeman, N. C., Sussman, J. L., Berman, H. M. & Kim, S.-H. (1971) Nat. New Biol. 233, 90–92. [DOI] [PubMed] [Google Scholar]
- 28.Young, M. A., Jayaram, B. & Beveridge, D. L. (1997) J. Am. Chem. Soc. 119, 59–69. [Google Scholar]
- 29.Hud, N. V. & Feigon, J. (1997) J. Am. Chem. Soc. 119, 5756–5757. [Google Scholar]
- 30.Bonvin, A. M. (2000) Eur. Biophys. J. 29, 57–60. [DOI] [PubMed] [Google Scholar]
- 31.Stellwagen, N. C., Magnusdottir, S., Gelfi, C. & Righetti, P. G. (2001) J. Mol. Biol. 305, 1025–1033. [DOI] [PubMed] [Google Scholar]
- 32.Shui, X., McFail-Isom, L., Hu, G. G. & Williams, L. D. (1998) Biochemistry 37, 8341–8355. [DOI] [PubMed] [Google Scholar]
- 33.Howerton, S. B., Sines, C. C., VanDerveer, D. & Williams, L. D. (2001) Biochemistry 40, 10023–10031. [DOI] [PubMed] [Google Scholar]
- 34.McFail-Isom, L., Shui, X. & Williams, L. D. (1998) Biochemistry 37, 17105–17111. [DOI] [PubMed] [Google Scholar]
- 35.Tereshko, V., Minasov, G. & Egli, M. (1999) J. Am. Chem. Soc. 121, 3590–3595. [Google Scholar]
- 36.Tereshko, V., Wilds, C. J., Minasov, G., Prakash, T. P., Maier, M. A., Howard, A., Wawrzak, Z., Manoharan, M. & Egli, M. (2001) Nucleic Acids Res. 29, 1208–1215. [DOI] [PMC free article] [PubMed] [Google Scholar]
- 37.Chiu, T. K., Kaczor-Grzeskowiak, M. & Dickerson, R. E. (1999) J. Mol. Biol. 292, 589–608. [DOI] [PubMed] [Google Scholar]
- 38.Woods, K. K., McFail-Isom, L., Sines, C. C., Howerton, S. B., Stephens, R. K. & Williams, L. D. (2000) J. Am. Chem. Soc. 122, 1546–1547. [Google Scholar]
- 39.Soler-Lopez, M., Malinina, L., Liu, J., Huynh-Dinh, T. & Subirana, J. A. (1999) J. Biol. Chem. 274, 23683–23686. [DOI] [PubMed] [Google Scholar]
- 40.Rouzina, I. & Bloomfield, V. A. (1998) Biophys. J. 74, 3152–3164. [DOI] [PMC free article] [PubMed] [Google Scholar]
- 41.McConnell, K. J. & Beveridge, D. L. (2000) J. Mol. Biol. 304, 803–820. [DOI] [PubMed] [Google Scholar]
- 42.Hud, N. V., Sklenar, V. & Feigon, J. (1999) J. Mol. Biol. 286, 651–660. [DOI] [PubMed] [Google Scholar]
- 43.Wu, Z., Delaglio, F., Tjandra, N., Zhurkin, V. B. & Bax, A. (2003) J. Biomol. NMR 26, 297–315. [DOI] [PubMed] [Google Scholar]
- 44.Strauss, J. K. & Maher, L. J., III (1994) Science 266, 1829–1834. [DOI] [PubMed] [Google Scholar]
- 45.Strauss-Soukup, J. K., Rodrigues, P. D. & Maher, L. J., III (1998) Biophys. Chem. 72, 297–306. [DOI] [PubMed] [Google Scholar]
- 46.Feig, M. & Pettitt, B. M. (1999) Biophys. J. 77, 1769–1781. [DOI] [PMC free article] [PubMed] [Google Scholar]
- 47.McConnell, K. J. & Beveridge, D. L. (2001) J. Mol. Biol. 314, 23–40. [DOI] [PubMed] [Google Scholar]
- 48.Mocci, F. & Saba, G. (2003) Biopolymers 68, 471–485. [DOI] [PubMed] [Google Scholar]
- 49.Hamelberg, D., Williams, L. D. & Wilson, W. D. (2001) J. Am. Chem. Soc. 123, 7745–7755. [DOI] [PubMed] [Google Scholar]
- 50.Burkhoff, A. M. & Tullius, T. D. (1987) Cell 48, 935–943. [DOI] [PubMed] [Google Scholar]
- 51.Stefl, R. & Koca, J. (2000) J. Am. Chem. Soc. 122, 5025–5033. [Google Scholar]
- 52.Rueda, M., Cubero, E., Laughton, C. A. & Orozco, M. (2004) Biophys. J. 87, 800–811. [DOI] [PMC free article] [PubMed] [Google Scholar]
- 53.Young, M. A., Ravishanker, G. & Beveridge, D. L. (1997) Biophys. J. 73, 2313–2336. [DOI] [PMC free article] [PubMed] [Google Scholar]
- 54.Young, M. A., Jayaram, B. & Beveridge, D. L. (1998) J. Phys. Chem. B 102, 7666–7669. [Google Scholar]
- 55.Lankas, F., Sponer, J., Langowski, J. & Cheatham, T. E., III (2003) Biophys. J. 85, 2872–2883. [DOI] [PMC free article] [PubMed] [Google Scholar]
- 56.Case, D. A., Pearlman, D. A., Caldwell, J. W., Cheatham, T. E., III, Wang, J., Ross, W. S., Simmerling, C. L., Darden, T. A., Merz, K. M., Stanton, R. V., et al. (2002) amber (University of California, San Francisco), Version 7.
- 57.Aqvist, J. (1990) J. Phys. Chem. 94, 8021–8024. [Google Scholar]
- 58.Lu, X. J. & Olson, W. K. (2003) Nucleic Acids Res. 31, 5108–5121. [DOI] [PMC free article] [PubMed] [Google Scholar]
- 59.Lavery, R. & Sklenar, H. (1989) J. Biomol. Struct. Dyn. 6, 655–667. [DOI] [PubMed] [Google Scholar]
- 60.Mehrotra, P. K. & Beveridge, D. L. (1980) J. Am. Chem. Soc. 102, 4287–4294. [Google Scholar]
- 61.Mezei, M. & Beveridge, D. L. (1986) Methods Enzymol. 127, 21–47. [DOI] [PubMed] [Google Scholar]
- 62.Impey, R. W., Madden, P. A. & McDonald., I. R. (1993) J. Phys. Chem. 87, 5071–5083. [Google Scholar]
- 63.Lavery, R. & Pullman, B. (1981) Nucleic Acids Res. 9, 3765–3777. [DOI] [PMC free article] [PubMed] [Google Scholar]
- 64.Ponomarev, S. Y. (2004) M.A. thesis (Wesleyan University, Middletown, CT).
- 65.Varnai, P. & Zakrzewska, K. (2004) Nucleic Acids Res. 32, 4269–4280. [DOI] [PMC free article] [PubMed] [Google Scholar]


