Abstract
Diploid cells of Saccharomyces cerevisiae were grown under controlled conditions with a Bioscreen instrument, which permitted the essentially continuous registration of their growth via optical density measurements. Some cultures were exposed to concentrations of a number of antifungal substances with different targets or modes of action (sterol biosynthesis, respiratory chain, amino acid synthesis, and the uncoupler). Culture supernatants were taken and analyzed for their “metabolic footprints” by using direct-injection mass spectrometry. Discriminant function analysis and hierarchical cluster analysis allowed these antifungal compounds to be distinguished and classified according to their modes of action. Genetic programming, a rule-evolving machine learning strategy, allowed respiratory inhibitors to be discriminated from others by using just two masses. Metabolic footprinting thus represents a rapid, convenient, and information-rich method for classifying the modes of action of antifungal substances.
For scientific reasons and because of the needs of the pharmaceutical and agrochemical industries, there is much current interest in detecting the site or mode of interaction between an exogenous ligand and a cell or organism, especially in identifying new ones (6, 44, 45). Such studies are nowadays typically carried out by using high-throughput methods, but there is often an inverse relation between the speed of an assay (involving, e.g., a cloned receptor with a fluorescence readout) and the amount of information it contains (which in this case is restricted to the target of interest). However, array-based methods are showing promise in this regard (3, 20, 34, 37, 46). Genome-wide screens can also provide such information (9, 10, 19) but require numerous strains or cell lines to be studied in parallel. Methods with high information content would combine the virtues of screening just a small number of strains with a high-dimensional readout similar to that provided by the array-based methods.
Metabolic control analysis (see, e.g., references 7, 15, 16, 21, and 29) tells us that while changes in the activity of a target enzyme tend to have only small effects on the flux through metabolic pathways, they can and do have substantial effects on the concentrations of metabolic intermediates. Since the use of metabolomics, especially in the form of “metabolic fingerprinting,” has a much higher throughput and is much cheaper than are, say, transcriptomics and proteomics (8, 14, 26, 42), it makes an attractive candidate for mode-of-action studies (18) and has been used to advantage by Ott and colleagues (2, 38), where the metabolic fingerprints of cells or tissues exposed to specific substances with known targets were analyzed for their modes of binding or action by using pattern recognition techniques.
Normally, metabolomics measures (or seeks to measure) the concentrations of all the small molecules within a cell or tissue; and for purposes of functional genomics, we and others have exploited such strategies in the analysis of gene deletion mutants in Saccharomyces cerevisiae (5, 41). However, because of the need to separate cells from medium and to extract the metabolome of the former separately, these methods are not as convenient as one would wish. In consequence, we have recently shown that the analysis of the metabolic footprint, the cocktail of metabolites left behind or secreted into the medium, differs reproducibly in single-gene mutants and can be measured rapidly and conveniently via direct-injection mass spectrometry (1) or Fourier transform infrared spectroscopy (22).
The question of whether metabolic footprinting of strains treated with different pharmaceuticals might also be used in discriminating the modes of action of different substances then arises. The purpose of the present study was to explore this question, and we show here, using metabolic footprinting and both unsupervised and supervised methods of machine learning analysis, that we can indeed classify a number of fungicides according to their modes of action.
MATERIALS AND METHODS
Fungicide screening. (i) Yeast strain.
The BY4743 diploid strain (MATa/MATα ura3Δ0/ura3Δ0 leu2Δ0/leu2Δ0 his3Δ1/his3Δ1 +/lys2Δ0 met15Δ0/+) was used throughout.
(ii) Screening methodology.
A library of agrochemical fungicides supplied by Aventis CropScience was screened for activity against yeast in a Bioscreen microtiter plate (Honeycomb II plates; Labsystems) format. Stocks (25 mg ml−1) of each compound were prepared in dimethyl sulfoxide (DMSO). From these stocks, three additional stocks (2.5 mg ml−1, 250 μg ml−1, and 25 μg ml−1) were prepared by serial dilution, such that each compound could be screened at log concentrations so that a broad picture of its inhibition behavior could be obtained. Stocks were aliquoted into glass vials and stored at −40°C.
From a washed starter culture, a stock of 5 × 10⁵ cells ml−1 was prepared, and 550 μl was aliquoted into a series of 1.5-ml sterile microcentrifuge tubes. A total of 5.5 μl of fungicide at each concentration to be tested (250, 25, 2.5, and 0.25 μg ml−1) was then added to the appropriate microcentrifuge tube and vortexed to ensure good mixing. DMSO control tubes (5.5 μl of DMSO added to 550 μl of cell suspension) were also set up. From each microtube, 100 μl was pipetted into each of five adjacent Honeycomb plate wells to produce a set of five replicate wells per treatment. Plates were then placed in the Bioscreen, where they were incubated at 30°C and shaken at medium intensity. Optical density (OD) at 600 nm was measured every 20 min for the duration of the screen (typically, 24 to 36 h).
The percent inhibition for each compound was calculated as the difference in the OD of treated cultures between 0 and 17 h expressed as a percentage of the change in the OD of the DMSO controls over the same time span.
(iii) Metabolic footprinting of fungicide-treated cultures.
All footprinting of fungicide-treated cultures was performed in (Bioscreen) microtiter plate format. For all footprinting studies of fungicide-treated cultures, each compound (which had been demonstrated to have reasonable activity against yeast following screening) was added at four different concentrations which had been found to inhibit yeast growth over the approximate range of 20 to 80% (compared with DMSO controls). The aim was to obtain an approximate fixed percentage of growth inhibition such that any changes in the footprint could be ascribed to the mode of action of the inhibitor and not, say, changes in growth rate.
Footprints were typically collected at 24 h (and no later than 28 h) at a point at which the majority of cultures appeared to have entered stationary phase (1). Plates were then removed from the Bioscreen and 90 μl was removed from each well, placed in a sterile 0.5-ml microcentrifuge tube, and spun for 5 min. Approximately 80 μl of the resulting supernatant was then removed and stored at −40°C in polystyrene microtiter plate (Nalgene) format until mass spectrometric analysis. Samples were diluted for mass spectrometry and analyzed exactly as described previously for deletion mutant footprints (1).
(iv) Mass spectrometry.
Direct-injection mass spectrometry was performed exactly as described previously (1).
(iv) Numerical methods.
Principal-components (PC) analysis (PCA), discriminant function (DF) analysis (DFA), and hierarchical cluster analysis (HCA) were carried out by using programs written in MATLAB (Mathworks, Cambridge, United Kingdom) exactly as described previously (1). Genetic programming was performed with the program gmax-bio (Aber Genomic Computing [http://www.abergc.com])
RESULTS AND DISCUSSION
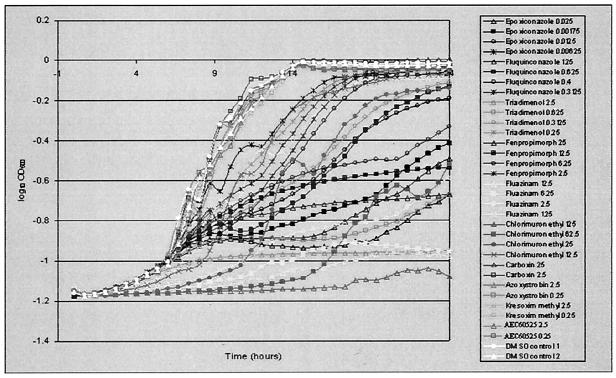
A typical set of growth curves of the diploid strain in the Bioscreen, at different concentrations of inhibitors, is given in Fig. 1. It is clear that the Bioscreen provides an accurate and convenient system for registering the growth of these cells and its inhibition by the inhibitors. It also shows that, with the possible exception of fenpropimorph, there is no regrowth in the presence of the inhibitors, i.e., a phenotypic (or conceivably genotypic) emergence of resistance in the cells after they have been exposed to the inhibitors (as has been noticed, for example, in bacterial experiments [40]).
FIG. 1.
Growth curves (each an average of results from five replicate plate wells) from Bioscreen microtiter plate wild-type diploid cultures treated with 10 different (respiratory and nonrespiratory) fungicides at four different concentrations, plus DMSO control. (Concentrations are given in the graph key as parts per million.)
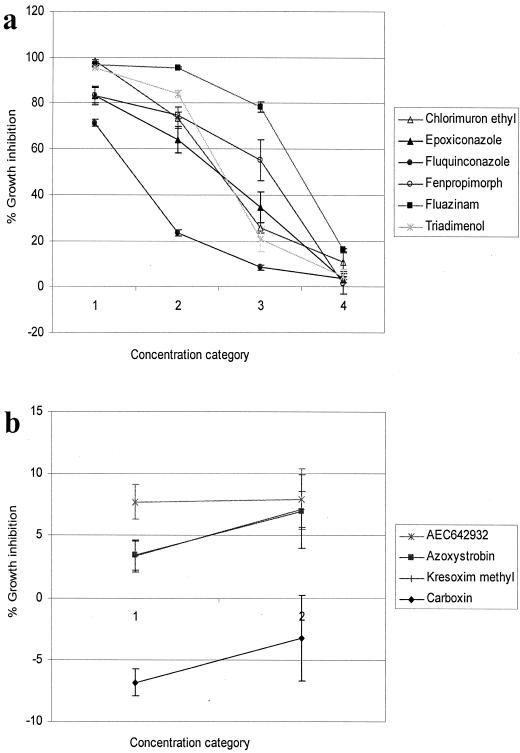
The effect of the different concentration categories on the inhibition profiles of the nonrespiratory inhibitors is given in Fig. 2, and the equivalent concentrations are shown in Table 1. The two concentrations of respiratory inhibitors used are given in Table 2.
FIG. 2.
Inhibition profiles (when screened against wild-type diploid BY4743, on glucose-containing footprinting medium) induced by the (a) nonrespiratory and (b) respiratory fungicides selected for the metabolic footprinting mode of action comparison when applied at the concentrations given in Tables 1 (nonrespiratory inhibitors) and 2 (respiratory inhibitors). Growth inhibition was calculated as the difference in the OD of cultures (an average of six replicates) between 0 and 24 h expressed as a percentage of the change in the OD of DMSO controls over the same time span.
TABLE 1.
Concentrations of nonrespiratory inhibitors used in metabolic footprinting comparisons of fungicide-treated wild-type yeast
| Compound type and fungicide(s) | Concn (ppm) used for footprinting for compound no.
|
|||
|---|---|---|---|---|
| 1 | 2 | 3 | 4 | |
| Ergosterol biosynthesis inhibitors | ||||
| Epoxiconazole | 0.025 | 0.0175 | 0.0125 | 0.00625 |
| Fluquinconazole | 1.25 | 0.625 | 0.4 | 0.3125 |
| Triadimenol | 2.5 | 0.625 | 0.3125 | 0.25 |
| Fenpropimorph | 25 | 12.5 | 6.25 | 2.5 |
| Uncoupler of oxidative phosphorylation | ||||
| Fluazinam | 12.5 | 6.25 | 2.5 | 1.25 |
| Amino acid biosynthesis inhibitor | ||||
| Chlorimuron ethyl | 125 | 62.5 | 25 | 12.5 |
TABLE 2.
Concentrations of respiratory inhibitors used in metabolic footprinting comparisons of fungicide-treated wild-type yeast
| Fungicide | Concn (ppm) used for footprinting for compound no.:
|
|
|---|---|---|
| 1 | 2 | |
| Azoxystrobin | 2.5 | 0.25 |
| Carboxin | 25 | 2.5 |
| Kresoxim methyl | 2.5 | 0.25 |
| AEC605025 | 2.5 | 0.25 |
Metabolic footprints were taken from these cells and subjected to mass spectrometric analysis exactly as described previously (1).
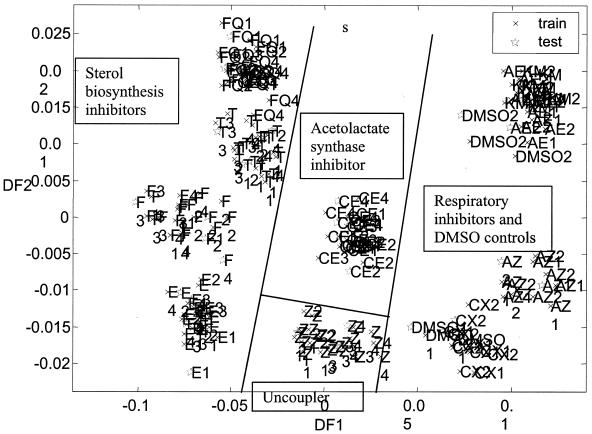
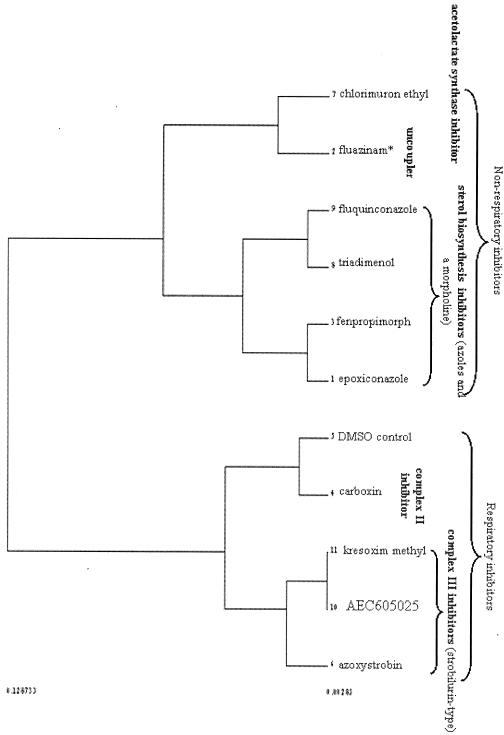
Following PCA (data not shown), DFA was performed on the data, a cross-validation analysis demonstrating that PCs 1 to 20 (99.9% of the variance) were sufficient to give reasonable clustering according to compound class without compromising the overlap of training and test data (Fig. 3). HCA was additionally performed on the DFA scores (score, 1 to 3; averaged according to compound) in order that grouping relationships might be better visualized (Fig. 4). Clearly, the greatest separation is between respiratory and nonrespiratory inhibitors, which form two separate branches in the resulting dendrogram. Interestingly, within the respiratory inhibitor branch, the complex III strobilurin-type inhibitors form their own subbranch, while the complex II inhibitor carboxin groups with the DMSO control form a separate subbranch. A particularly interesting feature is that the classification works over a range of doses. This robustness to the actual dose represents a significant benefit in setting up experiments, since this could save a lot of time on preliminary, dose-setting experiments. It is noticeable that the DMSO control appears on the same branch with inhibitory compounds rather than, as one might possibly hope, forming a separate branch on its own. However, even at a concentration of 1% (128 mM), the level of DMSO is somewhat above that (50 mM) which was demonstrated by Panek et al. (39) to affect various cellular processes, and so it cannot be considered entirely benign.
FIG. 3.
DFA was performed (and simultaneously cross-validated [1]) for PC scores (1 to 20, 99.9% of the variance) obtained from an analysis of footprints collected from wild-type diploid yeast cultures treated with 10 different inhibitors. DFA classes were assigned according to compound, regardless of the concentration at which it was applied. Labels are as follows: AE, AEC605025; AZ, azoxystrobin; CE, chlorimuron ethyl; CX, carboxin; E, epoxiconazole; F, fenpropimorph; FQ, fluquinconazole; T, triadimenol; Z, fluazinam. Concentrations 1 to 4 for each nonrespiratory inhibitor are given in Table 1. Concentrations 1 and 2 for each respiratory inhibitor are given in Table 2.
FIG. 4.
The DFA scores (1 to 3) from the analysis illustrated in Fig. 3 were averaged according to compound (i.e., scores for the members of each class were averaged) and subjected to HCA. A separation of the respiratory and nonrespiratory inhibitors was observed in the resulting dendrogram. Fluazinam (marked with an asterisk) is cited as an uncoupler of oxidative phosphorylation (17), and although it might conceivably be regarded as a respiratory inhibitor, it is not, of course, a respiratory chain inhibitor, and the level of inhibition it induces in cells growing on a fermentable carbon source is too great to arise from the inhibition of respiration-coupled processes alone; and therefore, this compound must inhibit other reactions within the cell, most likely on some proton-coupled uptake process necessary for fermentative growth.
In a similar vein, we trained a genetic program (4, 12, 23, 24, 30-33, 35, 36) to evolve rules that would discriminate respiratory from nonrespiratory inhibitors. DMSO samples were removed, as their status would of course be known. To guard against overtraining, the data were split into three partitions, in accordance with accepted modelling practice (e.g., see reference 43). The genetic programming was trained on the first partition, terminating evolution after 20 generations. This cycle was repeated 10 times. Each of the resulting 10 rules gave perfect classification on the training partition. Each rule was then applied to the second partition in order to test its generalization capability, and of the 10 rules, 6 also gave perfect classification on this partition. These six rules were then applied to the third partition (which had not been used in any way in forming or selecting the rules), and in each case a perfect classification was obtained. In partitioning the data, replicates of individual inhibitors had been retained within single partitions, and thus, the third partition contained only samples treated with inhibitors that were not represented in either of the first two partitions but whose modes of action were nevertheless correctly classified.
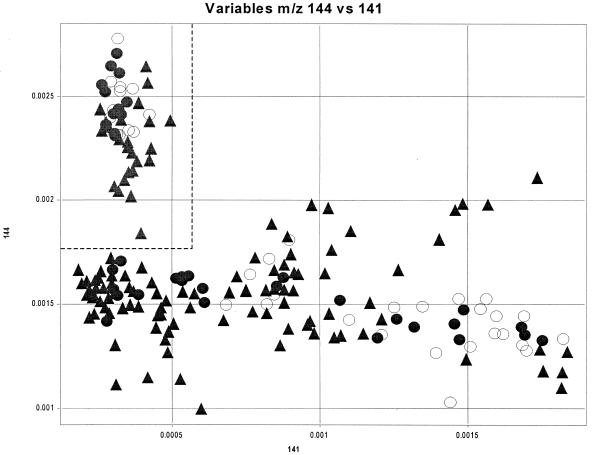
Each of the six successful rules used a combination of just three m/z ratios to discriminate the classes. All but one of the six rules contained an m/z ratio of 144, but no other m/z ratio appeared more than once. Plotting m/z 144 in turn against each of the other variables used by the rules revealed three cases (m/z 141, 179, and 189) where clusters visually separable with straight lines were obtained (see the example of m/z 144 versus 141 in Fig. 5). Thus, as in previously described related strategies (1, 11, 13, 23, 25, 27), it seems that these classifications can be performed effectively by using only a very small number of the variables from these high-dimensional data sets, and there are also likely to be other combinations of peaks in these spectra that are equally able to discriminate classes. It is possible that a chemical interpretation of these peaks may lead to the identification of useful markers for understanding the biochemical basis of these discriminations.
FIG. 5.
Discrimination of respiratory and nonrespiratory inhibitors by using genetic programming to select discriminatory variables. Data were acquired as described above in the legends to Fig. 3 and 4 for all samples except fluazinam, and a genetic program was trained by using gmax-bio to evolve rules that can discriminate respiratory (symbols inside the top left dotted box) from nonrespiratory (symbols outside of the dotted box) modes of action. Variable (m/z) 144 was a member of all but one of the selected rules. In this example, its values are plotted against those of one of several other variables (m/z 141) that were used by the rules, here resulting in linearly separable clusters (shown as dotted lines). Triangles, training set; closed circles, test set for validation purposes; open circles, independent test set.
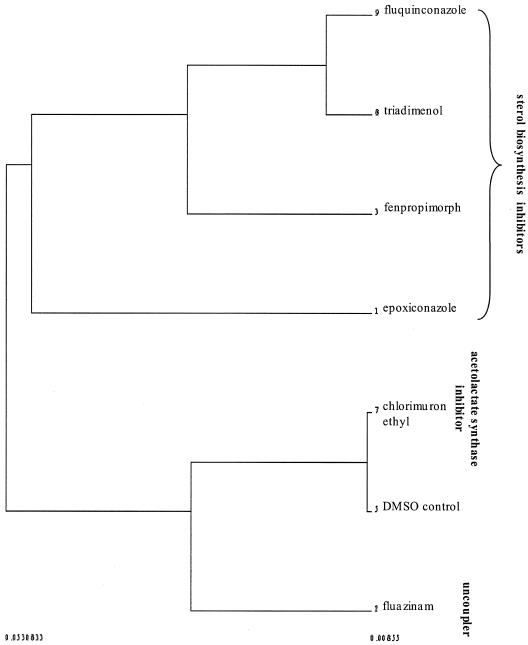
Within the nonrespiratory branch, it was pleasing to observe that the sterol biosynthesis inhibitors formed one branch (albeit the morpholine fenpropimorph forms a subbranch with the azole epoxiconazole) while the amino acid biosynthesis inhibitor and uncoupler form another. The separation of the respiratory inhibitors from the remaining compounds is scarcely surprising given that the former inhibitors give rise to only limited or no inhibition of growth rate. Consequently, in order to determine whether similar grouping relationships might be observed between the remaining (nonrespiratory) compounds in the absence of variance contributed by the respiratory inhibitors, data for these latter compounds were removed from the data set, and the remaining compounds were then resubjected to PCA, DFA (PC scores of 1 to 20, employing the same compound-based class system), and HCA (DFs 1 to 3, averaged according to compound). The resulting dendrogram (Fig. 6) illustrates that the grouping relationships observed in Fig. 4 are preserved among these nonrespiratory inhibitors, in that the sterols form a group away from the rest of the inhibitors and the uncoupler is separated from the acetolactate synthase inhibitor.
FIG. 6.
Data for the respiratory inhibitors were removed from the data set employed in the analyses illustrated in Fig. 3 and 4, and PCA and DFA were performed on the data for the remaining (nonrespiratory) inhibitors. Again, DFA classes were assigned according to compound, regardless of their concentration of application. DFA scores (1 to 3, averaged according to compound) were then subjected to HCA, and a dendrogram was produced.
The attractions of the metabolic footprinting approach are its rapidity, ease of implementation, and reproducibility, while as a pattern recognition strategy (8, 14), it is not designed (immediately) to determine the molecules that are most important to or responsible for any particular discrimination. However, the simplicity of some of the rules determined by the genetic programming approach means that, in many cases, just a few rules are sufficient (e.g., as shown in Fig. 5). This result means that if a tandem mass spectrometer is available, only those masses need to be studied to achieve identification (and these could then be confirmed by other methods such as gas chromatography-mass spectrometry or nuclear magnetic resonance. Such an iterative strategy is entirely appropriate for postgenomic studies (28).
In conclusion, the present work has shown, complementarily to previous studies in which gene knockouts were used (1), that the metabolic footprints of wild-type strains treated with inhibitors with different modes of action contain sufficient information to allow such modes of action to be discriminated from the metabolic footprints alone.
Acknowledgments
This work was supported by a grant from the Biotechnology and Biological Sciences Research Council, United Kingdom, to D.B.K. and S.G.O. J.A. was the recipient of a BBSRC CASE studentship with Bayer CropScience (formerly Aventis CropScience).
We thank John Pillmoor, Steve Dunn, and Jane Dancer for their careful supervision and John Pillmoor for a careful reading of the manuscript. We thank Bharat Rash and Nicola Burton, of the Manchester laboratory, for technical assistance and Roy Goodacre (Aberystwyth/UMIST) for useful discussions.
REFERENCES
- 1.Allen, J. K., H. M. Davey, D. Broadhurst, J. K. Heald, J. J. Rowland, S. G. Oliver, and D. B. Kell. 2003. High-throughput characterisation of yeast mutants for functional genomics using metabolic footprinting. Nat. Biotechnol. 21:692-696. [DOI] [PubMed] [Google Scholar]
- 2.Aranibar, N., B. K. Singh, G. W. Stockton, and K.-H. Ott. 2001. Automated mode-of-action detection by metabolic profiling. Biochem. Biophys. Res. Commun. 286:150-155. [DOI] [PubMed] [Google Scholar]
- 3.Bammert, G. F., and J. M. Fostel. 2000. Genome-wide expression patterns in Saccharomyces cerevisiae: comparison of drug treatments and genetic alterations affecting biosynthesis of ergosterol. Antimicrob. Agents Chemother. 44:1255-1265. [DOI] [PMC free article] [PubMed] [Google Scholar]
- 4.Banzhaf, W., P. Nordin, R. E. Keller, and F. D. Francone. 1998. Genetic programming: an introduction. Morgan Kaufmann, San Francisco, Calif.
- 5.Castrillo, J. I., A. Hayes, S. Mohammed, S. J. Gaskell, and S. G. Oliver. 2003. An optimized protocol for metabolome analysis in yeast using direct infusion electrospray mass spectrometry. Phytochemistry 62:929-937. [DOI] [PubMed] [Google Scholar]
- 6.Corran, A. J., A. Renwick, and S. Dunbar. 1998. Approaches to in vitro lead generation for fungicide invention. Pestic. Sci. 54:338-344. [Google Scholar]
- 7.Fell, D. A. 1996. Understanding the control of metabolism. Portland Press, London, United Kingdom.
- 8.Fiehn, O. 2001. Combining genomics, metabolome analysis, and biochemical modelling to understand metabolic networks. Comp. Func. Genomics 2:155-168. [DOI] [PMC free article] [PubMed] [Google Scholar]
- 9.Giaever, G., A. M. Chu, L. Ni, C. Connelly, L. Riles, S. Veronneau, S. Dow, A. Lucau-Danila, K. Anderson, B. Andre, A. P. Arkin, A. Astromoff, M. El Bakkoury, R. Bangham, R. Benito, S. Brachat, S. Campanaro, M. Curtiss, K. Davis, A. Deutschbauer, K. D. Entian, P. Flaherty, F. Foury, D. J. Garfinkel, M. Gerstein, D. Gotte, U. Guldener, J. H. Hegemann, S. Hempel, Z. Herman, D. F. Jaramillo, D. E. Kelly, S. L. Kelly, P. Kotter, D. LaBonte, D. C. Lamb, N. Lan, H. Liang, H. Liao, L. Liu, C. Luo, M. Lussier, R. Mao, P. Menard, S. L. Ooi, J. L. Revuelta, C. J. Roberts, M. Rose, P. Ross-Macdonald, B. Scherens, G. Schimmack, B. Shafer, D. D. Shoemaker, S. Sookhai-Mahadeo, R. K. Storms, J. N. Strathern, G. Valle, M. Voet, G. Volckaert, C. Y. Wang, T. R. Ward, J. Wilhelmy, E. A. Winzeler, Y. Yang, G. Yen, E. Youngman, K. Yu, H. Bussey, J. D. Boeke, M. Snyder, P. Philippsen, R. W. Davis, and M. Johnston. 2002. Functional profiling of the Saccharomyces cerevisiae genome. Nature 418:387-391. [DOI] [PubMed] [Google Scholar]
- 10.Giaever, G., D. D. Shoemaker, T. W. Jones, H. Liang, E. A. Winzeler, A. Astromoff, and R. W. Davis. 1999. Genomic profiling of drug sensitivities via induced haploinsufficiency. Nat. Genet. 21:278-283. [DOI] [PubMed] [Google Scholar]
- 11.Goodacre, R. 2003. Explanatory analysis of spectroscopic data using machine learning of simple, interpretable rules. Vib. Spectrosc. 32:33-45. [Google Scholar]
- 12.Goodacre, R., and D. B. Kell. 2003. Evolutionary computation for the interpretation of metabolome data, p. 239-256. In G. G. Harrigan and R. Goodacre (ed.), Metabolic profiling: its role in biomarker discovery and gene function analysis. Kluwer Academic Publishers, Boston, Mass.
- 13.Goodacre, R., B. Shann, R. J. Gilbert, E. M. Timmins, A. C. McGovern, B. K. Alsberg, D. B. Kell, and N. A. Logan. 2000. Detection of the dipicolinic acid biomarker in Bacillus spores using Curie-point pyrolysis mass spectrometry and Fourier transform infrared spectroscopy. Anal. Chem. 72:119-127. [DOI] [PubMed] [Google Scholar]
- 14.Goodacre, R., S. Vaidyanathan, W. B. Dunn, G. G. Harrigan, and D. B. Kell. 2004. Metabolomics by numbers: acquiring and understanding global metabolite data. Trends Biotechnol. 22:245-252. [DOI] [PubMed] [Google Scholar]
- 15.Heinrich, R., and T. A. Rapoport. 1974. A linear steady-state treatment of enzymatic chains. General properties, control and effector strength. Eur. J. Biochem. 42:89-95. [DOI] [PubMed] [Google Scholar]
- 16.Heinrich, R., and S. Schuster. 1996. The regulation of cellular systems. Chapman & Hall, New York, N.Y.
- 17.Hewitt, H. G. 1998. Fungicides in crop protection. CAB International, Oxford, United Kingdom.
- 18.Hole, S. J. W., P. W. A. Howe, P. D. Stanley, and S. T. Hadfield. 2000. Pattern recognition analysis of endogenous cell metabolites for high throughput mode of action identification: removing the postscreening dilemma associated with whole-organism high throughput screening. J. Biomol. Screen. 5:335-342. [DOI] [PubMed] [Google Scholar]
- 19.Hughes, T. R., M. J. Marton, A. R. Jones, C. J. Roberts, R. Stoughton, C. D. Armour, H. A. Bennett, E. Coffey, H. Y. Dai, Y. D. D. He, M. J. Kidd, A. M. King, M. R. Meyer, D. Slade, P. Y. Lum, S. B. Stepaniants, D. D. Shoemaker, D. Gachotte, K. Chakraburtty, J. Simon, M. Bard, and S. H. Friend. 2000. Functional discovery via a compendium of expression profiles. Cell 102:109-126. [DOI] [PubMed] [Google Scholar]
- 20.Jia, M. H., R. A. Larossa, J. M. Lee, A. Rafalski, E. Derose, G. Gonye, and Z. X. Xue. 2000. Global expression profiling of yeast treated with an inhibitor of amino acid biosynthesis, sulfometuron methyl. Physiol. Genomics 3:83-92. [DOI] [PubMed] [Google Scholar]
- 21.Kacser, H., and J. A. Burns. 1973. The control of flux, p. 65-104. In D. D. Davies (ed.), Rate control of biological processes. Symposium of the Society for Experimental Biology, vol. 27. Cambridge University Press, Cambridge, United Kingdom. [PubMed] [Google Scholar]
- 22.Kaderbhai, N. N., D. I. Broadhurst, D. I. Ellis, R. Goodacre, and D. B. Kell. 2003. Functional genomics via metabolic footprinting: monitoring metabolite secretion by Escherichia coli tryptophan metabolism mutants using FT-IR and direct injection electrospray mass spectrometry. Comp. Func. Genomics 4:376-391. [DOI] [PMC free article] [PubMed] [Google Scholar]
- 23.Kell, D. B. 2002. Defence against the flood: a solution to the data mining and predictive modelling challenges of today. Bioinform. World 1:16-18. [Online.] http://www.abergc.com/biwpp16-18_as_publ.pdf. [Google Scholar]
- 24.Kell, D. B. 2002. Genotype-phenotype mapping: genes as computer programs. Trends Genet. 18:555-559. [DOI] [PubMed] [Google Scholar]
- 25.Kell, D. B. 2002. Metabolomics and machine learning: explanatory analysis of complex metabolome data using genetic programming to produce simple, robust rules. Mol. Biol. Rep. 29:237-241. [DOI] [PubMed] [Google Scholar]
- 26.Kell, D. B. 2004. Metabolomics and systems biology: making sense of the soup. Curr. Opin. Microbiol. 7:296-307. [DOI] [PubMed] [Google Scholar]
- 27.Kell, D. B., R. M. Darby, and J. Draper. 2001. Genomic computing: explanatory analysis of plant expression profiling data using machine learning. Plant Physiol. 126:943-951. [DOI] [PMC free article] [PubMed] [Google Scholar]
- 28.Kell, D. B., and S. G. Oliver. 2004. Here is the evidence, now what is the hypothesis? The complementary roles of inductive and hypothesis-driven science in the post-genomic era. Bioessays 26:99-105. [DOI] [PubMed] [Google Scholar]
- 29.Kell, D. B., and H. V. Westerhoff. 1986. Metabolic control theory: its role in microbiology and biotechnology. FEMS Microbiol. Rev. 39:305-320. [Google Scholar]
- 30.Koza, J. R. 1994. Genetic programming II: automatic discovery of reusable programs. MIT Press, Cambridge, Mass.
- 31.Koza, J. R. 1992. Genetic programming: on the programming of computers by means of natural selection. MIT Press, Cambridge, Mass.
- 32.Koza, J. R., F. H. Bennett, M. A. Keane, and D. Andre. 1999. Genetic programming III: Darwinian invention and problem solving. Morgan Kaufmann, San Francisco, Calif.
- 33.Koza, J. R., M. A. Keane, M. J. Streeter, W. Mydlowec, J. Yu, and G. Lanza. 2003. Genetic programming: routine human-competitive machine intelligence. Kluwer, New York, N.Y.
- 34.Kuruvilla, F. G., A. F. Shamji, S. M. Sternson, P. J. Hergenrother, and S. L. Schreiber. 2002. Dissecting glucose signalling with diversity-oriented synthesis and small-molecule microarrays. Nature 416:653-657. [DOI] [PubMed] [Google Scholar]
- 35.Langdon, W. B. 1998. Genetic programming and data structures: genetic programming + data structures = automatic programming! Kluwer, Boston, Mass.
- 36.Langdon, W. B., and R. Poli. 2002. Foundations of genetic programming. Springer-Verlag, Berlin, Germany.
- 37.Marton, M. J., J. L. DeRisi, H. A. Bennett, V. R. Iyer, M. R. Meyer, C. J. Roberts, R. Stoughton, J. Burchard, D. Slade, H. Y. Dai, D. E. Bassett, L. H. Hartwell, P. O. Brown, and S. H. Friend. 1998. Drug target validation and identification of secondary drug target effects using DNA microarrays. Nat. Med. 4:1293-1301. [DOI] [PubMed] [Google Scholar]
- 38.Ott, K.-H., N. Aranibar, B. Singh, and G. W. Stockton. 2003. Metabonomics classifies pathways affected by bioactive compounds. Artificial neural network classification of NMR spectra of plant extracts. Phytochemistry 62:971-985. [DOI] [PubMed] [Google Scholar]
- 39.Panek, A. C., S. C. Poppe, A. D. Panek, and V. B. C. Junqueira. 1990. Effect of dimethylsulfoxide on signal transduction in mutants of Saccharomyces cerevisiae. Braz. J. Med. Biol. Res. 23:105-111. [PubMed] [Google Scholar]
- 40.Phillips, M. K., and D. B. Kell. 1982. A novel inhibitor of NADH dehydrogenase in Paracoccus denitrificans. FEBS Lett. 140:248-250. [DOI] [PubMed] [Google Scholar]
- 41.Raamsdonk, L. M., B. Teusink, D. Broadhurst, N. Zhang, A. Hayes, M. Walsh, J. A. Berden, K. M. Brindle, D. B. Kell, J. J. Rowland, H. V. Westerhoff, K. van Dam, and S. G. Oliver. 2001. A functional genomics strategy that uses metabolome data to reveal the phenotype of silent mutations. Nat. Biotechnol. 19:45-50. [DOI] [PubMed] [Google Scholar]
- 42.Roessner, U., A. Luedemann, D. Brust, O. Fiehn, T. Linke, L. Willmitzer, and A. R. Fernie. 2001. Metabolic profiling allows comprehensive phenotyping of genetically or environmentally modified plant systems. Plant Cell 13:11-29. [DOI] [PMC free article] [PubMed] [Google Scholar]
- 43.Rowland, J. J. 2003. Model selection methodology in supervised learning with evolutionary computation. BioSystems 72:187-196. [DOI] [PubMed] [Google Scholar]
- 44.Spaltmann, F., M. Blunck, and K. Ziegelbauer. 1999. Computer-aided target selection-prioritizing targets for antifungal drug discovery. Drug Discov. Today 4:17-26. [DOI] [PubMed] [Google Scholar]
- 45.White, T. A., and D. B. Kell. 2004. Comparative genomic assessment of novel broad-spectrum targets for antibacterial drugs. Comp. Func. Genomics 5:304-327. [DOI] [PMC free article] [PubMed] [Google Scholar]
- 46.Zhu, H., M. Bilgin, R. Bangham, D. Hall, A. Casamayor, P. Bertone, N. Lan, R. Jansen, S. Bidlingmaier, T. Houfek, T. Mitchell, P. Miller, R. A. Dean, M. Gerstein, and M. Snyder. 2001. Global analysis of protein activities using proteome chips. Science 293:2101-2105. [DOI] [PubMed] [Google Scholar]


