

Abstract
We describe an approach to sort cells from coastal North Sea bacterioplankton by flow cytometry after in situ hybridization with rRNA-targeted horseradish peroxidase-labeled oligonucleotide probes and catalyzed fluorescent reporter deposition (CARD-FISH). In a sample from spring 2003 >90% of the cells were detected by CARD-FISH with a bacterial probe (EUB338). Approximately 30% of the microbial assemblage was affiliated with the Cytophaga-Flavobacterium lineage of the Bacteroidetes (CFB group) (probe CF319a), and almost 10% was targeted by a probe for the β-proteobacteria (probe BET42a). A protocol was optimized to detach cells hybridized with EUB338, BET42a, and CF319a from membrane filters (recovery rate, 70%) and to sort the cells by flow cytometry. The purity of sorted cells was >95%. 16S rRNA gene clone libraries were constructed from hybridized and sorted cells (S-EUB, S-BET, and S-CF libraries) and from unhybridized and unsorted cells (UNHYB library). Sequences related to the CFB group were significantly more frequent in the S-CF library (66%) than in the UNHYB library (13%). No enrichment of β-proteobacterial sequence types was found in the S-BET library, but novel sequences related to Nitrosospira were found exclusively in this library. These bacteria, together with members of marine clade OM43, represented >90% of the β-proteobacteria in the water sample, as determined by CARD-FISH with specific probes. This illustrates that a combination of CARD-FISH and flow sorting might be a powerful approach to study the diversity and potentially the activity and the genomes of different bacterial populations in aquatic habitats.
Flow cytometry is a tool that is widely used for rapid quantification of different cell populations in mixed microbial communities (7, 12, 13, 15, 25, 26, 56). The detection of such populations is based on light scatter, autofluorescence, or various types of fluorescence staining (e.g., staining for macromolecular content). In combination with phylogenetic staining of cells by fluorescence in situ hybridization (FISH) with rRNA-targeted probes, this technique even has potential for identification of individual bacterial taxa in complex assemblages (2, 51).
In contrast to microscopic analysis, flow cytometry allows physical separation of particular bacterial populations of interest and concentration of these populations for further analyses (52, 56). So far, microbial cells have been sorted mainly based on phenotypic features (13, 25, 56). The main obstacle for sorting by phylogenetic affiliation for samples other than samples from highly eutrophic environments (52) has been the low fluorescence intensities of slowly growing cells after FISH staining with monolabeled oligonucleotide probes and the limited sensitivity of flow cytometers compared to epifluorescence microscopes.
In situ hybridization of microbial cells with horseradish peroxidase (HRP)-labeled oligonucleotide probes and catalyzed fluorescent reporter deposition (CARD-FISH) is an emerging approach for quantification of individual phylogenetic populations of bacterioplankton in different aquatic environments (36, 37, 39, 45). The fluorescence intensity of hybridized cells after CARD-FISH is up to 20-fold higher than that after FISH with monolabeled fluorescent probes (44). Thus, this method allows workers to visualize pelagic bacteria whose cells are very small or have low ribosomal contents (e.g., members of the marine SAR86 lineage or the freshwater actinobacteria) (36, 45).
Adaptation of CARD-FISH for flow cytometric analysis may therefore overcome the limited sensitivity of flow cytometry. However, flow cytometry requires that cells be in suspension prior to measurement. In contrast, microscopic preparations of CARD-FISH-stained bacterioplankton are cells on membrane filters that are embedded in agarose to minimize cell loss. Therefore, the approach now used for CARD-FISH of pelagic bacteria cannot be readily used for subsequent flow cytometric analysis.
In a recently described protocol for flow cytometric quantification of marine picoeukaryotes after CARD-FISH (4), cell concentrations could be maintained during the various washing steps by repeated centrifugation without substantial cell loss. Unfortunately, the wide range of cell sizes makes it impossible to quantitatively recover bacterioplankton cells by centrifugation, and the fraction containing the smallest cells sediments at g forces that damage the larger cells. Alternatively, tangential flow filtration might be used for cell concentration (16). However, this approach is time-consuming, requires large volumes of samples, and again potentially selects against particular cell size fractions. A third option for flow cytometric analysis of hybridized cells could be to closely follow the established protocol for CARD-FISH on membrane filters (36) and subsequently resuspend the bacterial cells from the filters. Extraction of bacteria from particles prior to analysis is a central issue in samples from soils and sediments, and various protocols are available for physical and chemical removal of bacteria from surfaces (19, 27).
It is nevertheless probable that such a procedure would not be quantitative. A current protocol for the transfer of hybridized cells from membrane filters onto glass slides suffers from approximately 50% cell loss (10). Thus, a flow cytometric protocol for counting hybridized cells resuspended from membrane filters likely will always be inferior to direct microscopic counting of the filtered cells. However, even qualitative visualization of individual phylogenetic groups by flow cytometry would provide the possibility to sort the cell populations for further analyses, which has proven to be extremely valuable, e.g., for autotrophic marine bacteria (56). Thus, in the present study, we aimed at developing a protocol for flow sorting hybridized prokaryotes, and we explored the usefulness of this protocol for aquatic microbial ecology.
MATERIALS AND METHODS
Sampling location and sample fixation.
Samples for initial method development were obtained from an in-house seawater aquarium. North Sea surface water (depth, 0.5 m) was collected from the German Bight near the Island of Helgoland (approximately 50 km offshore) during March 2003. Samples were fixed with 2% (wt/vol) (final concentration) formaldehyde from a 36% formaldehyde solution for less than 24 h at 4°C. Portions (20 ml) were filtered on polycarbonate membrane filters (type GTTP; pore size, 0.2 μm; diameter, 47 mm; Millipore, Eschborn, Germany) for microscopic cell counting after FISH. The same volume of a sample was filtered on 25-mm-diameter polycarbonate filters (type GTTP; Millipore) for cell detachment and flow cytometric sorting. The preparations were washed with double-distilled water (ddH2O) and stored at −20°C until further processing.
CARD-FISH and microscopic evaluation.
Filters for counting CARD-FISH-stained cells were embedded in low-gelling-point agarose (concentration, 0.2%; MetaPhor; FMC Bioproducts, Rockland, Maine) and dried at 37°C for 10 min. Sections of these filters were permeabilized and hybridized by using 5′-HRP-labeled oligonucleotide probes as described previously (36). The oligonucleotide probes used in this study and the hybridization and washing conditions are shown in Table 1. Tyramide signal amplification was performed by using custom fluorescein-labeled tyramides dissolved in dimethyl formamide containing 20 mg of 4-iodophenyl boronic acid ml−1 (37). One part of the tyramide solution was added to 500 parts of amplification buffer (1× phosphate-buffered saline [PBS], 2 M NaCl, 0.1% blocking reagent, 10% dextran sulfate). The amplification reaction was performed at 37°C for 10 min. Double hybridizations of filter sections with HRP-labeled probes BET42a and GAM42a were performed as follows. First, samples were hybridized with probe BET42a, and signal amplification was carried out by using tyramides labeled with Alexa 546 (Molecular Probes, Eugene, Oreg.). Next, probe-delivered peroxidase was quenched by incubation with 0.01 M HCl for 10 min and rinsing with ddH2O. This was followed by FISH with probe GAM42a and signal amplification with tyramides labeled with Alexa 488 (Molecular Probes). Counterstaining of CARD-FISH preparations with 4,6-diamidino-2-phenylindole (DAPI) (1 μg ml−1), mounting, and microscopic evaluation were performed as described previously (36). The fraction of FISH-stained bacteria in at least 1,000 DAPI-stained cells per sample was determined.
TABLE 1.
Oligonucleotide probes used in this study and fraction of total cells detected in the spring sample of coastal North Sea watera
| Probe | Sequence (5′ → 3′) | Target organisms | Reference | Hybridized fraction (%)c |
|---|---|---|---|---|
| EUB338 | GCT GCC TCC CGT AGG AGT | Domain Bacteria | 2 | 91 ± 1.3 |
| NON338 | ACT CCT ACG GGA GGC AGC | Complementary to EUB338 | 2 | <1 |
| ALF968 | GGT AAG GTT CTG CGC GTT | Most α-proteobacteria | 17 | 26.7 ± 1.4 |
| ROS537 | CAA CGC TAA CCC CCT CC | Roseobacter spp. and SAR83 α-proteobacteria | 12a | 11.0 ± 0.1 |
| BET42ab | GCC TTC CCA CTT CGT TT | β-Proteobacteria | 28a | 9.3 ± 3.1 |
| OM43-162 | ATG CGG CAT TAG CTA ACC | OM43 clade of β-proteobacteria | This study | 4.0 ± 0.2 |
| Nso190 | CGA TCC CCT GCT TTT CTC C | Ammonia-oxidizing β-proteobacteria | 31 | 3.4 ± 0.2 |
| Nso1225 | CGC CAT TGT ATT ACG TGT GA | Ammonia-oxidizing β-proteobacteria | 31 | 4.0 ± 0.4 |
| GAM42ab | GCC TTC CCA CAT CGT TT | γ-Proteobacteria | 28a | 20.0 ± 1.4 |
| SAR86-1245 | TTA GCG TCC GTC TGT AT | SAR86 cluster of γ-proteobacteria | 55a | 15.2 ± 0.2 |
| CF319a | TGG TCC GTG TCT CAG TAC | Cytophaga-Flavobacterium | 28 | 29.1 ± 3.8 |
A formamide concentration of 55% was used in the hybridization buffer for all the probes. Hybridization and washing were performed at 35 to 37°C except for probe Nso190 (hybridization at 46°C and washing at 48°C). The concentration of sodium chloride in the washing buffer was 10 mM except for probe Nso190 (20 mM).
Used with an equimolar amount of unlabeled competitor oligonucleotides.
Means ± standard deviations for triplicate determinations.
Cell removal from membrane filters and resuspension.
For detachment of cells from membrane filters after CARD-FISH staining, we tested various techniques used for whole-cell extraction of bacteria from sediments and soil particles (14, 19, 27, 41). As a major modification to the original CARD-FISH protocol, the filter sections were not covered with agarose prior to enzymatic permeabilization and hybridization for two reasons. First, the embedded cells proved to be difficult to remove from filters. Second, we observed interference of agarose particles with flow cytometric analysis. In order to minimize cell loss (36), the filter sections were handled extremely carefully during hybridization. Specifically, care was taken to avoid excessive agitation during the washing steps (e.g., during PBS-Triton X-100 and ddH2O washing). The membrane filters were then subjected to various treatments, like vortexing, sonication, and treatment with different chemical agents.
Unhybridized filter sections and sections hybridized with probe EUB338 were transferred in 2-ml tubes containing 1.5 ml of sterile water. Vortexing (2,500 rpm for 15 min; Minishaker; IKA-Works, Wilmington, N.C.) and sonication (maximum power for 30 min; ultrasonic bath; OMNILAB, Bremen, Germany) were tested separately to determine their effectiveness in cell removal. The cell removal rate was calculated by comparing microscopic cell counts from the treated filter sections with counts from control filter sections that were not subjected to any treatment.
Since these two methods were not sufficient to efficiently remove cells after CARD-FISH staining, the filter sections were preincubated with various chemical agents for 2 h at room temperature and subsequently vortexed for at least 10 min. The preincubation treatments included (i) sterile water, (ii) 1 M Tris-HCl, (iii) 1× PBS with 0.05% Triton X-100, (iv) 150 mM NaCl with 0.05% Tween 80, (v) 0.05 M pyrophosphate, (vi) 1 M KCl, (vii) 0.1% Pluronic F-80, and (vii) 0.1% sodium cholate. In order to explore the influence of temperature on cell removal, all treatments were also performed at 37°C. For selected treatments the cells removed were suspended in 1 ml of sterile water and refiltered on membrane filters of the same size. These preparations were used to determine the rate of cell recovery and to microscopically evaluate the integrity of the recovered cells. Additionally, an incubation time series (0, 15, 30, 60, and 120 min) was used for the optimal combination of treatments.
Filter sections containing the environmental sample were hybridized with HRP-labeled oligonucleotide probes EUB338, CF319a, BET42a, and NON338. The cells were removed by using the best combination of parameters determined as described above and were resuspended in NaCl-Tween buffer for subsequent flow cytometric analysis. Parallel preparations of hybridized and resuspended cells were refiltered on membrane filters for microscopic inspection of the recovered cells.
Treatments were evaluated statistically by using Student's t tests for dependent samples in pairwise comparisons or chi square tests for comparisons of proportions and analysis of variance and post hoc tests for comparisons of multiple groups. Differences were considered significant without further testing when there were nonoverlapping data ranges.
Flow sorting of bacteria.
After removal of hybridized cells from the filters, all cell preparations were counterstained with DAPI (1 μg ml−1). Subsequent analysis and cell sorting were done with a MoFlow flow cytometer (Cytomation Inc., Fort Collins, Colo.) equipped with two argon ion lasers. The first laser was tuned to a wavelength of 488 nm (400 mW) for the excitation of hybridized cells. The second laser was tuned to UV (multilines at 351.1 to 363.8 nm, 100 mW) to detect DAPI-stained cells. Side angle light scatter (SSC) was detected through a 488- ± 10-nm band-pass filter (Cytomation). Green fluorescence from hybridized cells was detected by using a 530- ± 20-nm band-pass filter (Cytomation). DAPI fluorescence was measured with a 450- ± 32-nm band-pass filter (Cytomation). The system threshold was usually set in SSC. Prior to measurements, the instrument was aligned by using Flow Check 2.0- and 0.5-μm yellow-green polystyrene beads and Flow Check 0.5-μm blue beads (Polysciences, Warrington, Pa.). For every measured event all parameters were recorded as pulse height signals and stored in list mode files. Online analysis, sort control, and postanalysis were done with the Summit software, version 3.1 (Cytomation). In a bivariant dot plot diagram of SSC versus DAPI all DAPI-positive cells were selected (gated) and plotted in a second window of SSC versus green fluorescence, thus defining probe-positive objects with a DAPI signal. Sorting of such probe-positive cells was performed at 106,710 Hz at an amplitude of 10.5 V and a delay of 45 14/16 droplets by using an nozzle with an orifice diameter of 70 μm. Correct alignment of sorting was checked by repeated test sorting of a defined number of fluorescent beads (Polysciences).
The instrument tubes were sterilized prior to sorting by using ethanol (96%), and autoclaved 0.1% (wt/vol) NaCl was used as the sheath fluid. The sample line was sterilized by using bleach (1%, vol/vol), ethanol (96%), and autoclaved 0.1% NaCl. In order to keep the instrument under sterile conditions, autoclaved sheath fluid was prefiltered with an in-line filter (filter cartridge; pore size, 0.2 μm; Pall, Ilfracombe, United Kingdom). Double-stained objects were quantified and sorted in the range from 40,000 to 100,000 cells per tube. Sorted cells were checked for purity by epifluorescence microscopy.
16S rRNA gene amplification of sorted cells.
Bacterial 16S rRNA genes from unhybridized (UNHYB library) and hybridized sorted cells were PCR amplified directly from the membrane filters essentially as described previously (23, 55). Briefly, sorted cells were applied onto one-quarter of a punch-hole-size filter (diameter, ca. 4 mm). The filter piece was used directly as a PCR template. PCR water and unused filter pieces were used as negative controls. PCR amplification with general bacterial primers GM3F and GM4R was performed with a Mastercycler (Eppendorf, Hamburg, Germany) as described previously (33). The PCR products were checked by agarose (1%, wt/vol) gel electrophoresis.
Cloning and sequencing.
Amplified 16S rRNA gene fragments from the S-EUB, S-BET, S-CF (cells after CARD-FISH with probes EUB338, BET42a, CF319a, and sorting), and UNHYB (cells not subjected to hybridization and sorting) libraries were purified with a QIAquick PCR purification kit (QIAGEN, Hilden, Germany). Each purified product was ligated by using a pGEM-T-Easy vector kit (Promega Corporation, Madison, Wis.) and cloned into competent cells of Escherichia coli JM109 as described by the manufacturer. The clones were screened for inserts of the correct size by PCR with primers M13F and M13R (29). The plasmids from the positive clones were isolated with a Montage Plasmid Miniprep96 kit (Millipore) used according to the manufacturer's instructions. The plasmid inserts were sequenced with an ABI PRISM 3100 genetic analyzer (Applied Biosystems, Foster City, Calif.) by using primers GM1 (32), M13F, and M13R (29).
Phylogenetic analysis and probe design.
The sequences were analyzed by using the BLAST queuing system (http://www.ncbi.nlm.nih.gov/BLAST/) (1) to identify their closest relatives and their tentative phylogenetic positions. Almost complete sequences that were related to β-proteobacteria were subjected to detailed phylogenetic analysis by using the ARB software package (http://www.arb-home.de). These sequences were manually assembled by using the Sequencher software (Gene Codes Corp., Ann Arbor, Mich.) and were checked for chimeric origin by the tools provided by the Ribosomal Database Project (8; http://rdp.cme.msu.edu/html/). For reconstruction of phylogenetic trees, only nearly complete sequences longer than 1,400 nucleotides were considered. A 50% base frequency filter for β-proteobacteria was calculated for these sequences to exclude highly variable positions. The corresponding ARB tools were used to perform maximum-parsimony, neighbor-joining, and maximum-likelihood analyses. A consensus tree was produced by introducing multifurcations into the maximum-likelihood tree when there was disagreement between the different reconstruction approaches. Selected partial sequences were added to this tree by using maximum-parsimony strategies without allowing changes in the overall topology.
Oligonucleotide probes for a β-proteobacterial cluster (OM43 clade) (43) that contained sequences from sorted cells were designed by using the appropriate ARB tools. Stringent conditions for FISH with Cy3-monolabeled probes and CARD-FISH with HRP-labeled probes were established by determining fluorescence intensities of hybridized cells at increasing concentrations of formamide (38).
Nucleotide sequence accession numbers.
Nucleotide sequences determined in this study have been deposited in the GenBank database under accession numbers AJ630664 to AJ630750 and AJ704979 to AJ704985.
RESULTS
Optimization of cell removal strategies.
The cell loss after CARD-FISH of filter sections not embedded in agarose was 8% ± 3% (mean ± standard deviation) compared to preparations that were not subjected to any treatment and 6% ± 3% compared to agarose-embedded filter sections. The fractions of cells hybridized by probe EUB338 in unembedded and agarose-embedded filter sections were 85.6% ± 2.4% and 84% ± 0.4%, respectively. The difference between the two treatments was not statistically significant (P > 0.05, as determined by Student's t test; n = 4). The hybridization procedure apparently increased the attachment of cells to the filter surface. A significantly smaller fraction of cells could be removed from filter sections after CARD-FISH staining than from unhybridized preparations (Fig. 1a). Vortexing proved to be better than sonication for removal of hybridized cells (Fig. 1a). Preincubation of hybridized filter sections in sterile water or various chemical agents followed by vortexing resulted in different rates of cell removal (Fig. 1b). In general, incubation at 37°C resulted in superior cell removal rates compared to incubation at room temperature (P < 0.05, as determined by Student's t test; n = 18).
FIG. 1.
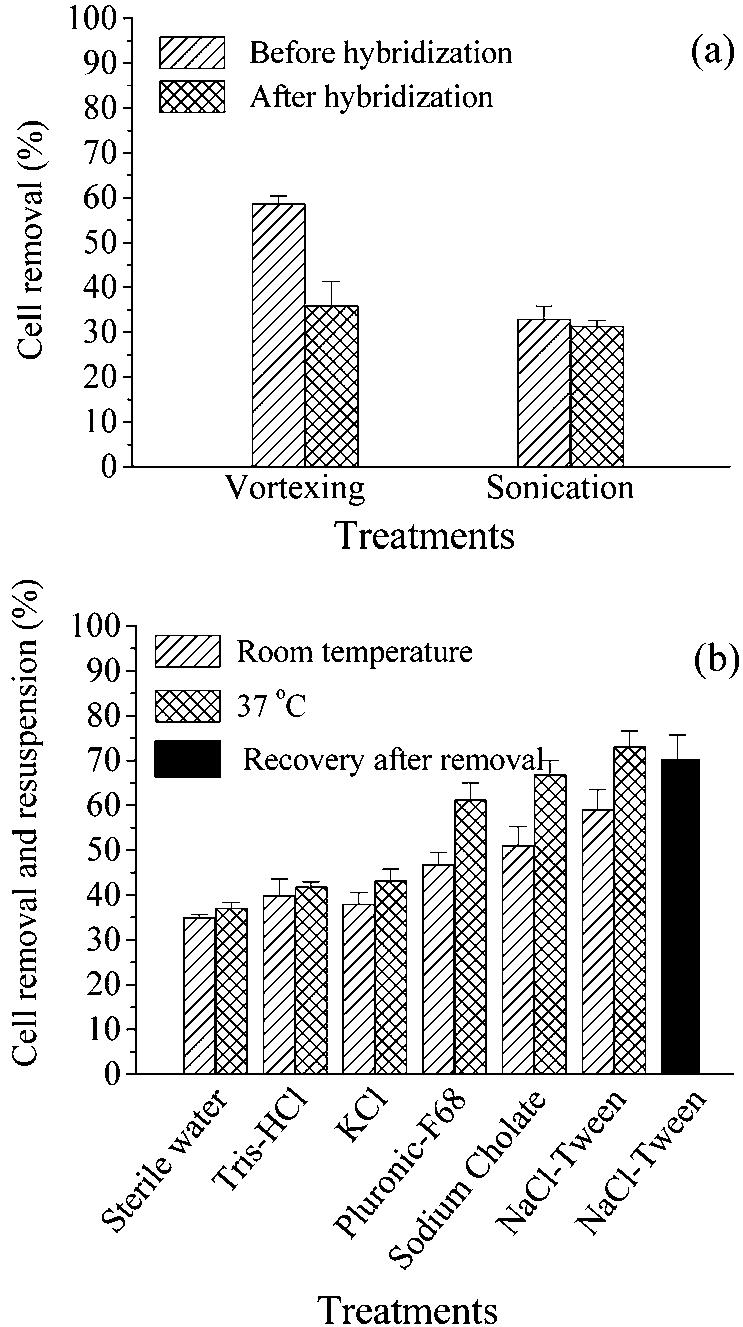
Efficiency of strategies for removal of bacterial cells from membrane filters. (a) Vortexing and sonication prior to and after CARD-FISH. (b) Preincubation of hybridized filters in different chemicals and at different temperatures, followed by vortexing for 10 min. The solid bar indicates the fraction of bacteria actually recovered with the optimized treatment, as determined by a second filtration of the resuspended cells. The error bars indicate standard deviations for triplicate experiments.
The best strategy for cell removal was found to be pretreatment with NaCl-Tween at 37°C for 30 min, followed by vortexing. This resulted in a cell removal value of 73% ± 3% for DAPI-stained cells. After filtration of the resuspended cells on new polycarbonate filters, 70% ± 5% of the original cells in untreated samples could be recovered (Fig. 1b). Microscopic examination confirmed the integrity of the refiltered cells. Therefore, this treatment was selected for removal of filtered and hybridized cells from North Sea waters and subsequent flow sorting.
Microbial community composition in the environmental sample.
The fractions of cells that hybridized with different oligonucleotide probes in the sample from the coastal North Sea analyzed are shown in Table 1. Around 91% ± 1% of DAPI-stained cells could be visualized by CARD-FISH with HRP-labeled oligonucleotide probe EUB338. The fraction of cells that hybridized with probe ALF968 was 27% ± 1% of the total cells, and 11% ± 1% of these cells were detected by a probe specific for the α-proteobacterial Roseobacter clade (probe ROS537).
Surprisingly, a considerable fraction of the total cells (9% ± 3%) was visualized with probe BET42a targeted to the β subdivision of the Proteobacteria (Fig. 2a). This unusual occurrence of β-proteobacteria in a marine sample was in contrast to previous findings (17); therefore, we confirmed these findings by using samples obtained at other times. The fractions of cells hybridizing with BET42a in samples collected from the same environment on 26 August, 2 September, and 25 October 2002 were 5% ± 1%, 4% ± 1%, and 4% ± 1% of the total cell counts, respectively. To confirm the specificity of probe BET42a, which had only one mismatch with γ-proteobacteria (28a), simultaneous CARD-FISH staining of filter sections with the BET42a and GAM42a probes was performed by using two different fluorochromes. In these preparations, no double staining of cells with both probes was observed (Fig. 2a).
FIG. 2.

Photomicrographs of bacteria stained with DAPI and hybridized with HRP-labeled oligonucleotide probes. For each panel, the left image shows DAPI staining and the right shows hybridized cells. (a and b) Environmental sample. (a) Double hybridization with probes BET42a (red) and Gam42a (green). (b) Probe CF319a. (c and d) Cells after sorting. (c) Probe BET42a. (d) Probe CF319a. (e and f) Environmental sample. (e) Probe OM43-162. (f) Probe Nso1225. Scale bar = 5 μm.
The fraction of cells that were hybridized exclusively by probe GAM42a was 20% ± 2% of the total cells. The major fraction of this γ-proteobacterial group was detected by probe SAR86-1245 specific for members of the SAR86 clade (15% ± 2% of the total cells). A substantial fraction of cells (29% ± 4%) was hybridized by probe CF319a, which was targeted to many members of the Cytophaga-Flavobacterium-Bacteroides (CFB) group (Fig. 2b).
Flow sorting of environmental samples.
For flow cytometric analysis unembedded filter sections were hybridized with probes EUB338, BET42a, CF319a, and NON338. Hybridizations were carried out under conditions that were as aseptic as possible to minimize the risk of contamination. Cells that had been removed from the filter sections after CARD-FISH by the protocol described above were counterstained with DAPI prior to analysis by flow cytometry. Hybridized cells were distinguished from unhybridized bacteria and debris in bivariate dot plots of SSC versus fluorescence emission of DAPI and fluorescein (Fig. 3). Sixty-three percent of DAPI-stained cells hybridized with EUB338, but only 0.7% of the cells that hybridized with probe NON338 also had positive green fluorescence signals. Subsequently, at least six replicate samples containing 5 × 10⁴ to 6 × 10⁴ double-stained objects from preparations hybridized with probes EUB338, BET42a, and CF319a were sorted. Batches of sorted cells were then examined under the microscope for purity. The sorting purity of cells hybridized with the various probes ranged from 96 to 97% for DAPI-stained cells (Fig. 2c and d). Cells removed from the filters that had been previously hybridized with NON338 and subsamples of sheath fluid (500 μl) collected prior to and after sorting were refiltered on membrane filters for microscopic examination. The cells that had been hybridized with NON338 included DAPI-stained cells but not positive probe cells. In 500 μl of sheath fluid filtered on membrane filters neither DAPI- nor fluorescein-stained cells could be detected (data not shown).
FIG. 3.

Flow cytometric analysis of bacterial cells in North Sea surface water sample after CARD-FISH and resuspension. (a) Probe EUB338. (b) Probe NON338. (c) Probe CF319a. (d) Probe BET42a. The dot plots are plots of DAPI fluorescence versus probe fluorescence. Double-stained cells within the gate indicated were sorted for subsequent molecular analysis.
Amplification of 16S rRNA of unhybridized and hybridized sorted cells.
Fifty thousand to 60,000 sorted cells that were hybridized with probes EUB338, BET42a, and CF319a were loaded onto custom-cut polycarbonate membrane filters that were approximately 4 mm in diameter. After thorough rinsing with sterile water, one-quarter of each filter was used as a template for PCR amplification of the 16S rRNA gene. The minimal number of cells required for positive amplification had been determined previously (1.8 × 10⁴ cells). Fractions of polycarbonate membrane filters that were larger than 12 mm2 (i.e., one-half of a circular piece of membrane filter with a diameter of 4 mm) had an inhibitory effect on the PCR amplification (data not shown). Amplification products could be obtained from the filter sections that were not subjected to any treatment and from all batches of the sorted cells after CARD-FISH. No PCR amplification products were obtained from filters containing sheath fluids prior to and after sorting of hybridized cells, from polycarbonate membrane filters without filtered cells, or from the sterile water used for rinsing the filters.
Clone libraries.
Ninety-six 16S rRNA gene clones from the UNHYB library and 48 16S rRNA gene clones each from the S-EUB, S-BET, and S-CF libraries were sequenced. Eighty-three, 38, 40, and 41 partial sequences that were 650 to 700 bp long were obtained from these clone libraries, respectively. A representative overview of the phylogenetic affiliations of the sequences obtained is shown in Table 2.
TABLE 2.
Overview of 16S rRNA gene sequence types from a clone library of North Sea surface water and from libraries of sorted cells after hybridization with probes EUB338, BET42a, and CF319a
| Accession no. | Closest relative in GenBank database (accession no.) | % Similarity | Phylogenetic affiliation | Library(ies)a |
|---|---|---|---|---|
| AJ630664-AJ630667 | Pelagibacter ubique (AF510191) | 98-99 | SAR11 cluster, α-proteobacteria | a,b,c,d |
| AJ630668-AJ630670 | Clone OM188 (U70687) | 98-99 | a,b,c | |
| AJ630671 | Clone OM155 (U70686) | 96 | b | |
| AJ630672, AJ630673 | Clone MB11B07 (AY033299) | 99 | a,b | |
| AJ630674-AJ630676 | Clone MB11F01 (AY033309) | 98-99 | b,c,d | |
| AJ630677 | Clone Arctic 97A-7 (AF353236) | 97 | b | |
| AJ630678 | Clone OM143 (U70685) | 99 | Rhodobacteriales, α-proteobacteria | a |
| AJ630679 | Roseobacter sp. strain SKA44 (AF261065) | 95 | a | |
| AJ630680 | Roseobacter sp. strain NAC1-19 (AF245628) | 99 | a | |
| AJ630681 | Roseobacter sp. strain NAC11-7 (AF245635) | 99 | c | |
| AJ630682, AJ630683 | Maricaulis salignorans (AJ227806) | 88-89 | a,c | |
| AJ630684, AJ630685 | Clone OCS126 (AF001638) | 92-99 | SAR116, α-proteobacteria | a,b |
| AJ704979, AJ704980, AJ630748 | Clone OM43 (U70704) | 99 | Methylophilales, β-proteobacteria | a,b,c |
| AJ704981, AJ704982 | Burkholderia kurkuriensis (AB024310) | 92 | Burkholderiales, β-proteobacteria | a,b |
| AJ704983 | Variovorax sp. strain WDL1 (AF538929) | 97 | c | |
| AJ704984, AJ630749, AJ704985 | Nitrosospira sp. strain Nsp57 (AY123791) | 93-97 | Nitrosomonadales, β-proteobacteria | b,c,d |
| AJ630686 | Pseudoalteromonas sp. strain ANT6 (AF025576) | 99 | Alteromonadales, γ-proteobacteria | a |
| AJ630687-AJ630689 | Pseudoalteromonas sp. strain SUR560 (AB038036) | 98-99 | a,c,d | |
| AJ630690, AJ630691 | Pseudoalteromonas sp. strain KMM3562 (AY387858) | 97-99 | a,d | |
| AJ630692, AJ630693 | Marinobacter sp. strain 2sq31 (AJ429499) | 92-98 | a,b | |
| AJ630694 | Marinobacter sp. (AJ567576) | 90 | b | |
| AJ630695 | Colwellia sp. (AF424148) | 98 | c | |
| AJ630696 | Shewanella algae (X81622) | 91 | c | |
| AJ630697 | Moraxella osloensis (AF005190) | 99 | Pseudomonadales, γ-proteobacteria | c |
| AJ630698 | Oleispira antarctica (AJ426420) | 96 | Oceanospirillales, γ-proteobacteria | a |
| AJ630699 | Marinomonas protea (AJ238597) | 98 | a | |
| AJ630700 | Oleiphilus messinensis (AJ295154) | 96 | a | |
| AJ630701 | Halomonas sp. strain mp1 (HSP551115) | 89 | b | |
| AJ630702, AJ630703 | Clone OCS5 (AF173975) | 97-99 | SAR86, γ-proteobacteria | a,b |
| AJ630704, AJ630705 | Clone OCS44 (AF001650) | 98-99 | a,b | |
| AJ630706, AJ630707 | Clone MB12G02 (AY033328) | 98-99 | b,d | |
| AJ630708-AJ630710 | Clone HTCC2188 (AY386344) | 93-98 | OM182 clade, γ-proteobacteria | a,b,c |
| AJ630711 | Clone HTCC2121 (AY386341) | 99 | SAR92 clade, γ-proteobacteria | c |
| AJ630712, AJ630713 | Cycloclasticus spirillensus (AY026915) | 93-97 | Thiotrichales, γ-proteobacteria | a,c |
| AJ630714 | Dechloromarinus chlorophilus (AF170359) | 90 | γ-Proteobacteria | a |
| AJ630715 | Clone PLY-P3_21 (AY354852) | 97 | γ-Proteobacteria | c |
| AJ630716, AJ630717 | Clone Arctic97A-13 (AF354618) | 98 | Sphingobacteriales, CFB group | c,d |
| AJ630718, AJ630719 | Clone MB11E04 (AY033305) | 98-99 | c,d | |
| AJ630720 | Clone OM273 (U70709) | 89 | d | |
| AJ630721 | Uncultured Polaribacter sp. (AF354621) | 96 | Flavobacteriales, CFB group | d |
| AJ630722, AJ630723 | Gelidibacter sp. (AF513398) | 89-97 | a,d | |
| AJ630724 | Flavobacterium sp. (U85888) | 97 | d | |
| AJ630725 | Flavobacterium frigridarium (AF162266) | 99 | d | |
| AJ630726, AJ630727 | Crocinitomix catalasitica (AB078042) | 91-95 | b,d | |
| AJ630728 | Clone BY71 (AJ298380) | 95 | Bacteroidetes, CFB group | c |
| AJ630729-AJ630731 | Clone PLY-P2-42 (AY354738) | 98-99 | a,c,d | |
| AJ630732, AJ630733 | Clone PLY-P1-77 (AY354779) | 99 | c,d | |
| AJ630734 | Clone EBAC40 (AF268229) | 97 | b | |
| AJ630735 | Clone 1A5 (AY274868) | 99 | b | |
| AJ630736 | Clone 1D10 (AY274838) | 99 | d | |
| AJ630737 | Clone 1A3 (AY274867) | 98 | c | |
| AJ630738 | Clone ARCTIC.123 (AF277538) | 96 | d | |
| AJ630739 | Clone MERTZ_OCM_182 (AF424352) | 90 | d | |
| AJ630740, AJ630741 | Clone OCS155 (AF001652) | 99 | Actinobacteria | a,b,c |
| AJ630742, AJ630743 | Clone SAa03 (AY124414) | 99 | a | |
| AJ630744 | Clone SAb10 (AY124422) | 99 | a | |
| AJ630745 | Clone FBP234 (AY250866) | 93 | b |
a, clone library of North Sea surface water; b, library of sorted cells after hybridization with probe EUB338; c, library of sorted cells after hybridization with probe BET42a; d, library of sorted cells after hybridization with probe CF319a.
In the UNHYB clone library 17, 12, and 31% of the total sequences were closely related to α-, β-, and γ-proteobacteria, respectively, and 13% were related to the CFB group (Fig. 4). The rest of the clone library was composed of sequence types related to δ-proteobacteria, Actinobacteria, Fibrobacter, and Verrucomicrobiae and to plastids of eukaryotes. Six of the 14 α-proteobacterial sequences fell into the family Rhodobacteriaceae, 4 were related to the marine SAR11 cluster, and 4 were related to the marine SAR116 cluster. Nine of the 10 β-proteobacterial sequence types were closely related to the marine OM43 cluster, and 1 was closely related to the genus Burkholderia. Thirteen of the 25 γ-proteobacterial sequences were related to the genus Pseudoalteromonas, and 3 were related to the marine SAR86 cluster. The rest of the γ-proteobacterial sequences were closely related to Oleispira sp., Marinomonas sp., Oceanospirillum sp., and Cycloclasticus sp. Six sequence types were affiliated with the genus Cytophaga, one was affiliated with Flexibacter spp., and four were affiliated with other members of the Bacteroidetes.
FIG. 4.

Fractions of bacterial sequence types affiliated with individual phylogenetic groups in the different 16S rRNA gene clone libraries. The UNHYB library was a library of cells not subjected to hybridization and sorting. The S-EUB, S-BET, and S-CF libraries were produced from cells after CARD-FISH with probes EUB338, BET42a, and CF319a and flow sorting. The numbers above the bars indicate the numbers of sequences in the clone libraries.
In the S-EUB clone library, 29, 18, and 37% of the sequences were related to α-, β-, and γ-proteobacteria of marine origin, respectively (Fig. 4). Bacteria related to the CFB group and to Actinobacteria accounted for around 8% of the clone library. Of the 11 α-proteobacterial sequences, 8 were related to the SAR11 cluster, and 2 were related to the SAR116 cluster. Four of the β-proteobacterial sequences were related to the marine OM43 cluster, two were related to ammonium oxidizers (Nitrosospira), and one was related to Burkholderia. Of the 14 γ-proteobacterial sequences, 7 were related to the SAR86 cluster, 2 were related to Oceanospirillum, 1 was related to Marinobacter, and 1 was related to Colwellia sp. Two sequences related to Cytophaga-Flavobacterium fell into the genus Cytophaga, and one sequence was related to Crocinitomix catalastica.
In the S-BET clone library, only 13% of the sequences were related to β-proteobacteria (Fig. 4), 15% were related to α-proteobacteria, and 15% were related to the CFB group (Fig. 4). Sequences related to γ-proteobacteria accounted for around 50% of the clone library. Of the five β-proteobacterial sequences, three were related to ammonium oxidizers (Nitrosospira), one was related to the OM43 cluster, and one was related to the Burkholderiales.
In the S-CF clone library, around 66% of the sequences obtained were closely related to the CFB group (Fig. 4). The rest were affiliated with the groups of α-proteobacteria (10%), β-proteobacteria (2%) (Fig. 4), and γ-proteobacteria (20%) described above.
Almost complete sequences were obtained for the clones that were related to ammonium oxidizers (Nitrosomonas and Nitrosospira spp.) and the marine OM43 cluster of the β-proteobacteria. Their precise phylogenetic positions are shown in Fig. 5.
FIG. 5.

Phylogenetic relationships of β-proteobacterial 16S rRNA gene sequences from different clone libraries that were affiliated with ammonium oxidizers and with the marine OM43 clade. The tree topology is based on a maximum-likelihood analysis, and multifurcations indicate discrepancies with other reconstruction approaches. Partial sequences added on the basis of parsimony criteria are indicated by asterisks. The vertical lines indicate the groups targeted by probes Nso190, Nso1225 (including the dotted line), and OM43-162. Scale bar = 10% estimated sequence divergence.
FISH with specific probes for β-proteobacteria.
We designed an oligonucleotide probe that targeted sequences obtained during this study, as well as other closely related sequence types belonging to the OM43 cluster (probe OM43-162). When this probe and CARD-FISH were used, around 4% ± 0.2% of the DAPI-stained cells were detected in the North Sea samples collected during March 2003 (Fig. 2e). Two probes for ammonium-oxidizing bacteria (AOB) related to Nitrosospira and Nitrosomonas (31) were also used with this sample. Probes Nso190 and Nso1225 detected around 3.4% ± 0.2% and 4.0% ± 0.4% (Fig. 2f) of the DAPI-stained cells in the same environmental sample. Thus, approximately all cells detected by the general probe BET42a could be assigned to two phylogenetic groups with the specific probes. However, no hybridized cells or very few hybridized cells were detected with these probes in other samples of coastal North Sea surface water collected during August, September, and November 2002.
DISCUSSION
CARD-FISH, flow sorting, and rRNA sequence analysis.
Bacterioplankton cells from coastal marine waters were successfully sorted by flow cytometry after CARD-FISH with specific oligonucleotide probes (Fig. 2). Successful amplification of 16S rRNA genes from a comparatively small number of sorted cells (approximately 1 × 10⁴ to 2 × 10⁴ cells per filter section) was possible even after hybridization, tyramide signal amplification, and flow sorting (Table 2). Thus, the deposition of tyramides on proteins inside the cells did not inhibit the PCR or shield the genomic DNA from the polymerase. With the possible exception of a Burkholderia sp.-related sequence, there was no indication of contaminant DNA from nonmarine microbes in the clone libraries (47) (Table 2). Since this sequence was present in both the library from unsorted cells and the library from sorted cells, it could not have originated from the flow cytometric procedure. Indeed, it is not clear if these bacteria represented contaminants at all, since a complete Burkholderia sp. genome has been recently retrieved by shotgun sequencing of the metagenome from a Sargasso Sea water sample (49). All other approximately 200 sequence types retrieved from the various clone libraries were closely related to known groups of environmental microbes (Table 2).
Sequence types related to the CFB group were substantially more frequent in the clone library after sorting than in the UNHYB clone library (Fig. 4). Such a successful enrichment of bacterial cells after FISH by flow sorting has been reported previously for activated sludge (52) but never for a natural aquatic environment. The CFB group provides a particularly good model for the potential of flow sorting and subsequent molecular analysis in marine samples. Cottrell and Kirchman (9) observed conspicuous underrepresentation of sequence types related to this clade in clone libraries from coastal waters constructed with general bacterial primers. In contrast, the fraction of CFB group-related sequence types obtained in our clone library with comparable primers after flow sorting was more than four times higher than the fraction in the library of unsorted cells (Fig. 4) and twice as high as the fraction in the original water sample, as determined by CARD-FISH with probe CF319a. This illustrates that FISH in combination with flow sorting can be useful for studying the diversity of phylogenetic groups that are common in the environment but are selectively underrepresented after PCR amplification. Thus, this technique represents an alternative to group-specific primers (22), which usually cover only part of the 16S rRNA gene. In addition, FISH and flow sorting may provide a tool to obtain other genes (e.g., functional genes) from specific 16S rRNA-defined bacterial populations.
Interestingly, it was not possible to obtain a significantly higher fraction of β-proteobacteria in a library of cells that had been stained by probe BET42a and sorted than in a library of unsorted cells (Fig. 4). As shown by Wallner et al. (52), the purity of sorted cells might be increased by repeated sorting. No indication of insufficient purity of the PCR template was found, and microscopic inspections confirmed that >95% of the sorted cells were hybridized with probe BET42a (Fig. 2c). Nevertheless, the largest fraction of sequence types in the S-BET library was affiliated with γ-proteobacteria (data not shown), potentially as a consequence of PCR bias. The FISH probes that discriminate between the β- and γ-proteobacteria, BET42a and GAM42a, differ by only a single base (28a). Double hybridization of bacterioplankton cells in the water sample with the two probes confirmed the presence of two distinct cell populations, and no double-stained cells were observed (Fig. 2a). Nevertheless, the possibility that some γ-proteobacteria might possess the target site for probe BET42a rather than the target site for probe GAM42a cannot be excluded (54).
Alternatively, it is also possible that the small fraction of unhybridized cells still present after sorting was significantly more accessible to the PCR primers than the target cells that were subjected to CARD-FISH, thereby introducing a strong bias in favor of such erroneously sorted cells. However, it is hard to conceive why this artifact should affect only cells sorted after CARD-FISH with probe BET42a and not sorted cells hybridized with probe CF319a (Fig. 4). Irrespective of the inexplicably low fraction of β-proteobacterial sequence types in the S-BET library, it was nevertheless possible to obtain additional diversity within this lineage by sorting. Specifically, sequence types related to AOB (Fig. 5) that would have been missed otherwise were obtained.
Populations of β-proteobacteria in North Sea picoplankton.
By using a general probe as well as three specific FISH probes, the occurrence of at least two distinct β-proteobacterial populations in surface waters of the German Bight could be confirmed (Fig. 2e and f). The total fraction of β-proteobacteria could be almost completely explained by the sum of the two populations. This illustrates that the group-specific probe BET42a, if used with caution, may still play an important role in environmental studies (e.g., for defining target groups for subsequent detailed molecular analyses).
A high fraction of β-proteobacteria (Fig. 2e and f and Table 2) is not typical for marine pelagic environments. Previous analyses of the composition of bacterioplankton in lakes and oceans by FISH and comparative rRNA gene sequence analysis suggested that members of this bacterial group are rare in marine surface waters but are a main component of freshwaters (17, 30). This view is supported by the horizontal distribution patterns of different subgroups of proteobacteria along salinity gradients in estuaries (6). Several lineages of β-proteobacteria are found exclusively in freshwater habitats (18, 57), and these groups are usually absent in marine and coastal waters. However, molecular evidence is accumulating that some β-proteobacterial lineages do occur in various marine environments, including the water column and sediments (3, 20, 34, 40, 43, 46). These groups differ from the typical freshwater lineages. In particular, two β-proteobacterial sequence types have been found in clone libraries from marine habitats; these types are ammonia oxidizers (3, 20, 35, 40) and β-proteobacteria related to Methylophilus sp. (43).
AOB play a vital role in the global cycling of nitrogen (24). They are chemolithoautotrophic organisms that are responsible for the rate-limiting step of nitrification in a variety of environments (34, 48, 53). Moreover, nitrifying bacteria are important members of microbial assemblages in activated sludge and wastewater treatment plants (11, 50). Two genera of β-proteobacteria (Nitrosomonas and Nitrosospira) and a genus of γ-proteobacteria (Nitrosococcus) are primarily responsible for ammonia oxidation in marine environments (5, 20, 34, 48, 53). The occurrence of AOB in different marine environments, such as coastal sediments and the polar open ocean, has been confirmed qualitatively by using selective PCR primers for the specific amplification of 16S rRNA genes from ammonia-oxidizing β-proteobacteria (20, 40, 46).
The 16S rRNA gene sequences of sorted β-proteobacterial cells indicated that Nitrosospira-like ammonia oxidizers were present in surface water samples from the North Sea. Phylogenetic analysis of almost complete sequences revealed a close relationship to a sequence type from the marine environment (Fig. 5). The occurrence of bacteria from this lineage in German Bight surface waters was subsequently confirmed by CARD-FISH with two oligonucleotide probes having largely overlapping specificities (Nso190 and Nso1225) (Fig. 5). A substantial fraction of water column microbes in the spring sample could be hybridized with the two probes (Table 1), and these cells were apparently not aggregate associated (Fig. 2f). In contrast, AOB were absent in samples from late summer and autumn 2002 (data not shown). Possibly, AOB in the water column of the German Bight are more frequent during the winter. These bacteria have to compete for limiting amounts of ammonia with heterotrophic bacteria and phototrophs. In coastal North Sea surface waters, ammonia may originate from autochthonous sources, as well as from terrestrial runoff or freshwater input. It is rapidly consumed after the onset of the spring phytoplankton bloom and remains at almost undetectably low levels until late autumn (42). However, the question of AOB seasonality goes beyond the focus of our study, and further investigations are required to substantiate such speculation.
Sequences related to marine β-proteobacterial cluster OM43-Methylophilus methylotrophus were found in all of our clone libraries (Fig. 5). CARD-FISH with a newly designed oligonucleotide probe confirmed that members of this lineage constituted a significant fraction of the spring bacterioplankton in the German Bight (Fig. 2e). In contrast, these bacteria were very rare or absent in samples obtained in other seasons. The sequences obtained are very similar (98 to 99%) to the sequence of clone OM43 that originated from picoplankton of coastal waters off North Carolina (43). The isolate most closely related to the OM43 clade (Fig. 5) is M. methylotrophus str. AS1, an obligate type 1 methylotrophic bacterium found in activated sludge (21). It would be unwise to deduce a physiological property for members of the OM43 clade from such phylogenetic relatedness, and there is no indication of the methylotrophic process in aerobic coastal surface waters. Interestingly, the clade that harbors both Methylophilus and OM43 is phylogenetically rather closely related to the β-proteobacterial anaerobic oxidation of methane (Fig. 5).
Conclusions.
Flow sorting of heterotrophic marine bacteria based on their phylogenetic affiliations is feasible if it is combined with the novel CARD-FISH protocol (36, 37) and with specific procedures for cell detachment from membrane filters. At this stage flow cytometry and CARD-FISH cannot be recommended as an alternative to microscopy for quantitative determination of population sizes, since only 70% of the microbial cells are recovered during the resuspension procedure (Fig. 1b). Rather, our protocol provides a novel means for obtaining a defined number of cells of a particular genotypic population from a mixed microbial assemblage. Thus, this approach might be valuable for investigating the uptake of particular radiolabeled substrates by specific bacterial populations (25, 55) or for gaining insight into functional genes in such populations.
Acknowledgments
This study was supported by the European Union (grant EVK3-2001-00194 BASICS) and by the Max Planck Society.
We thank Cecilia Alonso and Silke Wetzel for technical assistance during construction of the clone libraries.
REFERENCES
- 1.Altschul, S. F., W. Gish, W. Miller, E. W. Myers, and D. J. Lipman. 1990. Basic local alignment search tool. J. Mol. Biol. 215:403-410. [DOI] [PubMed] [Google Scholar]
- 2.Amann, R. I., B. J. Binder, R. J. Olson, S. W. Chisholm, R. Devereux, and D. A. Stahl. 1990. Combination of 16S rRNA-targeted oligonucleotide probes with flow cytometry for analyzing mixed microbial populations. Appl. Environ. Microbiol. 56:1919-1925. [DOI] [PMC free article] [PubMed] [Google Scholar]
- 3.Bano, N., and J. T. Hollibaugh. 2000. Diversity and distribution of DNA sequences with affinity to ammonia-oxidizing bacteria of the beta subdivision of the class Proteobacteria in the Arctic Ocean. Appl. Environ. Microbiol. 66:1960-1969. [DOI] [PMC free article] [PubMed] [Google Scholar]
- 4.Biegala, I. C., F. Not, D. Vaulot, and N. Simon. 2003. Quantitative assessment of picoeukaryotes in the natural environment by using taxon-specific oligonucleotide probes in association with tyramide signal amplification-fluorescence in situ hybridization and flow cytometry. Appl. Environ. Microbiol. 69:5519-5529. [DOI] [PMC free article] [PubMed] [Google Scholar]
- 5.Bothe, H., G. Jost, M. Schloter, B. B. Ward, and K. P. Witzel. 2000. Molecular analysis of ammonia oxidation and denitrification in natural environments. FEMS Microbiol. Rev. 24:673-690. [DOI] [PubMed] [Google Scholar]
- 6.Bouvier, T. C., and P. A. del Giorgio. 2002. Compositional changes in free-living bacterial communities along a salinity gradient in two temperate estuaries. Limnol. Oceanogr. 47:453-470. [Google Scholar]
- 7.Chisholm, S. W., R. J. Olson, E. R. Zettler, R. Goericke, J. B. Waterbury, and N. A. Welschmeyer. 1988. A novel free-living prochlorophyte abundant in the oceanic euphotic zone. Nature 334:340-343. [Google Scholar]
- 8.Cole, J. R., B. Chai, T. L. Marsh, R. J. Farris, Q. Wang, S. A. Kulam, S. Chandra, D. M. McGarrell, T. M. Schmidt, G. M. Garrity, and J. M. Tiedje. 2003. The Ribosomal Database Project (RDP-II): previewing a new autoaligner that allows regular updates and the new prokaryotic taxonomy. Nucleic Acids Res. 31:442-443. [DOI] [PMC free article] [PubMed] [Google Scholar]
- 9.Cottrell, M. T., and D. L. Kirchman. 2000. Community composition of marine bacterioplankton determined by 16S rRNA gene clone libraries and fluorescence in situ hybridization. Appl. Environ. Microbiol. 66:5116-5122. [DOI] [PMC free article] [PubMed] [Google Scholar]
- 10.Cottrell, M. T., and D. L. Kirchman. 2003. Contribution of major bacterial groups to bacterial biomass production (thymidine and leucine incorporation) in the Delaware estuary. Limnol. Oceanogr. 48:168-178. [Google Scholar]
- 11.Daims, H., J. L. Nielsen, P. H. Nielsen, K. H. Schleifer, and M. Wagner. 2001. In situ characterization of Nitrospira-like nitrite oxidizing bacteria active in wastewater treatment plants. Appl. Environ. Microbiol. 67:5273-5284. [DOI] [PMC free article] [PubMed] [Google Scholar]
- 12.Del Giorgio, P. A., J. M. Gasol, D. Vaque, P. Mura, S. Agusti, and C. M. Duarte. 1996. Bacterioplankton community structure: protists control net production and the proportion of active bacteria in a coastal marine community. Limnol. Oceanogr. 41:1169-1179. [Google Scholar]
- 12a.Eilers, H., J. Pernthaler, J. Peplies, F. O. Glöckner, G. Gerdts, and R. Amann. 2001. Isolation of novel pelagic bacteria from the German Bight and their seasonal contribution to surface picoplankton. Appl. Environ. Microbiol. 67:5134-5142. [DOI] [PMC free article] [PubMed] [Google Scholar]
- 13.Fuchs, B. M., M. V. Zubkov, K. Sahm, P. H. Burkill, and R. Amann. 2000. Changes in community composition during dilution cultures of marine bacterioplankton as assessed by flow cytometric and molecular biological techniques. Environ. Microbiol. 2:191-201. [DOI] [PubMed] [Google Scholar]
- 14.Furtado, A. L. D., and P. Casper. 2000. Different methods for extracting bacteria from freshwater sediment and a simple method to measure bacterial production in sediment samples. J. Microbiol. Methods 41:249-257. [DOI] [PubMed] [Google Scholar]
- 15.Gasol, J. M., U. L. Zweifel, F. Peters, J. A. Fuhrman, and Å. Hagström. 1999. Significance of size and nucleic acid content heterogeneity as measured by flow cytometry in natural planktonic bacteria. Appl. Environ. Microbiol. 65:4475-4483. [DOI] [PMC free article] [PubMed] [Google Scholar]
- 16.Giovannoni, S. J., T. B. Britschgi, C. L. Moyer, and K. G. Field. 1990. Genetic diversity in Sargasso Sea bacterioplankton. Nature 345:60-63. [DOI] [PubMed] [Google Scholar]
- 17.Glöckner, F. O., B. M. Fuchs, and R. Amann. 1999. Bacterioplankton compositions of lakes and oceans: a first comparison based on fluorescence in situ hybridization. Appl. Environ. Microbiol. 65:3721-3726. [DOI] [PMC free article] [PubMed] [Google Scholar]
- 18.Glöckner, F. O., E. Zaichikov, N. Belkova, L. Denissova, J. Pernthaler, A. Pernthaler, and R. Amann. 2000. Comparative 16S rRNA analysis of lake bacterioplankton reveals globally distributed phylogenetic clusters including an abundant group of actinobacteria. Appl. Environ. Microbiol. 66:5053-5065. [DOI] [PMC free article] [PubMed] [Google Scholar]
- 19.Gough, H. L., and D. A. Stahl. 2003. Optimization of direct cell counting in sediment. J. Microbiol. Methods 52:39-46. [DOI] [PubMed] [Google Scholar]
- 20.Hollibaugh, J. T., N. Bano, and H. W. Ducklow. 2002. Widespread distribution in polar oceans of a 16S rRNA gene sequence with affinity to Nitrosospira-like ammonia-oxidizing bacteria. Appl. Environ. Microbiol. 68:1478-1484. [DOI] [PMC free article] [PubMed] [Google Scholar]
- 21.Jenkins, O., D. Byrom, and D. Jones. 1987. Methylophilus: a new genus of methanol-utilizing bacteria. Int. J. Syst. Bacteriol. 37:446-448. [Google Scholar]
- 22.Kirchman, D. L., L. Y. Yu, and M. T. Cottrell. 2003. Diversity and abundance of uncultured Cytophaga-like bacteria in the Delaware Estuary. Appl. Environ. Microbiol. 69:6587-6596. [DOI] [PMC free article] [PubMed] [Google Scholar]
- 23.Kirchman, D. L., L. Y. Yu, B. M. Fuchs, and R. Amann. 2001. Structure of bacterial communities in aquatic systems as revealed by filter PCR. Aquat. Microb. Ecol. 26:13-22. [Google Scholar]
- 24.Kowalchuk, G. A., and J. R. Stephen. 2001. Ammonia-oxidizing bacteria: a model for molecular microbial ecology. Annu. Rev. Microbiol. 55:485-529. [DOI] [PubMed] [Google Scholar]
- 25.Lebaron, P., P. Servais, A. C. Baudoux, M. Bourrain, C. Courties, and N. Parthuisot. 2002. Variations of bacterial-specific activity with cell size and nucleic acid content assessed by flow cytometry. Aquat. Microb. Ecol. 28:131-140. [Google Scholar]
- 26.Li, W. K. W. 1989. Shipboard analytical flow cytometry of oceanic ultraphytoplankton. Cytometry 10:564-579. [DOI] [PubMed] [Google Scholar]
- 27.Lindahl, V., and L. R. Bakken. 1995. Evaluation of methods for extraction of bacteria from soil. FEMS Microbiol. Ecol. 16:135-142. [Google Scholar]
- 28.Manz, W., R. Amann, W. Ludwig, M. Vancanneyt, and K.-H. Schleifer. 1996. Application of a suite of 16S rRNA-specific oligonucleotide probes designed to investigate bacteria of the phylum Cytophaga-Flavobacter-Bacteroides in the natural environment. Microbiology 142:1097-1106. [DOI] [PubMed] [Google Scholar]
- 28a.Manz, W., R. Amann, W. Ludwig, M. Wagner, and K.-H. Schleifer. 1992. Phylogenetic oligodeoxynucleotide probes for the major subclasses of Proteobacteria: problems and solutions. Syst. Appl. Microbiol. 15:593-600. [Google Scholar]
- 29.Messing, J. 1983. New M13 Vectors for cloning. Methods Enzymol. 101:20-78. [DOI] [PubMed] [Google Scholar]
- 30.Methé, B. A., W. D. Hiorns, and J. P. Zehr. 1998. Contrasts between marine and freshwater bacterial community composition: analyses of communities in Lake George and six other Adirondack lakes. Limnol. Oceanogr. 43:368-374. [Google Scholar]
- 31.Mobarry, B. K., M. Wagner, V. Urbain, B. E. Rittman, and D. A. Stahl. 1996. Phylogenetic probes for analyzing abundance and spatial organization of nitrifying bacteria. Appl. Environ. Microbiol. 62:2156-2162. [DOI] [PMC free article] [PubMed] [Google Scholar]
- 32.Muyzer, G., E. C. de Waal, and A. G. Uitterlinden. 1993. Profiling of complex microbial populations by denaturing gradient gel electrophoresis analysis of polymerase chain reaction-amplified genes coding for 16S rRNA. Appl. Environ. Microbiol. 59:695-700. [DOI] [PMC free article] [PubMed] [Google Scholar]
- 33.Muyzer, G., A. Teske, C. O. Wirsen, and H. W. Jannasch. 1995. Phylogenetic relationship of Thiomicrospira species and their identification in deep-sea hydrothermal vent samples by denaturing gradient gel electrophoresis of 16S rDNA fragments. Arch. Microbiol. 164:165-172. [DOI] [PubMed] [Google Scholar]
- 34.Nold, S. C., J. Z. Zhou, A. H. Devol, and J. M. Tiedje. 2000. Pacific Northwest marine sediments contain ammonia-oxidizing bacteria in the beta subdivision of the Proteobacteria. Appl. Environ. Microbiol. 66:4532-4535. [DOI] [PMC free article] [PubMed] [Google Scholar]
- 35.Pace, M. L., and J. J. Cole. 1994. Comparative and experimental approaches to top-down and bottom-up regulation of bacteria. Microb. Ecol. 28:181-193. [DOI] [PubMed] [Google Scholar]
- 36.Pernthaler, A., J. Pernthaler, and R. Amann. 2002. Fluorescence in situ hybridization and catalyzed reporter deposition for the identification of marine bacteria. Appl. Environ. Microbiol. 68:3094-3101. [DOI] [PMC free article] [PubMed] [Google Scholar]
- 37.Pernthaler, A., J. Pernthaler, and R. Amann. Sensitive multi-color fluorescence in situ hybridization for the identification of environmental microorganisms. Mol. Microb. Ecol. Man., in press.
- 38.Pernthaler, J., F. O. Glöckner, W. Schönhuber, and R. Amann. 2001. Fluorescence in situ hybridization (FISH) with rRNA-targeted oligonucleotide probes. Methods Microbiol. 30:207-226. [Google Scholar]
- 39.Pernthaler, J., A. Pernthaler, and R. Amann. 2003. Automated enumeration of groups of marine picoplankton after fluorescence in situ hybridization. Appl. Environ. Microbiol. 69:2631-2637. [DOI] [PMC free article] [PubMed] [Google Scholar]
- 40.Phillips, C. J., Z. Smith, T. M. Embley, and J. I. Prosser. 1999. Phylogenetic differences between particle-associated and planktonic ammonia-oxidizing bacteria of the beta subdivision of the class Proteobacteria in the northwestern Mediterranean Sea. Appl. Environ. Microbiol. 65:779-786. [DOI] [PMC free article] [PubMed] [Google Scholar]
- 41.Porter, J., R. Pickup, and C. Edwards. 1997. Evaluation of flow cytometric methods for the detection and viability assessment of bacteria from soil. Soil Biol. Biochem. 29:91-100. [Google Scholar]
- 42.Radach, G., J. Berg, and E. Hagmeier. 1990. Long-term changes of the annual cycles of meteorological, hydrographic, nutrient, and phytoplankton times series at Helgoland and at LV Elbe 1 in the German Bight. Continent. Shelf Res. 10:305-328. [Google Scholar]
- 43.Rappe, M. S., P. F. Kemp, and S. J. Giovannoni. 1997. Phylogenetic diversity of marine coastal picoplankton 16S rRNA genes cloned from the continental shelf off Cape Hatteras, North Carolina. Limnol. Oceanogr. 42:811-826. [Google Scholar]
- 44.Schönhuber, W., B. Fuchs, S. Juretschko, and R. Amann. 1997. Improved sensitivity of whole-cell hybridization by the combination of horseradish peroxidase-labeled oligonucleotides and tyramide signal amplification. Appl. Environ. Microbiol. 63:3268-3273. [DOI] [PMC free article] [PubMed] [Google Scholar]
- 45.Sekar, R., A. Pernthaler, J. Pernthaler, F. Warnecke, T. Posch, and R. Amann. 2003. An improved protocol for the quantification of freshwater actinobacteria by fluorescence in situ hybridization. Appl. Environ. Microbiol. 69:2928-2935. [DOI] [PMC free article] [PubMed] [Google Scholar]
- 46.Stephen, J. R., A. E. McCaig, Z. Smith, J. I. Prosser, and T. M. Embley. 1996. Molecular diversity of soil and marine 16S rRNA gene sequences related to beta-subgroup ammonia-oxidizing bacteria. Appl. Environ. Microbiol. 62:4147-4154. [DOI] [PMC free article] [PubMed] [Google Scholar]
- 47.Tanner, M. A., B. M. Goebel, M. A. Dojka, and N. R. Pace. 1998. Specific ribosomal DNA sequences from diverse environmental settings correlate with experimental contaminants. Appl. Environ. Microbiol. 64:3110-3113. [DOI] [PMC free article] [PubMed] [Google Scholar]
- 48.Teske, A., E. Alm, J. M. Regan, S. Toze, B. E. Rittmann, and D. A. Stahl. 1994. Evolutionary relationships among ammonia- and nitrite-oxidizing bacteria. J. Bacteriol. 176:6623-6630. [DOI] [PMC free article] [PubMed] [Google Scholar]
- 49.Venter, J. C., K. Remington, J. F. Heidelberg, A. L. Halpern, D. Rusch, J. A. Eisen, D. Y. Wu, I. Paulsen, K. E. Nelson, W. Nelson, D. E. Fouts, S. Levy, A. H. Knap, M. W. Lomas, K. Nealson, O. White, J. Peterson, J. Hoffman, R. Parsons, H. Baden-Tillson, C. Pfannkoch, Y. H. Rogers, and H. O. Smith. 2004. Environmental genome shotgun sequencing of the Sargasso Sea. Science 304:66-74. [DOI] [PubMed] [Google Scholar]
- 50.Wagner, M., G. Rath, H. P. Koops, J. Flood, and R. Amann. 1996. In situ analysis of nitrifying bacteria in sewage treatment plants. Water Sci. Technol. 34:237-244. [Google Scholar]
- 51.Wallner, G., R. Amann, and W. Beisker. 1993. Optimizing fluorescent in situ-hybridization with rRNA-targeted oligonucleotide probes for flow cytometric identification of microorganisms. Cytometry 14:136-143. [DOI] [PubMed] [Google Scholar]
- 52.Wallner, G., B. Fuchs, S. Spring, W. Beisker, and R. Amann. 1997. Flow sorting of microorganisms for molecular analysis. Appl. Environ. Microbiol. 63:4223-4231. [DOI] [PMC free article] [PubMed] [Google Scholar]
- 53.Ward, B. B. 1996. Nitrification and denitrification: probing the nitrogen cycle in aquatic environments. Microb. Ecol. 32:247-261. [DOI] [PubMed] [Google Scholar]
- 54.Yeates, C., A. M. Saunders, G. R. Crocetti, and L. L. Blackall. 2003. Limitations of the widely used GAM42a and BET42a probes targeting bacteria in the Gammaproteobacteria radiation. Microbiology 149:1239-1247. [DOI] [PubMed] [Google Scholar]
- 55.Zubkov, M. V., B. M. Fuchs, S. D. Archer, R. P. Kiene, R. Amann, and P. A. Burkill. 2001. Linking the composition of bacterioplankton to rapid turnover of dissolved dimethylsulfoniopropionate in an algal bloom in the North Sea. Environ. Microbiol. 3:304-311. [DOI] [PubMed] [Google Scholar]
- 55a.Zubkov, M. V., B. M. Fuchs, P. H. Burkill, and R. Amann. 2001. Comparison of cellular and biomass specific activities of dominant bacterioplankton groups in stratified waters of the Celtic Sea. Appl. Environ. Microbiol. 67:5210-5218. [DOI] [PMC free article] [PubMed] [Google Scholar]
- 56.Zubkov, M. V., B. M. Fuchs, G. A. Tarran, P. H. Burkill, and R. Amann. 2003. High rate of uptake of organic nitrogen compounds by Prochlorococcus cyanobacteria as a key to their dominance in oligotrophic oceanic waters. Appl. Environ. Microbiol. 69:1299-1304. [DOI] [PMC free article] [PubMed] [Google Scholar]
- 57.Zwart, G., B. C. Crump, M. Agterveld, F. Hagen, and S. K. Han. 2002. Typical freshwater bacteria: an analysis of available 16S rRNA gene sequences from plankton of lakes and rivers. Aquat. Microb. Ecol. 28:141-155. [Google Scholar]