Abstract
The detachment of cells from bacterial biofilms is an important, yet poorly understood and largely unquantified phenomenon. Detached cell clumps from medical devices may form microemboli and lead to metastasis, especially if they are resistant to host defenses and antibiotics. In manufacturing plants detached clumps entering a process stream decrease product quality. Two strains of Pseudomonas aeruginosa, a wild type (PAO1) and a cell signaling mutant (JP1), were studied to (i) quantify and model detachment patterns and (ii) determine the influence of cell signaling on detachment. We collected effluent from a biofilm flowthrough reactor and determined the size distribution for cell detachment events by microscopic examination and image analysis. The two strains were similar in terms of both biofilm structure and detachment patterns. Most of the detachment events were single-cell events; however, multiple-cell detachment events contributed a large fraction of the total detached cells. The rates at which events containing multiple cells detached from the biofilm were estimated by fitting a statistical model to the size distribution data. For events consisting of at least 1,000 cells, the estimated rates were 4.5 events mm−2 min−1 for PAO1 and 4.3 events mm−2 min−1 for JP1. These rates may be significant when they are scaled up to the total area of a real biofilm-contaminated medical device surface and to the hours or days of patient exposure.
The detachment of cells from a bacterial biofilm attached to a surface is a fundamental process in the biofilm life cycle. Detachment occurs when single cells or clumps of cells become separated from the attached biofilm and transfer to the overlying fluid (16, 17). Liquid shear stress (15), starvation (1, 13), and cell signaling (1, 12) are factors that potentially influence detachment. For a biofilm growing in a flowing environment, the detached clumps are able to flow downstream, where they can reattach and establish other biofilms. Biofilm dissemination via detachment contributes greatly to increased health costs (14, 19) and environmental costs (5). In addition, detached clumps from Staphylococcus aureus biofilms exhibit tolerance to antibiotics which is similar to the tolerance of attached biofilms (6). In spite of the importance of detachment, detachment mechanisms are not well understood, and quantitative investigations of the detachment phenomenon have not been conducted.
In this study, we evaluated the frequency of detachment and the size distribution of detached cell clumps from Pseudomonas aeruginosa biofilms. In addition, by comparing the cell clump size distributions for wild-type PAO1 strain and the cell signaling mutant strain JP1, we were able to discern the influence of the cell signal N-3-oxo-dodecanoyl homoserine lactone, which has been shown to influence the structure of the attached biofilm (4), on the sizes of detachment events. In this paper we describe a laboratory methodology for sampling and analyzing detached clumps from a bacterial biofilm; we also estimated the rates at which large detachment events occurred and compared the detachment event distributions of the two strains. Three independent replicate experiments with each strain provided data for assessing the repeatability of the results for this experimental system. Biofilms were established in a flow cell reactor, and samples of the effluent liquid were captured on four separate days within a week after bacterial inoculation of a flowthrough reactor. The samples were filtered, and the sizes of individual bacterial clumps were measured by using microscopy and computer image analysis. The statistical distribution of detachment events involving three or more cells was estimated by fitting a truncated Pareto probability distribution (3, 9, 10) to the observed sizes. The Pareto distribution was devised originally to model the distribution of income (7, 10), but it has been used successfully to model size distributions in biology which are highly skewed, nonnormal distributions (18). From the estimated probability distribution for each experiment, we calculated a detachment rate, which was the number of events larger than a specified size per square millimeter of biofilm-covered surface in the reactor per minute of effluent collection time. The rates were subjected to statistical analysis to ascertain the repeatability of the results and to compare the two strains. Finally, the data from all samples were statistically pooled to arrive at the overall rate estimate for each strain.
MATERIALS AND METHODS
Bacterial strains and media.
Biofilms were grown from the nonmucoid clinical isolate P. aeruginosa PAO1 (9) and strain JP1 (11), a ΔlasI::tet lasI null mutant derived from PAO1 which does not produce the quorum-sensing signal N-3-oxo-dodecanoyl homoserine lactone. Cultures were grown at ambient temperatures (22 ± 2°C). Inoculation cultures were grown for 16 h on a shaker in full-strength Luria-Bertani (LB) broth (20 g/liter; Fisher Biotech, Fairlawn, N.J.). Biofilms were grown with a continuous flow of 0.02× LB broth (400 mg/liter), and the medium was aerated in a mixing chamber located just before the injection site.
Biofilm flowthrough reactor system.
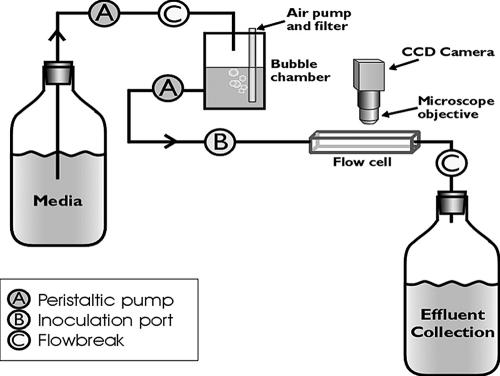
Biofilms were grown in glass flow cells that were 3 by 3 mm square and 200 mm long (model FC 93; BioSurface Technologies Corp., Bozeman, Mont.) with 334 mm of silicone tubing leading to the waste container (Fig. 1), as previously described (12). The total surface area in the system was 56.5 cm2; 24 cm2 was attributable to the flow cell, and 32.5 cm2 was attributable to the silicone tubing. The total volume of the system was 27 ml, as measured volumetrically between the inoculation port and the collection site. Cells were allowed to attach for 45 min after a 2-ml inoculum consisting of 1.96 × 10⁹ ± 1.29 × 10⁹ CFU/ml for PAO1 (n = 13) or 5.54 × 10⁸ ± 1.46 × 10⁸ CFU/ml for JP1 (n = 3) was injected into the inoculation port located just before the flow cell and kept in batch mode. The flow was turned on, and the biofilms were grown at a flow rate of 1 ml min−1 at room temperature (22 ± 2°C). The system had a residence time of 12.3 min, which was much less than the doubling times (4.52 h for PAO1 and 6.80 h for JP1), so we assumed that the cells found in the effluent were a result of detachment, not planktonic growth. The experiments were conducted for 7 days.
FIG. 1.
Schematic diagram showing the main components of the flowthrough system. CCD, charge-coupled device.
Reactor sterilization.
The reactor system was autoclaved at 121°C for 30 min. The sterility of the reactor system was confirmed by sampling the effluent prior to inoculation and plating 0.1 ml on LB agar.
Microscopy and image analysis.
Observations of biofilm development in situ were made by using a camera (COHU 4910 series monochrome charge-coupled device) mounted on an Olympus BH2 microscope. Effluent was examined with a Nikon (Eclipse E800) epifluorescence microscope on which a camera was mounted and with a Leica TCSNT confocal microscope. Images were processed by using the Scion Image software and a DigitalScion VG-5 PCI framestore board (Scion Corporation).
Biofilm surface area coverage and thickness measurement.
Digital gray-scale images from three independent experiments were captured daily by using a ×20 objective. Means and standard deviations for surface area coverage were calculated by using five random locations. Biofilm thickness was measured by using stage movement and focusing on the inner wall of the flow cell through to the bulk fluid side of the biofilm. Notches on the focusing dial were calibrated, which provided a conversion factor of 1.36 for determining the thickness in micrometers.
Collection and analysis of effluent samples. (i) Enumeration of cells in the effluent by VCC.
Effluent samples (0.5 ml) were serially diluted in 0.25× Ringer's solution (Oxoid Ltd., Basingstoke, Hampshire, England), and the cell counts were determined by the drop plate method. The dilutions were plated onto LB agar plates which were incubated for 16 h at 37°C. The viable cell counting (VCC) results are reported below as means ± standard deviations for three independent experiments. Enumeration of JP1 was also performed on LB agar with tetracycline (500 μg/ml) to confirm the integrity of the mutant.
(ii) Enumeration of cells in the effluent by microscope analysis.
The total cell count (TCC) was based on microscopic examination of a membrane surface after an effluent sample had been filtered (see below). The TCC results are reported below as means ± standard deviations for three independent experiments.
(iii) Sampling for detached clump size analyses.
The number and size distribution of detached cell clumps were assessed for effluent samples that were collected daily on ice for 30 min. To prevent physical disruption of the clumps, large-aperture pipette tips were used to handle the samples. One milliliter of a 1:100 dilution of the effluent was stained with LIVE/DEAD stain (BacLight bacterial viability kit; Molecular Probes, Eugene, Oreg.) for 15 min and vacuum filtered onto a black polycarbonate membrane with a 0.22-μm pore size. Fifty images, each with a field area of 5,903 μm2, were captured by using WinView software (Roper Scientific, Inc.) and a Nikon epifluorescence microscope with a ×100 oil immersion objective.
(iv) Counting and determining the sizes of detached particles.
Since confocal imaging showed that the clumps flattened out on the filter membrane, we could relate the clump area to the number of cells within an individual clump (16). A 1-mm graticule with 10-μm divisions (reference no. CS990; Graticules, Tonbridge, Kent, United Kingdom) was used for converting pixels to microns. The pixel area of each event was calculated automatically by the Scion Image software. The event areas were used in the probability distribution analysis (see below).
The results of the statistical analysis of area per event were converted into a more relevant size measurement, number of bacterial cells per event. For each experiment, a calibration sample was used to associate the area covered by each individual clump with the corresponding number of bacteria in the clump as determined by manual counting from a digital image of the clump. The median areas of single cells on the filters were 0.71 μm2 (±0.03 μm2; n = 157 cells) for PAO1 and 0.97 μm2 (±0.06 μm2; n = 120 cells) for JP1. For clumps (cells plus the exopolymeric slime matrix) containing two or more cells, the median area per cell for PAO1 was 1.21 μm2 (standard error, 0.12 μm2; n = 37 events); the largest clump in the calibration sample contained 388 cells. For JP1, the median area was 0.86 μm2/cell (standard error, 0.04 μm2; n = 77 events), and the largest clump in the calibration sample contained 149 cells. Microscopic examination suggested that the larger area per cell for PAO1 occurred because the cells produced more voluminous exopolymeric slime, which resulted in the cells being spread further apart when a clump was flattened on a filter (data not shown). These areas were used to convert from the area to a corresponding number of cells per detachment event.
Statistical analysis.
Since preliminary results showed that large detachment events occurred infrequently and the observed sizes for large events were irregularly spaced, we decided to utilize the three-parameter Pareto probability distribution (8): Prob{Y>y} = [1 + (y − c)/a]−b, where y > c; a, b, and c are empirical constants; Y is the clump size (expressed as area) of a random detachment event; y is a specified clump size; and Prob {Y>y} is the probability that the random variable Y is at least as large as the specified y.
The estimation method amounted to finding the numerical values of a, b, and c so that the corresponding Pareto model was as close to the observations as possible, where closeness was quantitatively measured by the Anderson-Darling discrepancy measure (2, 3). The parameter values were found by using a computer program that was written in the statistical programming language R (freely available from the Comprehensive R Archive Network at http://cran.r-project.org/). Our R language computer programs are available on the worldwide web at http://www.erc.montana.edu/Res-Lib99-SW/Downloads/default.htm.
The model was fit separately for each sample for each experiment. Then for each bacterial strain the three estimated models were pooled in one overall model for that strain. The main result of the analysis was the fitted Pareto model, converted to a rate as described below.
Our goal of estimating the probability of large detachment events was complicated by the fact that the bulk of the observed events were small, consisting of only one or two cells. We found that the many small detachment events (single cells and small clumps) had a profound influence on the probability prediction of the Pareto model for large events. For this reason, we used only those observed areas that correspond to three or more cells when we fit the model. The analysis properly accounted for the large number of small events (one or two cells), but we did not try to fit the shape of the probability distribution to those small events. The formula which we used for calculating the Anderson-Darling discrepancy estimate from large events (three or more cells) was derived by Daly (3).
R(v) is the rate at which events containing at least v bacterial cells per square millimeter per minute occur. Calculation of R(v) requires the conversion factor (CF) that adjusts the total number of events in the observed fields on the filter (N) to account for the reactor, sampling conditions, and dilution, as follows: CF = (Afilter × Q × DF)/(VF × Afield × number of fields × Areactor), where Afilter is the area of the filter (in square millimeters), Q is the volumetric flow rate (in milliliters per minute), DF is the dilution factor, VF is the volume of diluted effluent that was filtered (in milliliters), Afield is the field area (in square millimeters), number of fields is the number of microscopic fields sampled on the filter, and Areactor is the growth area in the entire reactor (in square millimeters). The product of N × CF was the total number of detachment events per minute per square millimeter. If yv-[1/2] is the area that corresponds to v-[1/2] cells, then the rate was as follows: R(v) = N × CF × Prob{Y>yv-[1/2]}. For each experiment, we obtained estimates of the rates of occurrence of events for sizes of at least 10, 100, and 1,000 cells [R(10), R(100), and R(1,000), respectively].
RESULTS
Biofilm dynamics.
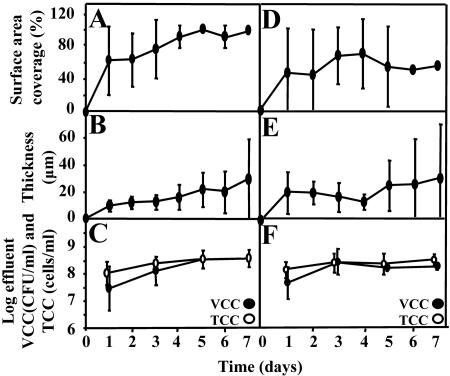
Both PAO1 and JP1 formed homogeneous biofilms, and attachment was evenly distributed for both strains. The surface area coverage for the PAO1 biofilm after 1 day was 61% ± 42% (mean ± standard deviation). By day 5, the flow cell was 100% covered (Fig. 2A) and the biofilm had reached a steady state. The mean thickness of the PAO1 biofilm was 9.5 ± 3.8 μm on day 1, and it increased to 28.9 ± 30.1 μm by day 7 (Fig. 2B). A trend in biofilm roughness was indicated by the increasing standard deviation of thickness with time. The surface area coverage for the JP1 biofilm after 1 day was 43% ± 51% and remained relatively steady throughout the 7-day period; the maximum coverage was 65% ± 39% (Fig. 2D). The mean biofilm thickness for the JP1 biofilm was 19.4 ± 16.1 μm after 1 day, and it increased to 29.2 ± 42.3 μm after 7 days (Fig. 2E). The JP1 biofilm also exhibited increasing roughness with time. Digital time-lapse microscopic imaging showed relatively flat biofilms with little variety in morphology (Fig. 3), although larger aggregates occasionally detached and large sections sometimes peeled or sloughed off the surface.
FIG. 2.
Dynamics of PAO1 (A, B, and C) and JP1 (D, E, and F) biofilm development. Surface area coverage (A and D), thickness (B and E), and effluent cell concentrations in terms of total cell counts and viable cell counts (C and F) were determined. The error bars indicate one standard deviation.
FIG. 3.
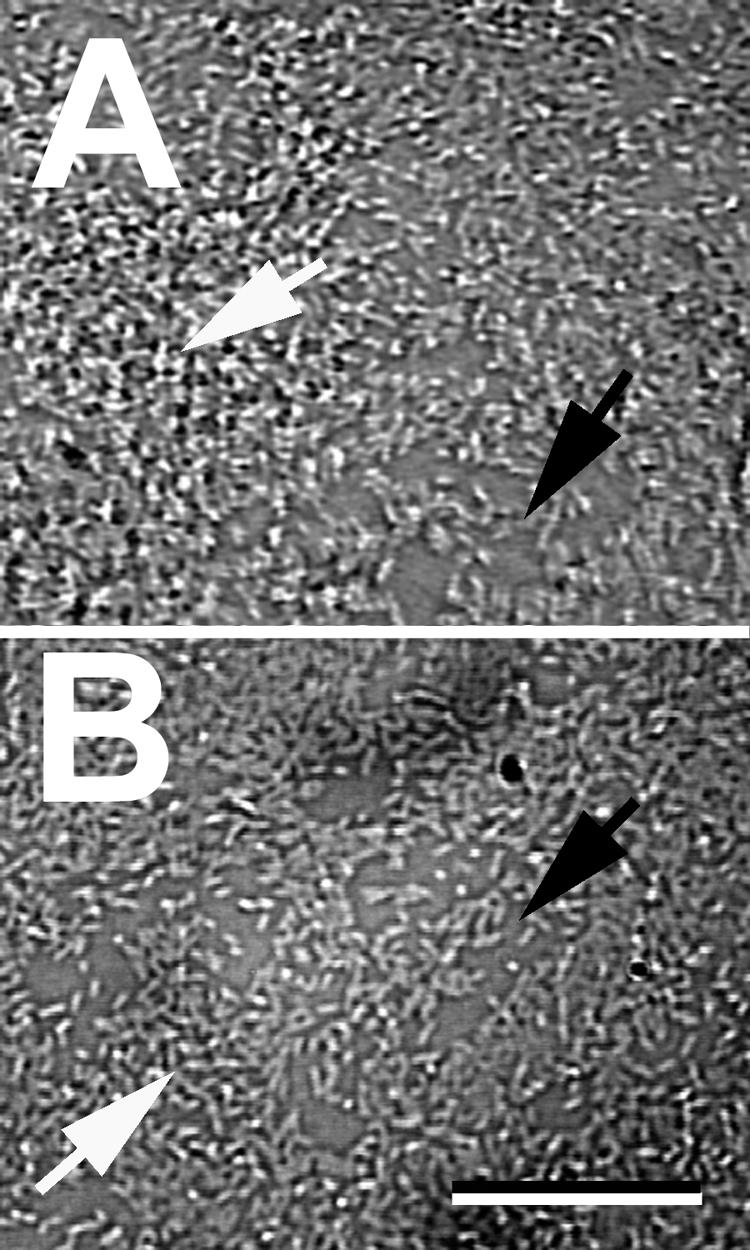
Structure of P. aeruginosa PAO1 biofilm on day 6 (A) and JP1 biofilm on day 4 (B). Both biofilms were relatively flat and consisted of small mounds (white arrows) and areas of exposed substratum (black arrows). Scale bar = 10 μm.
Viable and total cell counts in effluent.
The time trends for TCC and the ratio of VCC to TCC were similar for PAO1 and JP1 (Fig. 2C and F). The total cell counts in the effluents from PAO1 and JP1 biofilms showed average detached cell rates of 3.02 × 10⁴ and 1.01 × 10⁴ cells min−1 mm−2, respectively. Most of the detached cells were viable (94% for PAO1 and 83% for JP1). For both strains, the TCC and VCC remained relatively constant from day 3 to day 7. Statistical analysis of the log-transformed counts showed that there was no statistical difference between the strains or between TCC and VCC (P = 0.16, as determined by an F test). The counts on day 1 had a significantly lower mean (P < 0.04, as determined by a Bonferonni test) than the counts on days 3 to 7, which were not different from each other (P = 1.0, as determined by a Bonferonni test).
Detached clump sizes.
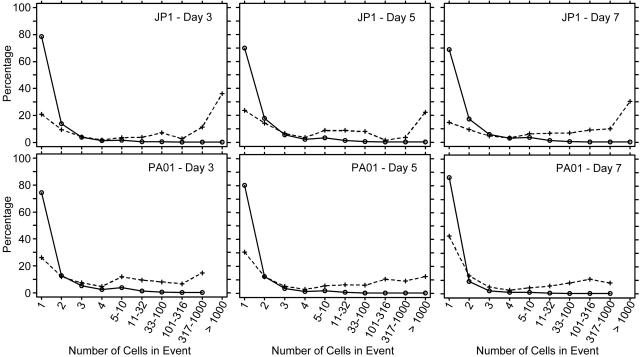
The detachment analysis treated the data from days 3 to 7 as three independent samples from a steady-state biofilm. The rates for detachment events were 5.14 × 10⁴ events min−1 mm−2 for PAO1 and 2.42 × 10⁴ events min−1 mm−2 for JP1. The detached biomass collected on the filters showed a wide range of sizes, from single cells to large clumps containing more than 1,000 cells (Fig. 4). The importance of large detachment events was evaluated in two ways, relative to the total number of detachment events and relative to the total number of detached cells. Both measures are shown in Fig. 5. Most of the events involved one or two cells. For both strains, at least 70% of the events were single-cell events and at least 9% of the events involved two cells. Relative to the total number of cells in the effluent, however, the large events made a substantial contribution. Clumps containing more than 100 cells constituted less than 0.28% of all detachment events but accounted for as much as 37% of all detached cells for the PAO1 biofilms and as much as 49% of all detached cells for the JP1 biofilms. Clumps containing more than 1,000 cells constituted less than 0.04% of all detachment events but accounted for as much as 12% of all detached cells for the PAO1 biofilms and as much as 36% of all detached cells for the JP1 biofilms.
FIG. 4.
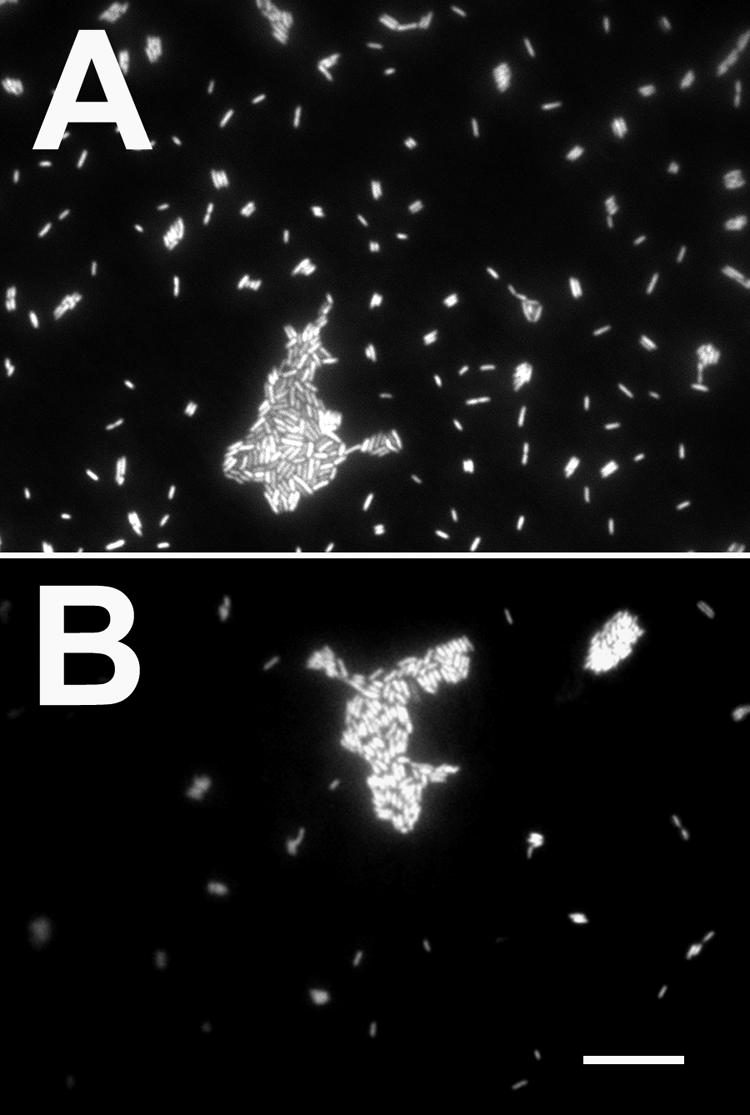
Filtered diluted (1:100) effluent from PAO1 (A) and JP1 (B) biofilms showing single cells and clumps of cells. Samples were stained with a Molecular Probes LIVE/DEAD kit.
FIG. 5.
Clump size frequency distribution for biofilm detachment events, expressed as percentages of detachment events (solid line) and detached cells (dashed line). The percentages were averaged for triplicate experiments for each sample time for each strain.
Rate of large detachment events.
The rate based on a Pareto model fit was estimated separately for each sample. Table 1 shows the means of the rates for v = 10, v = 100, and v = 1,000 for each species. Each mean is the average of nine rates, corresponding to three sampling times for each of three experiments. The analysis of variance F tests showed that the PAO1 and JP1 mean rates were not statistically significantly different (P = 0.81 for v = 10; P = 0.64 for v = 100; and P = 0.65 for v = 1,000).
TABLE 1.
Rate at which large biofilm detachment events occurred for each of the P. aeruginosa strains
| Strain | No. of events mm−2 min−1a
|
||
|---|---|---|---|
| v = 10 | v = 100 | v = 1,000 | |
| PAO1 | 503.0 ± 183.7 | 61.51 ± 21.11 | 10.173 ± 3.551 |
| JP1 | 437.8 ± 183.7 | 46.48 ± 21.11 | 7.782 ± 3.551 |
R(v) was averaged across three experiments and three samples within each experiment. The values are means ± standard errors.
Table 2 shows the analysis of variance results pertaining to the variability of R(v) values. The repeatability standard deviation, which is the typical distance between the R(v) estimate for a single sample in a single experiment and the mean R(v) for many experiments and samples, was approximately the same as the associated mean shown in Table 1. The within-experiment sources of variability contributed more to the total variance than the between-experiment sources contributed. These results indicate that workers should collect multiple samples in each experiment and perform multiple experiments in order to average the variability and arrive at a reliable rate estimate.
TABLE 2.
Analysis of variancea
| Parameter | Result at:
|
||
|---|---|---|---|
| v = 10 | v = 100 | v = 1,000 | |
| Repeatability standard deviation of R(v) estimates | 394.5 | 53.47 | 10.65 |
| Within-experiment variability (%) | 52 | 80 | 100 |
| Between-experiment variability (%) | 48 | 20 | 0 |
These results apply to both the PAO1 and JP1 biofilms. Results show the repeatability standard deviation for the estimates of R (v) based on the Pareto statistical model and the relative contributions of within- and between-experiment variances to the variability of R (v) estimates, where v indicates the minimum number of cells in the detachment event.
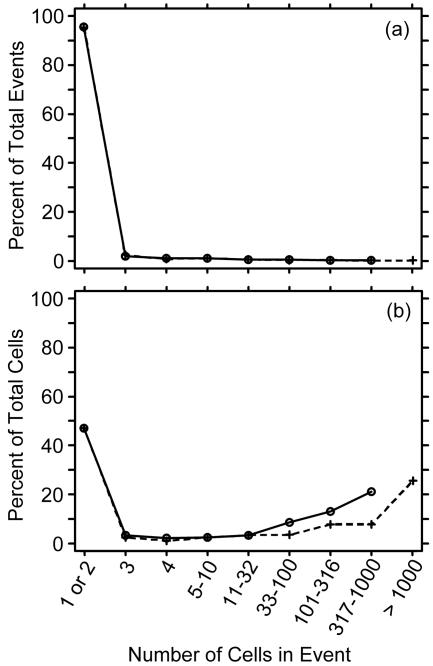
Figure 6 shows a goodness-of-fit evaluation that was typical of the 18 samples to which the Pareto model was fit. The Pareto model prediction for the percentage of events in each size class was very close to the observed percentage (Fig. 6a), and the prediction for the percentage of detached cells attributable to a size class was reasonably close to the observed percentage, although the sporadic occurrence of large events produced highly variable observations (Fig. 6b).
FIG. 6.
Typical goodness-of-fit plot, showing how closely the model (dashed line) matched the observed clump size distribution (solid line). The abscissa was constructed so that the large event size classes are a constant width on a log scale. (a) Distribution expressed as a percentage of all events. The solid line overlays the dashed line, showing an excellent fit. The model is extrapolated to one size class beyond the largest observed clump. (b) Distribution expressed as a percentage of all detached cells. For large size classes, the observations fluctuate around the smooth model because the large events were more statistically variable than the smaller events.
Analyzing the samples separately provided an assessment of the repeatability of the results, the components of variability, and a statistical comparison of the strains. However, to arrive at the best rate estimate for each strain, all the samples for a strain were statistically pooled, and one Pareto model was fit. The resulting overall rate estimate for PAO1 was R(v) = 5.14247 × 104 × [1 + (v + 5.287)/0.124]−1.038, and for JP1 it was R(v) = 2.42166 × 104 × [1 + (v + 0.960)/0.123]−0.960. Figure 7 shows a log-log plot of R(v) versus v for PAO1 and JP1 for v ≥ 3. The PAO1 overall model yielded R(v) estimates of 345.5, 46.98, and 4.524 for v = 10, v = 100, and v = 1,000, respectively. The corresponding R(v) estimates based on the JP1 overall model were 321.3, 38.47, and 4.256, respectively.
FIG. 7.
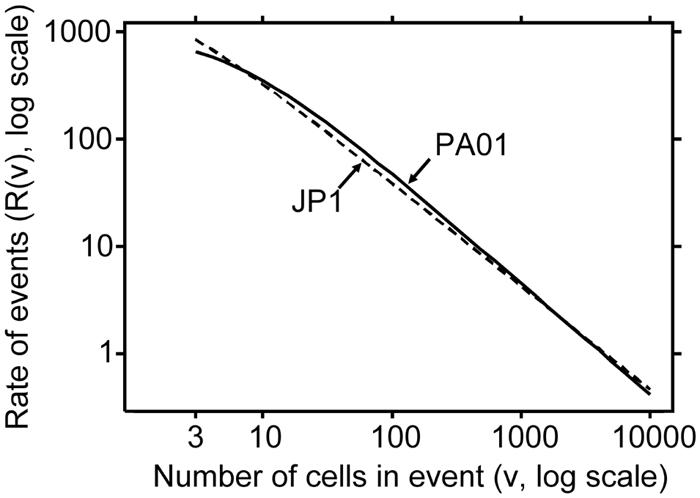
Estimated rate at which clumps of v or more cells detached from the biofilm (number of events per square millimeter per minute). The estimate was based on a fit of the Pareto probability distribution to the data. The rates for the two strains were not statistically significantly different at v = 10, v = 100, and v = 1,000 (P > 0.6).
DISCUSSION
This study of biofilm detachment events led to a model for predicting the rate at which a detachment event of a certain size may occur in a defined system. The PAO1 and JP1 strain biofilms expressed similar growth dynamics, as well as similar detached clump size distributions, indicating that the lasI-lasR cell signaling system did not play a significant role in growth, structure, or detachment. Similar observations for the role of cell signaling in biofilm development have been reported previously (12). The biofilms of both strains were relatively flat, and the thickness increased over time, reaching approximately 30 μm by day 7.
A large fraction of the bacteria released from a biofilm was attributable to multicell detachment events. In PAO1, the estimated rate of occurrence of events involving more than 1,000 cells was 4.524 events per mm2 of biofilm-covered surface per min, which is equivalent to 6,515 such large events per mm2 over a 24-h period.
In a previous study it was shown that detached clumps from S. aureus biofilms tolerated oxacillin exposure to an extent similar to the extent observed in attached biofilms (6). Cell survival was attributed to nutrient-limited induced dormancy of cells within the clumps. This general mechanism suggests that the reduced susceptibility of detached biofilm clumps is not species specific. In addition, detached biofilm clumps may be more infective than single cells. For example, animal studies of pulmonary injury due to Legionella pneumophila showed that challenge with single cells required 100 to 1,000 times more bacteria to induce the same detrimental effects as challenge with artificial biofilm clumps (20).
Although 20 to 40% of all detached cells were in clumps consisting of 300 or more cells, single cells represented the most frequent detachment size. Interestingly, this contrasts with S. aureus biofilms, in which clumps containing 11 to 100 cells were the most frequent (6). It is likely that biofilms formed from different species have different detachment patterns and consequently different modes of dissemination.
Many observed detachment events are required to provide statistically reliable estimates of the rates at which large detachment events occur. To obtain a sufficient number of events, we found that our method of filtering effluent samples and using image analysis to measure the size of each event was relatively time-consuming. In the future we hope to automate particle size measurements so that a larger number of particles can be observed in each sample.
The rate at which detached biofilm clumps occur is useful information for both risk assessment and the mathematical derivation of optimal management strategies for indwelling devices in medicine. The modeling and analysis strategies which we have developed to quantify biofilm detachment rates could be employed for such assessments. These methods can also be used to quantify the effects on detachment patterns due to either biological factors, such as genetic modifications, or environmental factors, such as nutrients and fluid shear.
Acknowledgments
This study was supported by National Institutes of Health grant RO1GM60052 and by the Industrial Associates of the Center for Biofilm Engineering.
REFERENCES
- 1.Allison, D. G., B. Ruiz, C. SanJose, A. Jaspe, and P. Gilbert. 1998. Extracellular products as mediators of the formation and detachment of Pseudomonas fluorescens biofilms. FEMS Microbiol. Lett. 167:179-184. [DOI] [PubMed] [Google Scholar]
- 2.Boos, D. 1982. Minimum Anderson-Darling estimation. Commun. Stat. Theory Methods 11:2747-2774. [Google Scholar]
- 3.Daly, D. 1997. Anderson-Darling regression with two examples from biofilm engineering. Ph.D. thesis. Statistics, Department of Mathematical Sciences, Montana State University, Bozeman. http://wwwlib.umi.com/cr/montana/fullcit?p9804841.
- 4.Davies, D. G., M. R. Parsek, J. P. Pearson, B. H. Iglewski, J. W. Costerton, and E. P. Greenberg. 1998. The involvement of cell-to-cell signals in the development of a bacterial biofilm. Science 280:295-298. [DOI] [PubMed] [Google Scholar]
- 5.Elkins, J. G., D. J. Hassett, P. S. Stewart, H. P. Schweizer, and T. R. McDermott. 1999. Protective role of catalase in Pseudomonas aeruginosa biofilm resistance to hydrogen peroxide. Appl. Environ. Microbiol. 65:4594-4600. [DOI] [PMC free article] [PubMed] [Google Scholar]
- 6.Fux, C. A., S. Wilson, and P. Stoodley. 2004. Detachment characteristics and oxacillin resistance of Staphylococcus aureus biofilm emboli in an in vitro catheter infection model. J. Bacteriol. 186:4486-4491. [DOI] [PMC free article] [PubMed] [Google Scholar]
- 7.Gabaix, X. 1999. Zipf's law for cities: an explanation. Q. J. Econ. 114:738-767. [Google Scholar]
- 8.Habibullah, M., and M. Ahsanullah. 2000. Estimation of parameters of a Pareto distribution by generalized order statistics. Commun. Stat. Theory Methods 29:1597-1609. [Google Scholar]
- 9.Holloway, B. W., V. Krishnapillai, and A. F. Morgan. 1979. Chromosomal genetics of Pseudomonas. Microbiol. Rev. 43:73-102. [DOI] [PMC free article] [PubMed] [Google Scholar]
- 10.Pareto, V. 1896. Cours d'economie politique.Droz, Geneva, Switzerland.
- 11.Pearson, J. P., E. C. Pesci, and B. H. Iglewski. 1997. Roles of Pseudomonas aeruginosa las and rhl quorum-sensing systems in control of elastase and rhamnolipid biosynthesis genes. J. Bacteriol. 179:5756-5767. [DOI] [PMC free article] [PubMed] [Google Scholar]
- 12.Purovdorj, B., J. W. Costerton, and P. Stoodley. 2002. Influence of hydrodynamics and cell signaling on the structure and behavior of Pseudomonas aeruginosa biofilms. Appl. Environ. Microbiol. 68:4457-4464. [DOI] [PMC free article] [PubMed] [Google Scholar]
- 13.Sawyer, L. K., and S. W. Hermanowicz. 1998. Detachment of biofilm bacteria due to variations in nutrient supply. Water Sci. Technol. 37:211-214. [Google Scholar]
- 14.Shah, C. B., M. W. Mittleman, J. W. Costerton, S. Parenteau, M. Pelak, R. Arsenault, and L. A. Mermel. 2002. Antimicrobial activity of a novel catheter lock solution. Antimicrob. Agents Chemother. 46:1674-1679. [DOI] [PMC free article] [PubMed] [Google Scholar]
- 15.Stoodley, P., L. Hall-Stoodley, and H. M. Lappin-Scott. 2001. Detachment, surface migration, and other dynamic behavior in bacterial biofilms revealed by digital time-lapse imaging. Methods Enzymol. 337:306-319. [DOI] [PubMed] [Google Scholar]
- 16.Stoodley, P., S. Wilson, L. Hall-Stoodley, J. D. Boyle, H. M. Lappin-Scott, and J. W. Costerton. 2001. Growth and detachment of cell clumps from mature mixed-species biofilms. Appl. Environ. Microbiol. 67:5608-5613. [DOI] [PMC free article] [PubMed] [Google Scholar]
- 17.van Loosdrecht, M. C. M., J. J. Heijnen, H. Eberl, J. Kreft, and C. Picioreanu. 2002. Mathematical modeling of biofilm structures. Antonie Leeuwehoek 81:245-256. [DOI] [PubMed] [Google Scholar]
- 18.Vidondo, B., Y. Prairie, J. Blanco, and C. Duarte. 1997. Some aspects of the analysis of size spectra in aquatic ecology. Limnol. Oceanogr. 42:184-192. [Google Scholar]
- 19.Walker, J. T., C. W. Mackerness, D. Mallon, T. Makin, T. Williets, and C. W. Keevil. 1995. Control of Legionella pneumophila in hospital water-system by chlorine dioxide. J. Ind. Microbiol. 15:384-390. [DOI] [PubMed] [Google Scholar]
- 20.Wright, J. B. 2000. Legionella biofilms: their implications, study and control, p. 291-310. In L. V. Evans (ed.), Biofilms: recent advances in their study and control, vol. 17. Harwood Academic Publishers, Amsterdam, The Netherlands. [Google Scholar]


