Abstract
Background:
Accumulating studies on computational fluid dynamics (CFD) support the involvement of hemodynamic factors in artery stenosis. Based on a patient-specific CFD model, the present study aimed to investigate the hemodynamic characteristics of transplant renal artery stenosis (TRAS) and its alteration after stent treatment.
Methods:
Computed tomography angiography (CTA) data of kidney transplant recipients in a single transplant center from April 2013 to November 2014 were reviewed. The three-dimensional geometry of transplant renal artery (TRA) was reconstructed from the qualified CTA images and categorized into three groups: the normal, stenotic, and stented groups. Hemodynamic parameters including pressure distribution, velocity, wall shear stress (WSS), and mass flow rate (MFR) were extracted. The data of hemodynamic parameters were expressed as median (interquartile range), and Mann–Whitney U-test was used for analysis.
Results:
Totally, 6 normal, 12 stenotic, and 6 stented TRAs were included in the analysis. TRAS presented nonuniform pressure distribution, adverse pressure gradient across stenosis throat, flow vortex, and a separation zone at downstream stenosis. Stenotic arteries had higher maximal velocity and maximal WSS (2.94 [2.14, 3.30] vs. 1.06 [0.89, 1.15] m/s, 256.5 [149.8, 349.4] vs. 41.7 [37.8, 45.3] Pa at end diastole, P = 0.001; 3.25 [2.67, 3.56] vs. 1.65 [1.18, 1.72] m/s, 281.3 [184.3, 364.7] vs. 65.8 [61.2, 71.9] Pa at peak systole, P = 0.001) and lower minimal WSS and MFRs (0.07 [0.03, 0.13] vs. 0.52 [0.45, 0.67] Pa, 1.5 [1.0, 3.0] vs. 11.0 [8.0, 11.3] g/s at end diastole, P = 0.001; 0.08 [0.03, 0.19] vs. 0.70 [0.60, 0.81] Pa, 2.0 [1.3, 3.3] vs. 16.5 [13.0, 20.3] g/s at peak systole, P = 0.001) as compared to normal arteries. Stent implantation ameliorated all the alterations of the above hemodynamic factors except low WSS.
Conclusions:
Hemodynamic factors were significantly changed in severe TRAS. Stent implantation can restore or ameliorate deleterious change of hemodynamic factors except low WSS at stent regions.
Keywords: Hemodynamics, Kidney Transplantation, Patient-specific Modeling, Renal Artery Obstruction
Introduction
Transplant renal artery stenosis (TRAS) is one of the posttransplant vascular complications, its incidence varies from 1% to 25%.[1,2] TRAS reduces blood supply of renal allograft and may eventually lead to graft dysfunction or even graft failure.
The pathogenesis of TRAS is not fully elucidated. Hemodynamics is reported to influence atherogenesis, vascular remodeling, neointimal hyperplasia, and endothelial healing.[3,4,5] Computational fluid dynamics (CFD) allows visual and accurate analysis of medical imaging data such as computed tomography angiography (CTA) and thus illustrates intrinsic hemodynamic mechanisms.[6,7,8,9,10,11] Although several CFD studies of native renal artery stenosis have been conducted, there are few studies about TRAS.[12,13] In addition, hemodynamics of transplant renal artery (TRA) might be quite different from that of native renal artery as TRA is anastomosed to iliac artery instead of abdominal aorta. Furthermore, most CFD studies use simplified models such as circular cross sections or semicircular sections,[14] yet only few introduce patient-specific model which can provide more realistic and sensitive hemodynamic data based on individual patient's artery geometries.[15,16]
Endovascular interventions including balloon angioplasty and stents are introduced to preserve renal graft function once severe TRAS is diagnosed.[17] Unfortunately, 10–50% of the treated TRAS occurred restenosis after endovascular interventions.[18,19] The intravascular hemodynamics change after stent treatment has not drawn much attention. Nevertheless, it has been shown that hemodynamic factors might contribute to restenosis after stent implantation in a vertebral artery stenosis model.[9] Herein, we demonstrated the hemodynamic characteristics of TRAS and its alteration after stent treatment using a patient-specific CFD model, with normal renal graft arteries as control.
Methods
Study patients
CTA data of kidney transplant recipients in Organ Transplant Center, The First Affiliated Hospital of Sun Yat-sen University (China), from April 2013 to November 2014, were reviewed. The inclusion criteria were: (1) normal, stenotic, or stented TRA diagnosed with CTA; (2) TRA anastomosed to external iliac artery in an end-to-side manner; and (3) the degree of artery stenosis over 70% (defined as severe TRAS). The exclusion criteria were: (1) TRA anastomosed to internal iliac artery in an end-to-end manner; (2) stenosis of artery anastomosis; and (3) insufficient three-dimensional (3D)-CTA imaging quality for CFD analysis. This study was approved by the Institutional Ethics Committee of The First Affiliated Hospital of Sun Yat-Sen University (No. [2016]084) and was in compliance with the provisions of the current Declaration of Helsinki principles. Patient consent was not required because the study did not involve human participants, specimens, or tissues and did not intervene the diagnosis and treatment.
Fifteen patients with severe TRAS confirmed by CTA and digital subtraction angiography were included in the study, and three of them were then excluded from the study due to anastomosis stenosis (n = 2) or insufficient CTA resolution (n = 1). All the rest 12 patients received stent implantation, yet only six of them received secondary CTA examination several months after stenting. No restenosis was found. Normal renal graft artery without stenosis was confirmed in six patients who received CTA examination due to other clinical consideration. Thus, CTA data of 6 normal (control group), 12 stenotic (TRAS group), and 6 stented TRAs (stent group) were obtained for CFD analysis.
Transplant renal artery and stent deployment modeling
All the 3D TRA geometries were obtained from CTA images. The commercial segmentation software Mimics 16.0 (Materialise Company, Leuven, Belgium) was used to transfer CTA images (DICOM format) into vessel-shaped 3D geometric data (STL format). Fast virtual stenting technique was used to simulate the process of stent implantation, which includes three steps: (1) isolation of parent vessel and creation of simplex mesh to fit the vessel best along its centerline using vessel-specific initialization; (2) expansion of simplex mesh to make the deployed simplex mesh a good apposition to the wall of the parent vessel; and (3) the stent mapped on the deployed simplex mesh and the wires swept into a 3D structure. Then, the deployed stent was incorporated into the specific geometry with ANSYS SpaceClaim software (ANSYS Company, Canonsburg, Pennsylvania, USA). ANSYS 16.0 software (ANSYS Company, Canonsburg, Pennsylvania, USA) was used to generate a computational grid consisting of approximately 0.03–0.07 million, 0.1–0.3 million, and 1.5–2.8 million tetrahedral elements in the merged normal, stenotic, and stented geometry, respectively. Steady-state CFD analysis was carried out with the finite volume code ANSYS Fluent to determine hemodynamics.
Computational fluid dynamics modeling
Blood was modeled as non-Newtonian fluid with a constant density of 1060 kg/m3 and shear-dependent dynamic viscosity according to the Carreau model.[20] The Reynolds number was between 497 and 1132 in the present study, so the blood was assumed to be laminar, incompressible, and could thus be modeled using the Navier–Stokes equations.[21] Patient-specific systolic peak and end-diastolic velocity of external iliac artery were determined as inflow velocity separately and no slip was prescribed at the stent surface and vessel wall. Zero pressure boundary conditions were prescribed at all outlets, and outflow rates were distributed proportionally according to their cross-sectional area.[22] Semi-Implicit Method for Pressure Linked Equations algorithm was used as the calculation method.[23] Second-order upwind was applied to improve the accuracy and stability of the calculation. The iterations were continued until the monitoring points of outlets did not change.
Statistical analysis
The continuous data were expressed as the median (Q1, Q3), and Mann–Whitney U-test was used for data analysis for the small sample size in this study. The categorical data were expressed as frequency and Fisher's exact test was used for comparison. A two-tailed P of 0.05 was considered to indicate a statistically significant difference. Statistical analysis was performed with the commercially available SPSS 17.0 software (SPSS Statistics for Windows, Version 17.0. Chicago, USA).
Results
Demographic characteristics of patients
The demographic data of these patients were summarized in Table 1. When comparing TRAS group to control group, all demographic data were not statistically different except time to CTA examination after kidney transplantation (4.0 [3.0, 6.5] vs. 8.5 [7.0, 13.0], P = 0.048) [Table 2].
Table 1.
Demographics of kidney transplant recipients enrolled in this study
| Patient number | Gender | Age (years) | Height (cm) | Body weight (kg) | AHA | Surgery | Donor type | IST | Diagnosis (months PT) | Stenosis (%) | CTA after stent |
|---|---|---|---|---|---|---|---|---|---|---|---|
| 1 | Male | 29 | 174 | 72 | Yes | Single | Deceased | FK + MMF + prednisone | 6 | 90 | Yes |
| 2 | Male | 35 | 166 | 52 | Yes | Single | Deceased | FK + MMF + prednisone | 4 | 90 | Yes |
| 3 | Female | 35 | 164 | 48 | Yes | Single | Deceased | FK + MMF + prednisone | 5 | 90 | Yes |
| 4 | Male | 50 | 170 | 58 | Yes | CPKT | Deceased | CsA + MMF + prednisone | 7 | 85 | Yes |
| 5 | Female | 31 | 163 | 54 | Yes | Single | Deceased | FK + MMF + prednisone | 11 | 70 | Yes |
| 6 | Male | 40 | 165 | 50 | Yes | Single | Deceased | FK + MMF + prednisone | 4 | 70 | Yes |
| 7 | Male | 35 | 176 | 75 | Yes | Single | Deceased | FK + MMF + prednisone | 2 | 84 | No |
| 8 | Male | 32 | 170 | 68 | Yes | Single | Deceased | CsA + MMF + prednisone | 3 | 80 | No |
| 9 | Male | 47 | 170 | 72 | Yes | Single | Deceased | CsA + MMF + prednisone | 3 | 80 | No |
| 10 | Male | 25 | 173 | 68 | Yes | Single | Living related | FK + MMF + prednisone | 1 | 75 | No |
| 11 | Female | 16 | 160 | 45 | Yes | Single | Living related | FK + MMF + prednisone | 9 | 70 | No |
| 12 | Male | 27 | 170 | 60 | Yes | Single | Deceased | FK + MMF + prednisone | 4 | 70 | No |
| 13 | Male | 29 | 174 | 72 | No | Single | Deceased | FK + MMF + prednisone | 3 | Control | – |
| 14 | Male | 42 | 172 | 80 | No | Single | Deceased | FK + MMF + prednisone | 24 | Control | – |
| 15 | Male | 38 | 170 | 56 | No | Autotransplant | Deceased | No | 7 | Control | – |
| 16 | Male | 39 | 172 | 62 | No | Single | Deceased | FK + MMF + prednisone | 13 | Control | – |
| 17 | Female | 36 | 168 | 53 | No | Single | Living related | CsA + EC−MPS + prednisone | 8 | Control | – |
| 18 | Male | 40 | 165 | 50 | No | Single | Deceased | FK + MMF + prednisone | 9 | Control | – |
AHA: Antihypertensive agent; CPKT: Combined pancreas–kidney transplantation; IST: Immunosuppressive therapy; FK: FK506; CsA: Cyclosporine A; MMF: Mycophenolate mofetil; EC–MPS: Enteric–coated mycophenolate sodium; PT: Posttransplant; CTA: Computed tomography angiography.
Table 2.
Comparison of demographics of kidney transplant recipients between TRAS group and control group
| Items | TRAS (n = 12) | Control (n = 6) | Statistics | P |
|---|---|---|---|---|
| Gender (male/female) | 9/3 | 5/1 | Fisher | 1.000 |
| Age (years) | 33.5 (28.0, 37.5) | 38.5 (36.0, 40.0) | −1.315* | 0.188 |
| Height (cm) | 170.0 (164.5, 171.5) | 171.0 (168.0, 172.0) | −0.758* | 0.448 |
| Weight (kg) | 59.0 (51.0, 70.0) | 59.0 (53.0, 72.0) | −0.423* | 0.672 |
| Donor type (deceased/living–related) | 10/2 | 5/1 | Fisher | 1.000 |
| Time to CTA examination (months PT) | 4.0 (3.0, 6.5) | 8.5 (7.0, 13.0) | −1.977* | 0.048 |
| CNI (FK/CsA/none) | 9/3/0 | 4/1/1 | Fisher | 0.492 |
| MPA (MMF/EC–MPS/none) | 12/0/0 | 4/1/1 | Fisher | 0.098 |
*Z values. PT: Posttransplant; CNI: Calcineurin inhibitor; CTA: Computed tomography angiography; MPA: Mycophenolic acid; MMF: Mycophenolate mofetil; EC–MPS: Enteric–coated mycophenolate sodium; FK: FK506; CsA: Cyclosporine A; TRAS: Transplant renal artery stenosis.
Pressure distribution in normal, stenotic, and stented transplant renal arteries
The pressure distribution of TRA is shown in Figure 1. Pressure was uniform in the normal and stented TRA but changed abruptly in the stenotic TRA. In the stenotic TRA, pressure reached to a high level ahead the stenosis, promptly decreased to the trough level at the stenosis throat, and then slightly increased at downstream stenosis leading to an adverse pressure gradient. Similar phenomena were observed at both diastole and systole phases.
Figure 1.
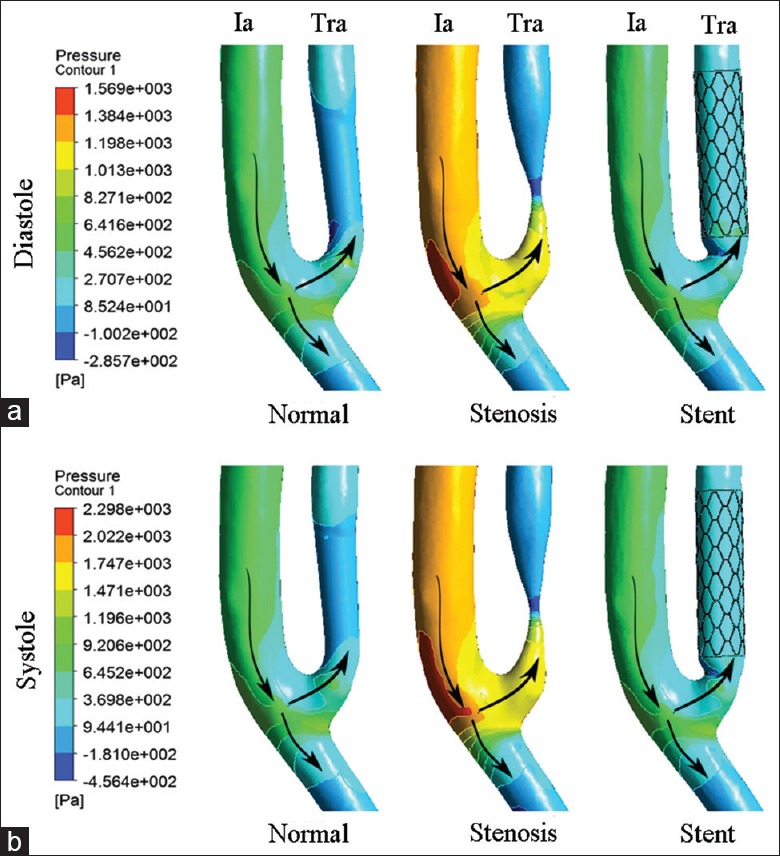
Pressure distribution of normal, stenotic, and stented transplant renal artery. (a) Contours of pressure at end diastole. (b) Contours of pressure at peak systole. Ia: Iliac artery; Tra: Transplant renal artery; Arrows: The direction of blood flow.
Velocity in normal, stenotic, and stented transplant renal arteries
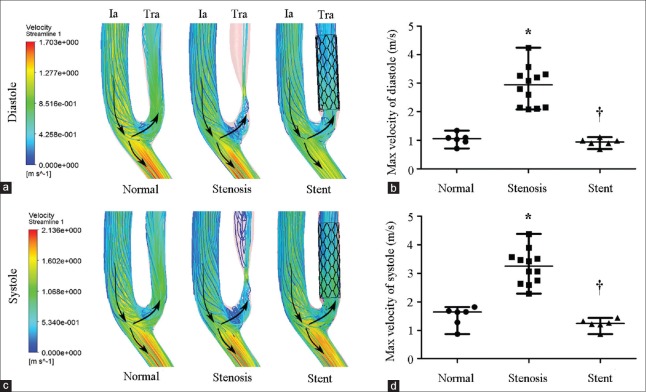
Velocity streamline of TRA is shown in Figure 2. The streamlines at the upstream of stenosis were no intersection indicating a laminar flow pattern. However, a mere elliptic-shaped vortex near the inner wall and a separation zone developed at downstream stenosis [Figure 2a and 2c]. The maximal velocity of stenotic TRA significantly increased as compared to normal TRA at both end diastole phase (2.94 [2.14, 3.30] m/s vs. 1.06 [0.89, 1.15] m/s, Z = −3.372, P = 0.001) and peak systole phase (3.25 [2.67, 3.56] m/s vs. 1.65 [1.18, 1.72] m/s, Z = −3.373 P = 0.001) [Figure 2b and 2d]. As expected, the vortex and separation zone were ameliorated when stent was implanted [Figure 2a and 2c], and the maximal velocity decreased to 0.94 (0.84, 1.02) (Z = −3.372, P = 0.001) at end diastole phase and 1.24 (1.12, 1.35) m/s (Z = −3.373, P = 0.001) at peak systole phase [Figure 2b and 2d].
Figure 2.
Velocity of normal, stenotic, and stented transplant renal artery. (a) Contours of velocity streamline at end diastole. (b) Maximal velocity of normal (n = 6), stenotic (n = 12), and stented (n = 6) transplant renal artery at end diastole. (c) Contours of velocity streamline at peak systole. (d) Maximal velocity of normal (n = 6), stenotic (n = 12), and stented (n = 6) transplant renal artery at peak systole. Ia: Iliac artery; Tra: Transplant renal artery; Arrows: The direction of blood flow. Results are the median. *P < 0.05 versus normal; †P < 0.05 versus stenosis.
Wall shear stress in normal, stenotic, and stented transplant renal arteries
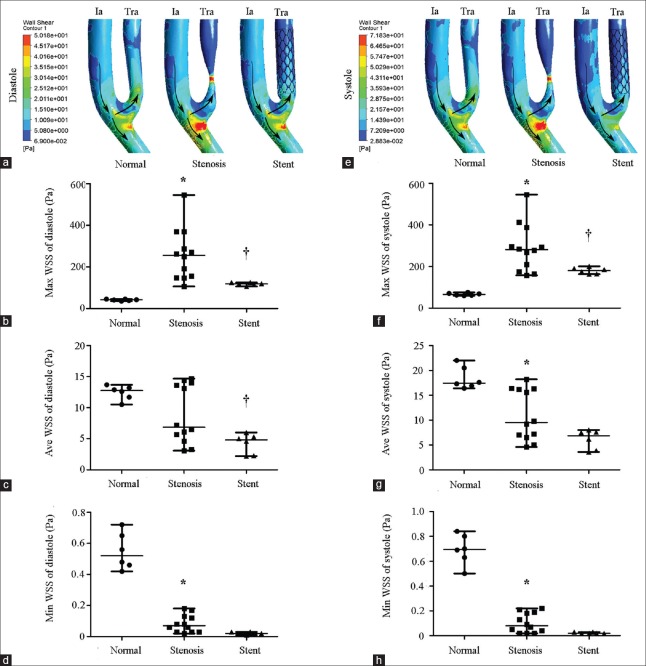
Wall shear stress (WSS) is a function of the velocity gradient of blood flow adjacent vascular endothelium, which is proportional to volume flow rate and inversely proportional to the cube of the lumen radius.[24] The formula is 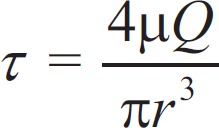 , where τ is the WSS, µ is the blood viscosity, and r is lumen radius. The WSS of TRA is shown in Figure 3. A remarkable high WSS was observed mainly at stenosis throat indicated as red zone, and a low WSS was indicated as blue zone at downstream stenosis [Figure 3a and 3e]. Compared to normal TRA, maximal WSS of stenotic TRA significantly increased at both end diastole phase (256.5 [149.8, 349.4] Pa vs. 41.7 [37.8, 45.3] Pa, Z = −3.372, P = 0.001) and peak systole phase (281.3 [184.3, 364.7] Pa vs. 65.8 (61.2, 71.9) Pa, Z = −3.372, P = 0.001) [Figure 3b and 3f]. Reversely, minimal WSS of stenotic TRA significantly decreased when compared to normal TRA at both end diastole phase (0.07 [0.03, 0.13] Pa vs. 0.52 [0.45, 0.67] Pa, Z = −3.382, P = 0.001) and peak systole phase (0.08 [0.03, 0.19] Pa vs. 0.70 [0.60, 0.81] Pa, Z = −2.952, P = 0.001) [Figure 3d and 3h]. The maximal WSS significantly decreased to 118.6 (113.2, 125.1) Pa (Z = −2.810, P = 0.001) at end diastole phase and 180.3 (163.9, 193.4) Pa (Z = −2.154, P = 0.001) at peak systole phase after stent implantation [Figure 3b and 3f].
Figure 3.
WSS of normal, stenotic, and stented transplant renal artery. (a) Contours of WSS at end diastole. (b) Maximal WSS of normal (n = 6), stenotic (n = 12), and stented (n = 6) transplant renal artery at end diastole. (c) Average WSS of normal (n = 6), stenotic (n = 12), and stented (n = 6) transplant renal artery at end diastole. (d) Minimal WSS of normal (n = 6), stenotic (n = 12), and stented (n = 6) transplant renal artery at end diastole. (e) Contours of WSS at peak systole. (f) Maximal WSS of normal (n = 6), stenotic (n = 12), and stented (n = 6) transplant renal artery at peak systole. (g) Average WSS of normal (n = 6), stenotic (n = 12), and stented (n = 6) transplant renal artery at peak systole. (h) Minimal WSS of normal (n = 6), stenotic (n = 12), and stented (n = 6) transplant renal artery at peak systole. WSS: Wall shear stress; Ia: Iliac artery; Tra: Transplant renal artery; Arrows: The direction of blood flow. Results are the median. *P < 0.05 versus normal; †P < 0.05 versus stenosis.
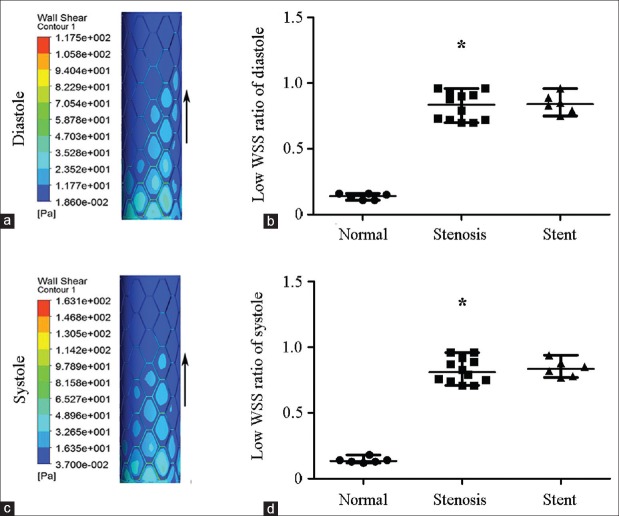
To accurately compare low WSS region in individual TRAs, the low-WSS region ratio (arealow WSS/areatotal) was introduced to neutralize the variation of vascular or stent area. Arealow WSS referred to dark blue zone and area total meant target vascular or stent area, as shown in Figure 4a and 4c. When compared to normal TRA, low-WSS region ratio significantly increased in stenotic TRA at end diastole phase (0.84 [0.72, 0.93] vs. 0.14 [0.11, 0.16], Z = −3.380, P = 0.001) or at peak systole phase (0.81 [0.74, 0.91] vs. 0.14 [0.13, 0.15], Z = −3.379, P = 0.001) [Figure 4b and 4d]. Notably, low-WSS region ratio did not decrease after stenting either at end diastole phase (0.84 [0.78, 0.91], Z = −0.423, P = 0.672) or at peak systole phase (0.84 [0.78, 0.90], Z = −0.469, P = 0.639) [Figure 4b and 4d].
Figure 4.
WSS distribution of the stented segment of transplant renal artery and low WSS ratio (area low WSS/area total) of normal, stenotic, and stented transplant renal artery. A large area of low WSS (dark blue zone) was clearly visible around the stent struts and high WSS (red zone) was just at the stent struts. (a) WSS distribution at end diastole. (b) Low WSS ratio (area low WSS/area total) at end diastole. (c) WSS distribution at peak systole. (d) Low WSS ratio at peak systole. WSS: Wall shear stress; Arrows: The direction of blood flow. Results are the median. *P < 0.05 versus normal.
Mass flow rate in normal, stenotic, and stented transplant renal arteries
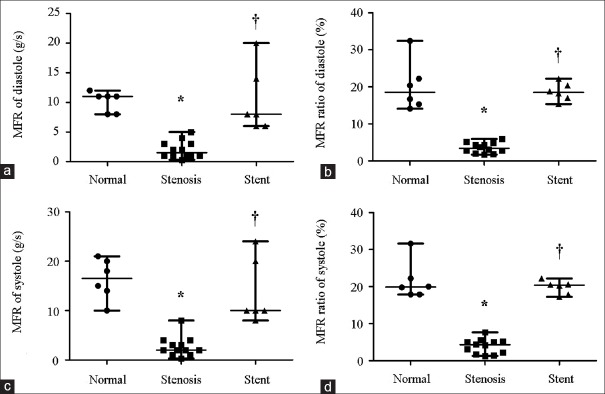
Mass flow rate (MFR) of TRA represents blood flow into renal grafts per unit time. The MFR of TRA is shown in Figure 5. Compared to normal TRA, MFR of stenotic TRA significantly decreased at either end diastole phase (1.5 [1.0, 3.0] g/s vs. 11.0 [8.0, 11.3] g/s, Z = −3.420, P = 0.001) or peak systole phase (2.0 [1.3, 3.3] g/s vs. 16.5 [13.0, 20.3] g/s, Z = −3.395, P = 0.001) [Figure 5a and 5c]. When stent was implanted, MFR increased to 8.0 (6.0, 15.5) g/s (Z = −3.414, P = 0.001) at end diastole and 10.0 (9.5, 21.0) g/s (Z = −3.356, P = 0.001) at peak systole [Figure 5a and 5c]. To accurately evaluate blood flow distribution in individual TRAs, MFR ratio (MFRoutlet/MFRinlet) was introduced to neutralize the variation of individuals. The proximal end of iliac artery was defined as the inlet, and the TRA and distal end of iliac artery were defined as the outlets in the present study. Hence, TRA MFR ratio could be expressed as MFRTRA/MFRinlet. When compared to normal TRA, TRA MFR ratio significantly decreased in stenotic TRA at end diastole phase (0.03 [0.02, 0.05] vs. 0.19 [0.15, 0.25], Z = −3.375, P = 0.001) or at peak systole phase (0.04 [0.02, 0.05] vs. 0.20 [0.18, 0.25], Z = −3.375, P = 0.001) [Figure 5b and 5d]. The TRA MFR ratio significantly increased to 0.19 (0.17, 0.21) (Z = −3.375, P = 0.001) at end diastole phase and 0.20 (0.18, 0.21) (Z = −3.373, P = 0.001) at peak systole phase after stent implantation [Figure 5b and 5d].
Figure 5.
MFR and MFR ratio in normal (n = 6), stenotic (n = 12), and stented (n = 5) transplant renal artery. (a) MFR of diastole. (b) MFR ratio (MFR TRA/MFR inlet) of diastole. (c) MFR of systole. (d) MFR ratio (MFR TRA/MFR inlet) of systole. MFR: Mass flow rate; TRA: Transplant renal artery. Results are the median. *P < 0.05 versus normal; †P < 0.05 versus stenosis.
Discussion
This study demonstrated the hemodynamic characteristics of TRAS and its alteration after stent treatment using a patient-specific CFD model. Maximal velocity increased by 2 times, maximal WSS increased by 4–6 times, and MFR decreased by 80% when comparing TRAS to normal TRA. Stent implantation restored or ameliorated the alterations of the above hemodynamic factors. Low-WSS region ratio significantly increased in TRAS by 8 times and remained unchanged after stent implantation.
As observed, pressure significantly dropped across stenosis throat and produced an adverse pressure gradient, which is prone to destabilize the blood flow. Meanwhile, retardation of flow velocity led to a separation of adjacent vessel blood from the inner mainstream, and thus caused the formation of downstream separation zone. The separation zone is considered to be harmful since it may prolong the resident time of blood at poststenosis area. A remarkable increased WSS at stenosis throat was observed. It is of note that the maximum WSS was approximately 412 Pa and 370 Pa at peak systole and end diastole phase, respectively, which is much higher than the published data in artery stenosis.[22,24] According to the formula of WSS, changes in lumen radius might result in significant changes of WSS. Hence, one possible explanation for our results is the significantly narrow lumen radius in the present study. The degree of all stenosis enrolled in this study was over 70% and even up to 90% in some TRAS.
Large low WSS area was observed at the downstream of stenosis in this study. The large low WSS area may accelerate stenosis progression or lead to secondary stenosis unless timely treatment is implemented. It is reported that distal region of stenotic artery is more prone to develop atherosclerosis.[25] Multiple stenosis usually occurred at the downstream of a diseased vascular bed due to low WSS area distal to the primary stenosis.[26] The possible mechanism is that low WSS can influence the development of neointimal hyperplasia and lead to stenosis by triggering inflammatory cell-mediated destructive remodeling.[27,28] MFR dramatically decreased in stenotic TRA, which is in accordance with the finding that MFR appeared with apparent reduction when stenosis degree was over 50%.[12]
It is not surprising to find that hemodynamics of TRAS was significantly improved by stent implantation in the aspects of uniform pressure distribution, ameliorated vortex and separation zone, corrected abnormal velocity, decreased maximal WSS, and increased MFR. However, it is of note that large low WSS area was found at stent region, and low-WSS region ratio remained unchanged after stent implantation. This is in accordance with findings from published studies on stented coronary and vertebral arteries.[9,29] The influence of stent on geometry of vessel wall has not been fully understood. Nevertheless, alteration in cross-sectional geometry after stent implantation exerts an important impact on WSS distributions, which may play roles in subsequent restenosis.[30] Low WSS is reported to be related to endothelial cell proliferation and formation of in-stent neointima.[31]
Our study has several limitations that deserve to mention. First, although CFD can provide clinically relevant hemodynamic information, more clinical studies and analyses should be carried out to prove the accuracy and validity. Second, the basis of CFD methodology is governed by the transient Navier–Stokes equations with the fluid assumed as an incompressible non-Newtonian, laminar fluid. The effect of artery compliance and blood flow waveform was not considered in the present study. The biological response of the vascular wall was not considered here, and merely hemodynamic effects were investigated.
In conclusion, our study revealed that the hemodynamics including pressure distribution, velocity, WSS, and MFR changed significantly when TRAS occurred by CFD based on a patient-specific model. Moreover, stent implantation may leave an intrinsic risk factor for restenosis of TRAS. Further studies are needed to determine its effect on clinical outcome.
Financial support and sponsorship
This study was supported by grants from the Science and Technology Planning Project of Guangdong Province (No. 2014B020212006), the Science and Technology Program of Guangzhou (No. 2014Y2-00114), and the Guangdong Provincial Key Laboratory on Organ Donation and Transplant Immunology (No. 2013A 061401007).
Conflicts of interest
There are no conflicts of interest.
Acknowledgment
We thank Dr. Dicken S. Ko from Massachusetts General Hospital of Harvard Medical School for his critical comments and polishing work on the manuscript.
Footnotes
Edited by: Yuan-Yuan Ji
References
- 1.Willicombe M, Sandhu B, Brookes P, Gedroyc W, Hakim N, Hamady M, et al. Postanastomotic transplant renal artery stenosis: Association with de novo class II donor-specific antibodies. Am J Transplant. 2014;14:133–43. doi: 10.1111/ajt.12531. doi: 10.1111/ajt.12531. [DOI] [PubMed] [Google Scholar]
- 2.Chen W, Kayler LK, Zand MS, Muttana R, Chernyak V, DeBoccardo GO. Transplant renal artery stenosis: Clinical manifestations, diagnosis and therapy. Clin Kidney J. 2015;8:71–8. doi: 10.1093/ckj/sfu132. doi: 10.1093/ckj/sfu132. [DOI] [PMC free article] [PubMed] [Google Scholar]
- 3.Franco D, Milde F, Klingauf M, Orsenigo F, Dejana E, Poulikakos D, et al. Accelerated endothelial wound healing on microstructured substrates under flow. Biomaterials. 2013;34:1488–97. doi: 10.1016/j.biomaterials.2012.10.007. doi: 10.1016/j.biomaterials.2012.10.007. [DOI] [PubMed] [Google Scholar]
- 4.Samady H, Eshtehardi P, McDaniel MC, Suo J, Dhawan SS, Maynard C, et al. Coronary artery wall shear stress is associated with progression and transformation of atherosclerotic plaque and arterial remodeling in patients with coronary artery disease. Circulation. 2011;124:779–88. doi: 10.1161/CIRCULATIONAHA.111.021824. doi: 10.1161/CIRCULATIONAHA.111.021824. [DOI] [PubMed] [Google Scholar]
- 5.Stone PH, Coskun AU, Kinlay S, Clark ME, Sonka M, Wahle A, et al. Effect of endothelial shear stress on the progression of coronary artery disease, vascular remodeling, and in-stent restenosis in humans In vivo 6-month follow-up study. Circulation. 2003;108:438–44. doi: 10.1161/01.CIR.0000080882.35274.AD. doi: 10.1161/01.CIR.0000080882.35274.AD. [DOI] [PubMed] [Google Scholar]
- 6.Tse KM, Chang R, Lee HP, Lim SP, Venkatesh SK, Ho P. A computational fluid dynamics study on geometrical influence of the aorta on haemodynamics. Eur J Cardiothorac Surg. 2013;43:829–38. doi: 10.1093/ejcts/ezs388. doi: 10.1093/ejcts/ezs388. [DOI] [PubMed] [Google Scholar]
- 7.Chaichana T, Sun Z, Jewkes J. Computational fluid dynamics analysis of the effect of plaques in the left coronary artery. Comput Math Methods Med 2012. 2012:504367. doi: 10.1155/2012/504367. doi: 10.1155/2012/504367. [DOI] [PMC free article] [PubMed] [Google Scholar]
- 8.Schneiders JJ, Marquering HA, Antiga L, van den Berg R, VanBavel E, Majoie CB. Intracranial aneurysm neck size overestimation with 3D rotational angiography: The impact on intra-aneurysmal hemodynamics simulated with computational fluid dynamics. AJNR Am J Neuroradiol. 2013;34:121–8. doi: 10.3174/ajnr.A3179. doi: 10.3174/ajnr.A3179. [DOI] [PMC free article] [PubMed] [Google Scholar]
- 9.Qiao A, Dai X, Niu J, Jiao L. Hemodynamics in stented vertebral artery ostial stenosis based on computational fluid dynamics simulations. Comput Methods Biomech Biomed Eng. 2016;19:1190–200. doi: 10.1080/10255842.2015.1123253. doi: 10.1080/10255842.2015.1123253. [DOI] [PubMed] [Google Scholar]
- 10.Piskin S, Serdar Celebi M. Analysis of the effects of different pulsatile inlet profiles on the hemodynamical properties of blood flow in patient specific carotid artery with stenosis. Comput Biol Med. 2013;43:717–28. doi: 10.1016/j.compbiomed.2013.02.014. doi: 10.1016/j.compbiomed.2013.02.014. [DOI] [PubMed] [Google Scholar]
- 11.Sinha Roy A, Back LH, Banerjee RK. Guidewire flow obstruction effect on pressure drop-flow relationship in moderate coronary artery stenosis. J Biomech. 2006;39:853–64. doi: 10.1016/j.jbiomech.2005.01.020. doi: 10.1016/j.jbiomech.2005.01.020. [DOI] [PubMed] [Google Scholar]
- 12.Zhang W, Qian Y, Lin J, Lv P, Karunanithi K, Zeng M. Hemodynamic analysis of renal artery stenosis using computational fluid dynamics technology based on unenhanced steady-state free precession magnetic resonance angiography: Preliminary results. Int J Cardiovasc Imaging. 2014;30:367–75. doi: 10.1007/s10554-013-0345-0. doi: 10.1007/s10554-013-0345-0. [DOI] [PubMed] [Google Scholar]
- 13.Kagadis GC, Skouras ED, Bourantas GC, Paraskeva CA, Katsanos K, Karnabatidis D, et al. Computational representation and hemodynamic characterization of in vivo acquired severe stenotic renal artery geometries using turbulence modeling. Med Eng Phys. 2008;30:647–60. doi: 10.1016/j.medengphy.2007.07.005. doi: 10.1016/j.medengphy.2007.07.005. [DOI] [PubMed] [Google Scholar]
- 14.Bit A, Chattopadhyay H. Numerical investigations of pulsatile flow in stenosed artery. Acta Bioeng Biomech. 2014;16:33–44. doi: 10.5277/ABB-00029-2014-05. [PubMed] [Google Scholar]
- 15.Wolters BJ, Rutten MC, Schurink GW, Kose U, de Hart J, van de Vosse FN. A patient-specific computational model of fluid-structure interaction in abdominal aortic aneurysms. Med Eng Phys. 2005;27:871–83. doi: 10.1016/j.medengphy.2005.06.008. doi: 10.1016/j.medengphy.2005.06.008. [DOI] [PubMed] [Google Scholar]
- 16.Piskin S, Serdar CM. Analysis of the effects of different pulsatile inlet profiles on the hemodynamical properties of blood flow in patient specific carotid artery with stenosis. Comput Biol Med. 2013;43:717–28. doi: 10.1016/j.compbiomed.2013.02.014. doi: 10.1016/j.compbiomed.2013.02.014. [DOI] [PubMed] [Google Scholar]
- 17.Ghirardo G, De Franceschi M, Vidal E, Vidoni A, Ramondo G, Benetti E, et al. Transplant renal artery stenosis in children: Risk factors and outcome after endovascular treatment. Pediatr Nephrol. 2014;29:461–7. doi: 10.1007/s00467-013-2681-7. doi: 10.1007/s00467-013-2681-7. [DOI] [PubMed] [Google Scholar]
- 18.Becker BN, Odorico JS, Becker YT, Leverson G, McDermott JC, Grist T, et al. Peripheral vascular disease and renal transplant artery stenosis: A reappraisal of transplant renovascular disease. Clin Transplant. 1999;13:349–55. doi: 10.1034/j.1399-0012.1999.130412.x. doi: 10.1034/j.1399-0012.1999.130412.x. [DOI] [PubMed] [Google Scholar]
- 19.Messerli FH, Bangalore S, Makani H, Rimoldi SF, Allemann Y, White CJ, et al. Flash pulmonary oedema and bilateral renal artery stenosis: The Pickering syndrome. Eur Heart J. 2011;32:2231–5. doi: 10.1093/eurheartj/ehr056. doi: 10.1093/eurheartj/ehr056. [DOI] [PubMed] [Google Scholar]
- 20.Chien S, Usami S, Taylor HM, Lundberg JL, Gregersen MI. Effects of hematocrit and plasma proteins on human blood rheology at low shear rates. J Appl Physiol. 1966;21:81–7. doi: 10.1152/jappl.1966.21.1.81. [DOI] [PubMed] [Google Scholar]
- 21.Doyle B, Caplice N. Plaque neovascularization and antiangiogenic therapy for atherosclerosis. J Am Coll Cardiol. 2007;49:2073–80. doi: 10.1016/j.jacc.2007.01.089. doi: 10.1016/j.jacc.2007.01.089. [DOI] [PubMed] [Google Scholar]
- 22.Rikhtegar F, Pacheco F, Wyss C, Stok KS, Ge H, Choo RJ, et al. Compound ex vivo and in silico method for hemodynamic analysis of stented arteries. PLoS One. 2013;8:e58147. doi: 10.1371/journal.pone.0058147. doi: 10.1371/journal.pone.0058147. [DOI] [PMC free article] [PubMed] [Google Scholar]
- 23.Chun MS. Electrokinetic secondary-flow behavior in a curved microchannel under dissimilar surface conditions. Phys Rev E Stat Nonlin Soft Matter Phys. 2011;83(3 Pt 2):036312. doi: 10.1103/PhysRevE.83.036312. doi: 10.1103/PhysRevE.83.036312. [DOI] [PubMed] [Google Scholar]
- 24.Dardik A, Chen L, Frattini J, Asada H, Aziz F, Kudo FA, et al. Differential effects of orbital and laminar shear stress on endothelial cells. J Vasc Surg. 2005;41:869–80. doi: 10.1016/j.jvs.2005.01.020. doi: 10.1016/j.jvs.2005.01.020. [DOI] [PubMed] [Google Scholar]
- 25.Li ZY, Tan FP, Soloperto G, Wood NB, Xu XY, Gillard JH. Flow pattern analysis in a highly stenotic patient-specific carotid bifurcation model using a turbulence model. Comput Methods Biomech Biomed Engin. 2015;18:1099–107. doi: 10.1080/10255842.2013.873033. doi: 10.1080/10255842.2013.873033. [DOI] [PubMed] [Google Scholar]
- 26.Filardi V. Carotid artery stenosis near a bifurcation investigated by fluid dynamic analyses. Neuroradiol J. 2013;26:439–53. doi: 10.1177/197140091302600409. doi: 10.1177/197140091302600409. [DOI] [PMC free article] [PubMed] [Google Scholar]
- 27.Moore JE, Jr, Xu C, Glagov S, Zarins CK, Ku DN. Fluid wall shear stress measurements in a model of the human abdominal aorta: Oscillatory behavior and relationship to atherosclerosis. Atherosclerosis. 1994;110:225–40. doi: 10.1016/0021-9150(94)90207-0. doi: 10.1016/0021-9150(94)90207-0. [DOI] [PubMed] [Google Scholar]
- 28.Malek AM, Alper SL, Izumo S. Hemodynamic shear stress and its role in atherosclerosis. JAMA. 1999;282:2035–42. doi: 10.1001/jama.282.21.2035. doi: 10.1001/jama. 282.21.2035. [DOI] [PubMed] [Google Scholar]
- 29.Rikhtegar F, Wyss C, Stok KS, Poulikakos D, Müller R, Kurtcuoglu V. Hemodynamics in coronary arteries with overlapping stents. J Biomech. 2014;47:505–11. doi: 10.1016/j.jbiomech.2013.10.048. doi: 10.1016/j.jbiomech.2013.10.048. [DOI] [PubMed] [Google Scholar]
- 30.Frauenfelder T, Boutsianis E, Schertler T, Husmann L, Leschka S, Poulikakos D, et al. In-vivo flow simulation in coronary arteries based on computed tomography datasets: Feasibility and initial results. Eur Radiol. 2007;17:1291–300. doi: 10.1007/s00330-006-0465-1. doi: 10.1007/s00330-006-0465-1. [DOI] [PubMed] [Google Scholar]
- 31.Wentzel JJ, Gijsen FJ, Stergiopulos N, Serruys PW, Slager CJ, Krams R. Shear stress, vascular remodeling and neointimal formation. J Biomech. 2003;36:681–8. doi: 10.1016/s0021-9290(02)00446-3. doi: 10.1016/s0021-9290(02)00446-3. [DOI] [PubMed] [Google Scholar]


