

Abstract
Background:
Chronic kidney disease (CKD) is an independent risk factor for cardiovascular disease (CVD). However, the association between CKD and CVD risk in patients with type 2 diabetes mellitus (T2DM) in China has not yet been well investigated. This study aimed to determine the association of CKD with the risks of coronary heart disease (CHD) and stroke in a Chinese population with T2DM.
Methods:
A total of 1401 inpatients with T2DM at the Second Affiliated Hospital of Zhejiang University School of Medicine between April 2008 and November 2013 were included in this study. The CKD-Epidemiology Collaboration equation for Asians was used to classify CKD. The UK Prospective Diabetes Study risk engine was used to estimate the risks of CHD and stroke.
Results:
CHD risk was significantly increased with CKD stage (20.1%, 24.8%, and 34.3% in T2DM patients with no CKD, CKD Stage 1–2, and Stage 3–5, respectively; P < 0.001 for all). The stroke risk was also increased with CKD stage (8.6%, 12.7%, and 25.4% in T2DM patients with no CKD, CKD Stage 1–2, and Stage 3–5, respectively; P < 0.001 for all). Compared with no-CKD group, the odds ratios (ORs) for high CHD risk were 1.7 (P < 0.001) in the CKD Stage 1–2 group and 3.5 (P < 0.001) in the CKD Stage 3–5 group. The corresponding ORs for high stroke risk were 1.9 (P < 0.001) and 8.2 (P < 0.001), respectively.
Conclusion:
In patients with T2DM, advanced CKD stage was associated with the increased risks of CHD and stroke.
Keywords: Chronic Kidney Disease, Coronary Disease, Stroke, Diabetes Mellitus
Introduction
Type 2 diabetes mellitus (T2DM) is associated with an increased risk of cardiovascular disease (CVD) mortality.[1] Approximately half of all deaths in T2DM patients are attributable to coronary heart disease (CHD), and 15% are caused by stroke.[2] In addition, the prevalence of diabetic kidney disease among adults with diabetes mellitus is reported to be 34.5%.[3] Annual assessments of urine albumin excretion and estimated glomerular filtration rate (eGFR) are recommended to detect and monitor kidney damage in patients with T2DM.[4] The classification of chronic kidney disease (CKD) is based on both eGFR and urine albumin excretion. In a randomized, controlled, multicenter trial (ADVANCE study), high albuminuria and low eGFR were proved to be independent risk factors for cardiovascular events among T2DM patients.[5] Moreover, in another prospective cohort study in the United States, CKD was confirmed to be associated with an increase in stroke risk.[6] However, the association of CKD with the risks of CHD and stroke in Chinese patients with T2DM has seldom been thoroughly investigated. To evaluate these two risks, we chose the UK Prospective Diabetes Study (UKPDS) risk engine, which is a T2DM-specific risk calculator from the UKPDS.[7] A cross-sectional study has shown that the UKPDS risk engine has good feasibility, convergent validity, and sensitivity in predicting CHD risk in Chinese diabetic patients.[8] The present study sought to determine whether CKD was correlated with the CHD and stroke risk scores computed using the UKPDS risk engine in T2DM patients from Zhejiang, China.
Methods
Subjects
A total of 1401 inpatients with T2DM (802 men and 599 women, aged 58.4 ± 12.9 years [21–94 years]) at the Second Affiliated Hospital of Zhejiang University School of Medicine between April 2008 and November 2013 were enrolled in this cross-sectional study. T2DM was diagnosed according to the WHO (1999) criteria.[9] Individuals with obvious symptoms were diagnosed with diabetes mellitus if one of the following was present: (1) fasting blood glucose (FBG) ≥7.0 mmol/L; (2) plasma glucose ≥11.1 mmol/L at 2 h after an oral glucose tolerance test; or (3) random plasma glucose ≥11.1 mmol/L. The diagnosis was confirmed on another day in patients with atypical symptoms. The duration of diabetes ranged from 0 to 36 years. The exclusion criteria included the following: Type 1 diabetes mellitus; gestational diabetes mellitus; specific types of diabetes attributable to other causes; urinary tract infections; Cushing disease; cancer; hematological diseases including multiple myeloma, leukemia and lymphoma; systemic lupus erythematosus; and the use of drugs those affect urine albumin-to-creatinine radio (UACR) and eGFR. This study was approved by the Ethics Committee of the Second Affiliated Hospital of Zhejiang University School of Medicine (Zhejiang, China). All participants provided informed consent.
Age, sex, smoking status, and duration of diabetes mellitus were recorded. Smoking status was divided into three categories: “current smoker” if the individual had regularly smoked in the past 1 year; “nonsmoker” if the individual had never regularly smoked; and “ex-smoker” if the individual had stopped smoking for at least 1 year.
Height, body weight, waist circumference, and blood pressure were recorded. Height and weight were measured in light indoor clothing and without shoes. Body mass index was calculated as the ratio of weight (kg) and height squared (m2). Waist circumference was measured at the umbilicus at the end of a normal expiration while standing. Diastolic and systolic blood pressures were measured with a standard sphygmomanometer after at least 5 min of supine rest after patients came to the in-patient department. Hypertension was defined as a systolic blood pressure ≥140 mmHg (1 mmHg = 0.133 kpa), diastolic blood pressure ≥90 mmHg, and/or the use of antihypertensive drugs.
Biochemical parameters
Venous blood samples were collected between 6:00 a.m. and 9:00 a.m. after overnight fasting. FBG, creatinine, total cholesterol, triglyceride, low-density lipoprotein cholesterol, and high-density lipoprotein cholesterol (HDL-C) were measured using the Beckman Coulter Chemistry Analyzer AU5400 series (Beckman Coulter Biomedical K.K, Tokyo, Japan). Glycosylated hemoglobin (HbA1c) was measured by high-performance liquid chromatography using Tosoh HLC-723G8 (Tosoh Corporation, Yamaguchi 746-0042, Japan). Screening for UACR was performed using a random, spot urine sample, and the results were expressed in milligrams per gram of creatinine. Urine albumin was measured by nephelometry immunoassay with the SIEMENS BN II System (Siemens Healthcare Diagnostics Products GmbH, 35041 Marburg, Germany).
Urine albumin-to-creatinine radio groups
According to the American Diabetic Association classification of microalbuminuria, patients were divided into three groups: normal albumin group, spot UACR <30 mg/g·Cr; microalbuminuria, spot UACR 30–299 mg/g·Cr; and macroalbuminuria, spot UACR ≥300 mg/g·Cr.[10]
Chronic kidney disease subgroups
GFR was calculated using the modified CKD-Epidemiology Collaboration (CKD-EPI) equation for Asians[11] as follows.
For males:
SCr ≤9 mg/L; eGFRCKD-EPI= 141 × (SCr/0.9)−0.411 × 0.993Age × 1.057
SCr >9 mg/L; eGFRCKD-EPI= 141 × (SCr/0.9)−1.209 × 0.993Age × 1.057
For females:
SCr ≤7 mg/L; eGFRCKD-EPI= 144 × (SCr/0.7)−0.329 × 0.993Age × 1.049
SCr >7 mg/L; eGFRCKD-EPI= 144 × (SCr/0.7)−1.209 × 0.993Age × 1.049
Where SCr = Serum creatinine.
The patients were classified into five CKD stages according to the 2002 Kidney Disease Outcomes Quality Initiative (KDOQI) guidelines:[12] Stage 1, kidney damage (indicated by albuminuria ≥30 mg/24 h or 20 mg/L, clinical proteinuria ≥300 mg/24 h or ≥200 mg/L, or a positive dipstick test for proteinuria) and eGFR ≥90 ml·min−1·1.73 m−2; Stage 2, kidney damage and eGFR 60–89 ml·min−1·1.73 m−2; Stage 3, eGFR 30–59 ml·min−1·1.73 m−2; Stage 4, eGFR 15–29 ml·min−1·1.73 m−2; and Stage 5, eGFR <15 ml·min−1·1.73 m−2.
UK Prospective Diabetes Study risk engine
The UKPDS risk engine version 2.0 for windows was used to evaluate CHD and stroke risks. This scale has been validated specifically for patients with diabetes[13] and provides an estimate of the risks for a new CHD event and stroke (fatal and nonfatal).[7] The data used to calculate the UKPDS risk scores (available at http://www.dtu.ox.ac.uk/riskengine/download.php) included HbA1c, systolic blood pressure, serum total cholesterol and HDL-C, atrial fibrillation, sex, age, ethnicity, smoking status, and diabetes duration. The risks of CHD, fatal CHD, stroke, and fatal stroke were estimated for 10 years.[7] CHD was defined as the occurrence of a fatal or nonfatal myocardial infarction or sudden death. In this study, cases with risk higher than 20% were classified into the high-risk group whereas those with a risk score lower than 20% were classified into the low-to-moderate risk group.
Statistical analysis
All statistical analyses were performed using SPSS 20.0 (IBM, USA) software. Continuous variables were expressed as mean ± standard deviation, median (25th–75th percentiles), or mean (95% confidence interval [CI]), and categorical variables were reported as percentages. Normally distributed continuous variables were compared using one-way analysis of variance and the least-significant difference test was used for comparisons between pairs of groups. The method of rank transform analysis was used for the data of abnormal distributions and comparisons between pairs of groups were analyzed with Scheffe post hoc comparison. Difference between groups were analyzed by the Chi-square test for unordered categorical variables and Fisher's exact test was used if cells had expected count <5. Binary logistic regression analysis was performed to obtain odds ratios (ORs) and their 95% CIs to predict the presence of high CHD and stroke risks. All statistical tests were two-tailed, and P < 0.05 was considered statistically siginficant.
Results
In this cohort of 1401 patients (802 men and 599 women) with T2DM, 60.9% patients had no CKD, 30.5% were in CKD Stages 1–2, which suggested mild renal dysfunction, and 8.6% were in Stages 3–5, which suggested moderate-to-severe renal dysfunction. Table 1 compares the clinical and metabolic parameters of patients according to the CKD stages as defined by the KDOQI classification. Patients at higher CKD stages were generally older, had diabetes for a longer duration, had higher systolic blood pressure, and had higher UACR.
Table 1.
Anthropometric and biochemical characteristics of patients with T2DM according to CKD stage
| Characteristics | No CKD (n = 853) | CKD Stages 1–2 (n = 428) | CKD Stages 3–5 (n = 120) | Statistics | P |
|---|---|---|---|---|---|
| Male, n (%) | 508 (59.6) | 225 (52.6) | 69 (57.5) | χ2 = 5.684 | 0.058 |
| Age (years) | 56.4 ± 12.5 | 59.8 ± 12.5* | 67.9 ± 12.0*,§ | F = 48.813 | 0.000 |
| Duration of DM (years) | 6.5 ± 6.2 | 9.2 ± 6.5* | 13.1 ± 7.7*,§ | F = 66.010 | 0.000 |
| Weight (kg) | 65.4 ± 12.9 | 63.8 ± 12.1† | 64.7 ± 10.9 | F = 2.186 | 0.113 |
| BMI (kg/m2) | 24.0 ± 3.6 | 24.0 ± 3.6 | 24.2 ± 3.1 | F = 0.272 | 0.762 |
| WC (cm) | 87.8 ± 10.3 | 87.7 ± 10.3 | 89.4 ± 9.6 | F = 1.270 | 0.281 |
| SBP (mmHg) | 132.0 ± 16.9 | 144.3 ± 21.5* | 148.5 ± 24.0* | F = 76.415 | 0.000 |
| DBP (mmHg) | 81.0 ± 10.5 | 83.0 ± 11.8† | 81.6 ± 12.7 | F = 4.016 | 0.018 |
| FPG (mmol/L) | 9.2 ± 3.7 | 9.8 ± 4.1* | 7.7 ± 3.3* | F = 14.816 | 0.000 |
| HbA1c (%) | 9.6 ± 2.4 | 9.8 ± 2.5 | 8.7 ± 2.3* | F = 10.915 | 0.000 |
| TC (mmol/L) | 4.5 (3.8–5.3) | 4.5 (3.8–5.4) | 4.4 (3.5–5.3) | F = 1.056 | 0.348 |
| TG (mmol/L) | 1.5 (1.1–2.1) | 1.6 (1.1–2.2) | 1.7 (1.3–2.4)* | F = 3.786 | 0.023 |
| HDL–C (mmol/L) | 1.2 (1.0–1.4) | 1.2 (1.0–1.5) | 1.1 (0.9–1.4)*,‡ | F = 4.334 | 0.013 |
| LDL–C (mmol/L) | 2.8 (2.2–3.5) | 2.8 (2.2–3.5) | 2.8 (2.1–3.7)*,§ | F = 0.052 | 0.949 |
| UACR (mg/g·Cr) | 8.9 (5.5–15.1) | 125.5 (51.5–508.1)* | 450.0 (67.2–2306.2)* | F = 1430.336 | 0.000 |
| Current smoker, n (%) | 221 (25.9) | 84 (19.6)† | 17 (14.2)† | χ2 = 12.118 | 0.002 |
| Ex–smoker, n (%) | 101 (11.8) | 63 (14.7) | 22 (18.3) | χ2 = 4.967 | 0.083 |
| AF, n (%) | 3 (0.4) | 5 (1.2) | 3 (2.5)† | χ2 = 7.027 | 0.023 |
| Hypertension, n (%) | 502 (58.9) | 323 (75.5)* | 106 (88.3)*,§ | χ2 = 76.939 | 0.000 |
*P<0.001; †P<0.05, compared to cases without CKD; ‡P<0.05; §P<0.001 compared to cases in CKD Stages 1–2. Data are expressed as mean ± SD, median (25th–75th percentiles) or percentages. CKD: Chronic kidney disease; DM: Diabetes mellitus; BMI: Body mass index; WC: Waist circumference; SBP: Systolic blood pressure; DBP: Diastolic blood pressure; FPG: Fasting plasma glucose; HbA1c: Glycosylated hemoglobin; TC: Total cholesterol; TG: Triglyceride; HDL–C: High-density lipoprotein cholesterol; LDL–C: Low-density lipoprotein cholesterol; UACR: Urine albumin–to–creatinine ratio; Cr: Creatinine; AF: Atrial fibrillation; SD: Standard deviation; T2DM: Type 2 diabetes mellitus.
Compared to those without CKD, patients in CKD Stages 1–2 and CKD Stages 3–5 had higher risks of CHD, fatal CHD, stroke, and fatal stroke, as calculated by the UKPDS risk engine [P < 0.001 for all; Table 2]. As the CKD stage deteriorated, the percentage of individuals with high CHD and stroke risks also increased. The ORs of CHD in patients in CKD Stages 1–2 and 3–5, compared with patients without CKD, were 1.7 (95% CI, 1.4–2.2) and 3.5 (95% CI, 2.3–5.3), respectively [P < 0.001 for both; Table 3]. Similarly, the ORs for high stroke risk in patients in CKD Stages 1–2 and 3–5 were 1.9 (95% CI, 1.4–2.7) and 8.2 (95% CI, 5.4–12.5), respectively [P < 0.001 for both; Table 3]. The percentage of individuals with high CHD and stroke risks was also increased in the patients with higher UACR [Table 3].
Table 2.
Risks of CHD and stroke among patients with T2DM according to CKD stage (%)
| Items | No CKD (n = 853) | CKD Stages 1–2 (n = 428) | CKD Stages 3–5 (n = 120) | F | P |
|---|---|---|---|---|---|
| CHD risk | 15.2 (9.6–25.3) | 20.1 (11.2–33.9)* | 28.5 (18.0–48.9)*,† | 40.946 | 0.000 |
| Fatal CHD risk | 5.1 (9.6–18.6) | 14.6 (7.0–27.9)* | 23.2 (12.8–42.7)*,† | 52.517 | 0.000 |
| Stroke risk | 4.5 (2.0–10.4) | 7.3 (3.0–16.4)* | 19.5 (8.6–34.7)*,† | 75.408 | 0.000 |
| Fatal stroke risk | 0.6 (0.3–1.5) | 1.2 (0.4–2.9)* | 3.1 (1.3–6.4)*,† | 87.225 | 0.000 |
*P<0.001 compared to cases no CKD; †P<0.001 compared to cases in CKD Stages 1–2. Data are expressed as median (25th–75th percentiles). CHD: Coronary heart disease; CKD: Chronic kidney disease; T2DM: Type 2 diabetes mellitus.
Table 3.
Presence and ORs of high risks of CHD and stroke according to CKD groups
| Stages | High CHD risk | High stroke risk | ||
|---|---|---|---|---|
| n (%) | OR (95% CI) | n (%) | OR (95% CI) | |
| No CKD (n = 853) | 317 (37.2) | – | 90 (10.6) | – |
| CKD Stages 1–2 (n = 428) | 216 (50.5) | 1.7 (1.4–2.2)* | 79 (18.5) | 1.9 (1.4–2.7)* |
| CKD Stages 3–5 (n = 120) | 81 (67.5) | 3.5 (2.3–5.3)* | 59 (49.2) | 8.2 (5.4–12.5)* |
*P<0.001 compared to cases no CKD. The 10-year CHD and stroke risks were estimated using the UK prospective diabetes study risk engine, and individuals were categorized as having low (<10%), intermediate (10–20%) or high (>20%) 10-year risk. ORs were calculated with binary logistic regression analysis. CHD: Coronary heart disease; CKD: Chronic kidney disease; OR: Odds ratio; CI: Confidence interval; UACR: Urine albumin–to–creatinine ratio; –: Not applicable.
As the UACR elevated, the percentage of individuals with a high risk of CHD and stroke also increased [Table 4]. Compared to patients with normal urinary albumin, the ORs of CHD in the microalbuminuria and macroalbuminuria groups were 1.8 (95% CI, 1.4–2.4) and 2.0 (95% CI, 1.4–2.7), respectively (P < 0.001 for both). In the case of stroke risk, the ORs for the above UACR groups were 2.4 (95% CI, 1.8–3.4) and 2.4 (95% CI, 1.6–3.5), respectively (P < 0.001 for both).
Table 4.
Presence and ORs of high risks of CHD and stroke according to UACR value
| Items | High CHD risk | High stroke risk | ||
|---|---|---|---|---|
| n (%) | OR (95% CI) | n (%) | OR (95% CI) | |
| Normal (n = 862) | 326 (37.8) | – | 99 (11.5) | – |
| Microalbuminuria (n = 337) | 178 (52.8) | 1.8 (1.4–2.4)* | 81 (24.0) | 2.4 (1.8–3.4)* |
| Macroalbuminuria (n = 202) | 110 (54.5) | 2.0 (1.4–2.7)* | 48 (23.8) | 2.4 (1.6–3.5)* |
*P<0.001 compared to cases with normal UACR. The 10-year CHD and stroke risks were estimated using the UK prospective diabetes study risk engine, and individuals were categorized as having low (<10%), intermediate (10–20%) or high (>20%) 10-year risk. ORs were calculated with binary logistic regression analysis. CHD: Coronary heart disease; UACR: Urine albumin–to–creatinine ratio; OR: Odds ratio; CI: Confidence interval; –: Not applicable.
Age is known to be one of the traditional risk factors of CHD.[7] As shown in Figures 1 and 2, both risks of CHD and stroke were increased gradually with age.
Figure 1.
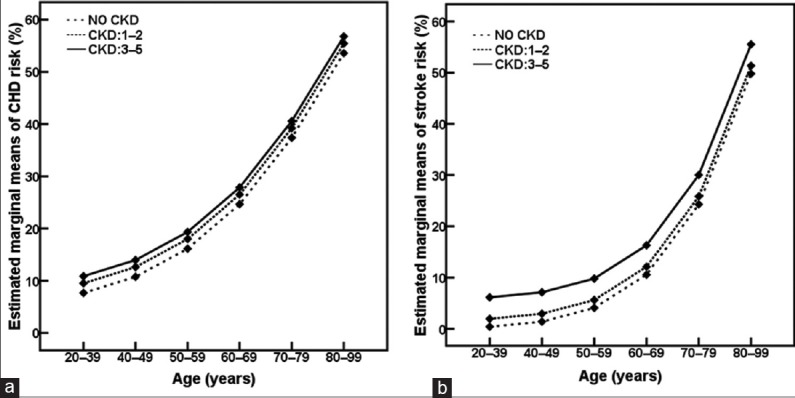
Age-related changes in risks of coronary heart disease (CHD, a) and stroke (b) according to chronic kidney disease (CKD) stage. P < 0.001 compared among age groups at the same CKD stage.
Figure 2.
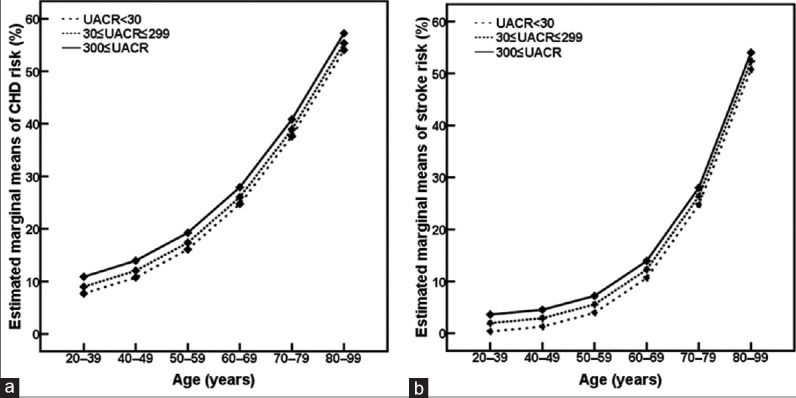
Age-related changes in risks of coronary heart disease (CHD, a) and stroke (b) according to urine albumin-to-creatinine ratio (UACR). P < 0.001 compared among age groups at the same UACR level.
Discussion
In this study, we examined the association of CKD with risks of CHD and stroke in Chinese patients with T2DM. Our results showed that patients in more advanced CKD stages were generally older, with longer diabetes duration, higher systolic blood pressure, and higher UACR. Furthermore, with development in the CKD stage, the percentage of patients with atrial fibrillation and hypertension also increased. We also noticed that as the CKD progressed, the percentage of current smokers decreased and the percentage of ex-smokers increased, that may be attributed to efforts to educate the patients to quit smoking. In terms of CVD risks, worsening CKD stage was associated with increasing risks of CHD and stroke.
Of the 1401 T2DM patients in this study, 8.6% had evidence of advanced CKD, defined as an eGFR <60 ml·min−1·1.73 m−2 (Stage 3 or higher). A national cross-sectional survey in China in 2012 showed that the prevalence of CKD (defined as an eGFR <60 ml·min−1·1.73 m−2 or the presence of albuminuria) was 10.8%, and that diabetes was the major cause of CKD.[14] The prevalence of advanced CKD in the present study is lower than that reported in a Hong Kong study, which found a prevalence of 15.8% of advanced CKD in T2DM patients[15] and that reported in western countries such as Norway (10.2%)[16] and the USA (17.7.0%),[3] but similar to the prevalence rate reported in the mainland of China.[17,18] Two studies in Chinese individuals with T2DM showed that the prevalence of advanced CKD was 6%[17] and 10.5% in hospitalized patients.[18] In our study, 30.5% of patients were in CKD Stages 1–2, and a total of 39.1% of our patients had renal impairment. UACR measurements showed that 14.4% of all patients had macroalbuminuria, and 24.1% had microalbuminuria. These rates are similar to those in a study in urban Chinese patients with T2DM, which reported that the frequency of CKD (eGFR <60 ml·min−1·1.73 m−2) and albuminuria (UACR ≥30 mg/g·Cr) was 31.0% and 28.9%.[19] A study in an Asian hypertensive population with T2DM showed that the prevalence of macro- and micro-albuminuria was 18.8% and 39.8%, respectively.[20] Differences in sample selection, study populations, and eGFR evaluation methods might account for the variation in the prevalence of CKD and albuminuria among different studies.
With aggravation of CKD, the risks of CHD and stroke, as calculated using the UKPDS risk engine, increased correspondingly. The mean CHD risks were 20.1%, 24.8%, and 34.3% among patients with no CKD, CKD Stage 1–2, and CKD Stage 3–5, while the corresponding stroke risks were 8.6%, 12.7%, and 25.4%, respectively. Similar results were obtained for the risks of fatal CHD and fatal stroke. Several comparable findings have been reported. Recently, a prospective cohort study in multi-ethnic Asian adults showed that decreased eGFR and increased albuminuria were independently associated with incident CVD. The ORs of CVD and all-cause mortality were 1.54 and 2.21, respectively, in patients with eGFRs of <45 versus ≥60 ml·min−1·1.73 m−2, and 2.81 and 2.34, respectively, in patients with UACRs of ≥300 versus <30 mg/g·Cr.[21] In an earlier study in the general population, a 2-fold increase in urine albumin concentration was found to be associated with a 1.29-fold increase in the risk for cardiovascular mortality.[22] It was reported that cardiovascular mortality was found to be two to three times higher in patients with Stage 3 or higher CKD than in individuals without renal dysfunction.[23,24] In addition, a prospective study in the Netherlands showed that there appears to be no threshold effect in the association of albuminuria with cardiovascular risk, unlike the nonlinear relationship between eGFR and cardiovascular risk.[25] In a population with diabetes, a prospective study in Australia showed that the multivariate-adjusted hazard ratio for cardiovascular events was 2.48 for every 10-fold increase in the baseline UACR, and 2.20 for every halving of baseline eGFR.[5] Moreover, patients with both UACR >300 mg/g·Cr and eGFR <60 ml·min−1·1.73 m−2 had an obviously higher risk of cardiovascular events compared with patients with normal GFR and UACR, but no evidence of an interaction between the effects of increased UACR and decreased eGFR was found.[5]
While the impact of CKD on CVD risk is less understood, data from epidemiological studies indicate that reduced eGFR and increased UACR are independent risk factors for stroke.[26] A cohort study in Taiwan (China) reported that beyond the traditional cardiovascular risk factors, CKD was a risk factor for stroke.[27]
Furthermore, we defined “high risk” as a CHD or stroke risk of above 20%. The ORs of high CHD risk were 1.7–3.5 times higher in patients with CKD than in patients with normal kidney function. Similarly, the ORs of high stroke risk were 1.9–8.8 times higher in patients with renal impairment than in those without renal impairment. As expected, increasing UACR was associated with a 1.8–2.0-fold increase in CHD risk. Moreover, the stroke risk was 2.4–2.4 times higher in patients with micro- or macro-albuminuria than in patients with normal urine albumin. It has been suggested that there exist racial differences in albuminuria, kidney function, and stroke risk. High UACR is independently associated with high stroke risk in black people, and reduced eGFR is more closely associated with the incident stroke risk in white people.[28,29] Furthermore, the Chronic Renal Insufficiency Cohort study recently reported that compared to eGFR, albuminuria is a better predictor of stroke risk in patients with CKD.[30]
Although the exact mechanism is not clear, hypertension, left ventricular hypertrophy, dyslipidemia, low-grade inflammation, increased activity of the renin – angiotensin system, sympathetic nervous system activity, and deficiency of active Vitamin D have been implicated as the mechanisms that mediate the relationship between CKD and CVD risks.[31] Furthermore, it has been confirmed that increased UACR and impaired eGFR are independently and additively associated with increased CHD risk.[32] Similar results have been found in studies on stroke risk.[31] In addition, a multicenter, observational, prospective cohort study in China indicates that renal insufficiency is an important independent predictor of cardiovascular outcome in patients with acute STEMI.[33]
There are some limitations to our study. In this study, we measured renal impairment through UACR and eGFR. Both these indexes have been used to evaluate the occurrence and development of renal dysfunction in patients with diabetes.[32,34,35] However, a retrospective analysis of biopsy data has indicated that approximately 8% of Chinese T2DM patients may have co-existing diabetic nephropathy and nondiabetic renal disease.[36] Such comorbidities may affect prognosis and treatment, and the evaluation of CHD and stroke risks. In general, diabetic nephropathy is diagnosed on the basis of the duration of diabetes, UACR, and eGFR rather than renal biopsy. As we excluded urinary tract infections, systemic lupus erythematosus, and hepatitis B virus-associated nephropathy, we considered our results would still be reliable. Second, this is a cross-sectional study, and a further prospective study is required to investigate the development and progression of nephropathy and its association with CVD events.
In conclusion, the present study showed that worsening CKD stage in patients with T2DM was associated with increases in risks of CHD and stroke. CHD and stroke risks were greater in T2DM patients with CKD than those without CKD. Similar results were found for UACR as patients with increased UACR were proven with a higher proportion of high risks of CHD and stroke. The assessments of CKD stages could be useful in identifying T2DM patients with high risks of CHD and stroke.
Financial support and sponsorship
This study was supported in part by the grants from the National Natural Science Foundation of China (No. 81370968, No. 81670744), the Chinese Society of Endocrinology (No. 13040620447), and the Science Technology Department of Zhejiang Province of China (No. 2012R10038).
Conflicts of interest
There are no conflicts of interest.
Footnotes
Edited by: Yuan-Yuan Ji
References
- 1.Glucose tolerance and mortality: Comparison of WHO and American Diabetes Association diagnostic criteria. The DECODE study group. European Diabetes Epidemiology Group. Diabetes Epidemiology: Collaborative analysis Of Diagnostic criteria in Europe. Lancet. 1999;354:617–21. doi: 10.1016/S0140-6736(98)12131-1. [PubMed] [Google Scholar]
- 2.Hu FB, Stampfer MJ, Haffner SM, Solomon CG, Willett WC, Manson JE. Elevated risk of cardiovascular disease prior to clinical diagnosis of type 2 diabetes. Diabetes Care. 2002;25:1129–34. doi: 10.2337/diacare.25.7.1129. doi: 10.2337/diacare.25.7.1129. [DOI] [PubMed] [Google Scholar]
- 3.de Boer IH, Rue TC, Hall YN, Heagerty PJ, Weiss NS, Himmelfarb J. Temporal trends in the prevalence of diabetic kidney disease in the United States. JAMA. 2011;305:2532–9. doi: 10.1001/jama.2011.861. doi: 10.1001/jama.2011.861. [DOI] [PMC free article] [PubMed] [Google Scholar]
- 4.Sarwar N, Gao P, Seshasai SR, Gobin R, Kaptoge S, et al. Emerging Risk Factors Collaboration. Diabetes mellitus, fasting blood glucose concentration, and risk of vascular disease: A collaborative meta-analysis of 102 prospective studies. Lancet. 2010;375:2215–22. doi: 10.1016/S0140-6736(10)60484-9. doi: 10.1016/S0140-6736(10)60484-9. [DOI] [PMC free article] [PubMed] [Google Scholar]
- 5.Ninomiya T, Perkovic V, de Galan BE, Zoungas S, Pillai A, Jardine M, et al. Albuminuria and kidney function independently predict cardiovascular and renal outcomes in diabetes. J Am Soc Nephrol. 2009;20:1813–21. doi: 10.1681/ASN.2008121270. doi: 10.1681/ASN.2008121270. [DOI] [PMC free article] [PubMed] [Google Scholar]
- 6.Abramson JL, Jurkovitz CT, Vaccarino V, Weintraub WS, McClellan W. Chronic kidney disease, anemia, and incident stroke in a middle-aged, community-based population: The ARIC study. Kidney Int. 2003;64:610–5. doi: 10.1046/j.1523-1755.2003.00109.x. doi: 10.1046/j.1523-1755.2003.00109.x. [DOI] [PubMed] [Google Scholar]
- 7.Stevens RJ, Kothari V, Adler AI, Stratton IM United Kingdom Prospective Diabetes Study (UKPDS) Group. The UKPDS risk engine: A model for the risk of coronary heart disease in Type II diabetes (UKPDS 56) Clin Sci (Lond) 2001;101:671–9. doi: 10.1042/cs1010671. [PubMed] [Google Scholar]
- 8.Jiao FF, Lam CL, Fung C, McGhee SM. Comparison of four cardiovascular risk prediction functions among Chinese patients with diabetes mellitus in the primary care setting. J Diabetes Investig. 2014;5:606–14. doi: 10.1111/jdi.12188. doi: 10.1111/jdi.12188. [DOI] [PMC free article] [PubMed] [Google Scholar]
- 9.American Diabetes A. Diagnosis and classification of diabetes mellitus. Diabetes care. 2010;33(Suppl 1):S62–69. doi: 10.2337/dc10-S062. doi: 10.2337/dc10-S062. [DOI] [PMC free article] [PubMed] [Google Scholar]
- 10.American Diabetes Association. (9) Microvascular complications and foot care. Diabetes care. 2015;38(Suppl):S58–66. doi: 10.2337/dc15-S012. doi: 10.2337/dc15-S012. [DOI] [PubMed] [Google Scholar]
- 11.Stevens LA, Claybon MA, Schmid CH, Chen J, Horio M, Imai E, et al. Evaluation of the chronic kidney disease epidemiology collaboration equation for estimating the glomerular filtration rate in multiple ethnicities. Kidney Int. 2011;79:555–62. doi: 10.1038/ki.2010.462. doi: 10.1038/ki.2010.462. [DOI] [PMC free article] [PubMed] [Google Scholar]
- 12.National Kidney Foundation. K/DOQI clinical practice guidelines for chronic kidney disease: Evaluation, classification, and stratification. Am J Kidney Dis. 2002;39(2 Suppl 1):S1–266. doi: 10.1634/theoncologist.2011-S2-45. [PubMed] [Google Scholar]
- 13.van Dieren S, Peelen LM, Nöthlings U, van der Schouw YT, Rutten GE, Spijkerman AM, et al. External validation of the UK Prospective Diabetes Study (UKPDS) risk engine in patients with type 2 diabetes. Diabetologia. 2011;54:264–70. doi: 10.1007/s00125-010-1960-0. doi: 10.1007/s00125-010-1960-0. [DOI] [PMC free article] [PubMed] [Google Scholar]
- 14.Zhang L, Wang F, Wang L, Wang W, Liu B, Liu J, et al. Prevalence of chronic kidney disease in China: A cross-sectional survey. Lancet. 2012;379:815–22. doi: 10.1016/S0140-6736(12)60033-6. doi: 10.1016/S0140-6736(12)60033-6. [DOI] [PubMed] [Google Scholar]
- 15.Kong AP, So WY, Szeto CC, Chan NN, Luk A, Ma RC, et al. Assessment of glomerular filtration rate in addition to albuminuria is important in managing type II diabetes. Kidney Int. 2006;69:383–7. doi: 10.1038/sj.ki.5000061. doi: 1038/sj.ki.5000061. [DOI] [PubMed] [Google Scholar]
- 16.Hallan SI, Coresh J, Astor BC, Asberg A, Powe NR, Romundstad S, et al. International comparison of the relationship of chronic kidney disease prevalence and ESRD risk. J Am Soc Nephrol. 2006;17:2275–84. doi: 10.1681/ASN.2005121273. doi: 10.1681/ASN.2005121273. [DOI] [PubMed] [Google Scholar]
- 17.Guo K, Zhang L, Zhao F, Lu J, Pan P, Yu H, et al. Prevalence of chronic kidney disease and associated factors in Chinese individuals with type 2 diabetes: Cross-sectional study. J Diabetes Complications. 2016;30:803–10. doi: 10.1016/j.jdiacomp.2016.03.020. doi: 10.1016/j.jdiacomp.2016.03.020. [DOI] [PubMed] [Google Scholar]
- 18.Li Q, Yang M, Bao YQ, Yu HY, Li M, Zhou J, et al. Use of modification of diet in renal disease equation in estimating renal insufficiency in type 2 diabetes patients (in Chinese) Natl Med J China. 2008;88:1966–9. doi: 10.3321/j.issn.0376-2491.2008.28.006. [PubMed] [Google Scholar]
- 19.Lou QL, Ouyang XJ, Gu LB, Mo YZ, Ma R, Nan J, et al. Chronic kidney disease and associated cardiovascular risk factors in chinese with type 2 diabetes. Diabetes Metab J. 2012;36:433–42. doi: 10.4093/dmj.2012.36.6.433. doi: 4093/dmj.2012.36.6.433. [DOI] [PMC free article] [PubMed] [Google Scholar]
- 20.Wu AY, Kong NC, de Leon FA, Pan CY, Tai TY, Yeung VT, et al. An alarmingly high prevalence of diabetic nephropathy in Asian type 2 diabetic patients: The MicroAlbuminuria Prevalence (MAP) Study. Diabetologia. 2005;48:17–26. doi: 10.1007/s00125-004-1599-9. doi: 10.1007/s00125-004-1599-9. [DOI] [PubMed] [Google Scholar]
- 21.Lim CC, Teo BW, Ong PG, Cheung CY, Lim SC, Chow KY, et al. Chronic kidney disease, cardiovascular disease and mortality: A prospective cohort study in a multi-ethnic Asian population. Eur J Prev Cardiol. 2015;22:1018–26. doi: 10.1177/2047487314536873. doi: 10.1177/2047487314536873. [DOI] [PubMed] [Google Scholar]
- 22.Hillege HL, Fidler V, Diercks GF, van Gilst WH, de Zeeuw D, van Veldhuisen DJ, et al. Urinary albumin excretion predicts cardiovascular and noncardiovascular mortality in general population. Circulation. 2002;106:1777–82. doi: 10.1161/01.cir.0000031732.78052.81. doi: 10.1161/01.CIR.0000031732.78052.81. [DOI] [PubMed] [Google Scholar]
- 23.Matsushita K, van der Velde M, Astor BC, Woodward M, Levey AS, et al. Chronic Kidney Disease Prognosis C. Association of estimated glomerular filtration rate and albuminuria with all-cause and cardiovascular mortality in general population cohorts: A collaborative meta-analysis. Lancet. 2010;375:2073–81. doi: 10.1016/S0140-6736(10)60674-5. doi: 10.1016/S0140-6736(10)60674-5. [DOI] [PMC free article] [PubMed] [Google Scholar]
- 24.van der Velde M, Matsushita K, Coresh J, Astor BC, Woodward M, Levey A, et al. Lower estimated glomerular filtration rate and higher albuminuria are associated with all-cause and cardiovascular mortality. A collaborative meta-analysis of high-risk population cohorts. Kidney Int. 2011;79:1341–52. doi: 10.1038/ki.2010.536. doi: 10.1038/ki.2010.536. [DOI] [PubMed] [Google Scholar]
- 25.Hillege HL, Fidler V, Diercks GF, van Gilst WH, de Zeeuw D, van Veldhuisen DJ, et al. Urinary albumin excretion predicts cardiovascular and noncardiovascular mortality in general population. Circulation. 2002;106:1777–82. doi: 10.1161/01.cir.0000031732.78052.81. doi: 10.1161/01.CIR.0000031732.78052.81. [DOI] [PubMed] [Google Scholar]
- 26.Ninomiya T. Risk of stroke in kidney disease. Contrib Nephrol. 2013;179:58–66. doi: 10.1159/000346724. doi: 10.1159/000346724. [DOI] [PubMed] [Google Scholar]
- 27.Chen YC, Su YC, Lee CC, Huang YS, Hwang SJ. Chronic kidney disease itself is a causal risk factor for stroke beyond traditional cardiovascular risk factors: A nationwide cohort study in Taiwan. PLoS One. 2012;7:e36332. doi: 10.1371/journal.pone.0036332. doi: 10.1371/journal.pone.0036332. [DOI] [PMC free article] [PubMed] [Google Scholar]
- 28.Gutiérrez OM, Judd SE, Muntner P, Rizk DV, McClellan WM, Safford MM, et al. Racial differences in albuminuria, kidney function, and risk of stroke. Neurology. 2012;79:1686–92. doi: 10.1212/WNL.0b013e31826e9af8. doi: 10.1212/WNL.0b013e31826e9af8. [DOI] [PMC free article] [PubMed] [Google Scholar]
- 29.Wang Y, Katzmarzyk PT, Horswell R, Zhao W, Johnson J, Hu G. Kidney function and the risk of cardiovascular disease in patients with type 2 diabetes. Kidney Int. 2014;85:1192–9. doi: 10.1038/ki.2013.396. doi: 10.1038/ki.2013.396. [DOI] [PMC free article] [PubMed] [Google Scholar]
- 30.Sandsmark DK, Messé SR, Zhang X, Roy J, Nessel L, Lee Hamm L, et al. Proteinuria, but Not eGFR, predicts stroke risk in chronic kidney disease: Chronic renal insufficiency cohort study. Stroke. 2015;46:2075–80. doi: 10.1161/STROKEAHA.115.009861. doi: 10.1161/STROKEAHA.115.009861. [DOI] [PMC free article] [PubMed] [Google Scholar]
- 31.Gansevoort RT, Correa-Rotter R, Hemmelgarn BR, Jafar TH, Heerspink HJ, Mann JF, et al. Chronic kidney disease and cardiovascular risk: Epidemiology, mechanisms, and prevention. Lancet. 2013;382:339–52. doi: 10.1016/S0140-6736(13)60595-4. doi: 10.1016/S0140-6736(13)60595-4. [DOI] [PubMed] [Google Scholar]
- 32.KDOQI. KDOQI clinical practice guidelines and clinical practice recommendations for diabetes and chronic kidney disease. Am J Kidney Dis. 2007;49(2 Suppl 2):S12–154. doi: 10.1053/j.ajkd.2006.12.005. doi: 10.1053/j.ajkd.2006.12.005. [DOI] [PubMed] [Google Scholar]
- 33.Li C, Hu D, Shi X, Li L, Yang J, Song L, et al. Amulticentre prospective evaluation of the impact of renal insufficiency on in-hospital and long-term mortality of patients with acute ST-elevation myocardial infarction. Chin Med J. 2015;128:1–6. doi: 10.4103/0366-6999.147330. doi: 10.4103/0366-6999.147330. [DOI] [PMC free article] [PubMed] [Google Scholar]
- 34.Levin A, Stevens PE, Bilous RW, Coresh J, De Francisco AL, De Jong PE, et al. Kidney disease: Improving global outcomes (KDIGO) CKD work group. KDIGO 2012 clinical practice guideline for the evaluation and management of chronic kidney disease. Kidney Int Suppl. 2013;3:1–150. doi: 10.1038/kisup.2012.73. [Google Scholar]
- 35.Dong HJ, Huang C, Luo DM, Ye JG, Yang JQ, Li G, et al. Decrease of glomerular filtration rate may be attributed to the microcirculation damage in renal artery stenosis. Chin Med J. 2015;128:750–4. doi: 10.4103/0366-6999.152483. doi: 10.4103/0366-6999.152483. [DOI] [PMC free article] [PubMed] [Google Scholar]
- 36.Zhuo L, Zou G, Li W, Lu J, Ren W. Prevalence of diabetic nephropathy complicating non-diabetic renal disease among Chinese patients with type 2 diabetes mellitus. Eur J Med Res. 2013;18:4. doi: 10.1186/2047-783X-18-4. doi: 10.1186/2047-783X-18-4. [DOI] [PMC free article] [PubMed] [Google Scholar]