

Abstract
A patient with relapsing multiple sclerosis (RMS) was treated with a standard immunomodulatory therapy, but due to ongoing disease activity was switched to rituximab. Relapses ceased, but secondary progressive MS (SPMS) eventually appeared, associated with new focal spinal cord white matter lesions. Cerebrospinal fluid (CSF) showed persistent oligoclonal bands (OCB) and clonally related B cells in CSF and peripheral blood. The treatment escalation approach failed to prevent evolution to SPMS, raising the question of whether initiation of B‐cell depleting therapy at the time of RMS diagnosis should be tested to more effectively address the immune pathology leading to SPMS.
Introduction
We report the clinical findings of a patient enrolled in EPIC,1 a prospective longitudinal deeply phenotyped multiple sclerosis (MS) cohort study, who developed secondary progressive MS (SPMS) despite ongoing treatment with highly efficacious anti‐CD20 therapy. The availability of standardized, highly curated, clinical, magnetic resonance imaging (MRI), and immunologic data during this period permitted us to assess in a detailed fashion his transition from relapsing‐remitting MS (RMS) to SPMS.
Case Report
Clinical description (Fig 1)
Figure 1.
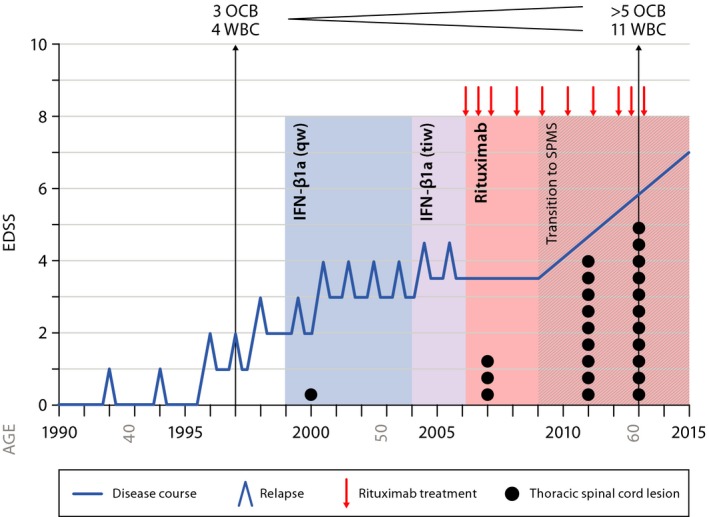
Disease course. Shown is a summary of the patient's disease course with relapses and disability progression represented by the blue line. CSF findings in 1997 and 2013 are shown at the top of the graph; thoracic spinal cord lesion count represented by the black dots; rituximab treatment cycles are indicated by the red arrows. Weekly IFN‐ß1a was given from 1999 to 2004; three‐times weekly IFN‐ß1a was given from 2004 to 2006, followed by treatment with rituximab. Secondary progression without relapses became apparent starting 2009.
The patient is a 63‐year‐old man with long‐standing MS. His initial symptom at age 39 (1992) consisted of a partial myelopathy with left‐sided sensory symptoms that resolved completely over months; brain MRI was initially normal. At age 41 (1994), he developed horizontal diplopia, and 3 years later (1997), partial cervical myelitis. Brain MRI now revealed nine supratentorial periventricular and subcortical T2 hyperintense nonenhancing lesions; cervical MRI identified three focal nonexpansile T2‐bright lesions at C2 and C4, two of which enhanced following administration of gadolinium; and cerebrospinal fluid (CSF) revealed four mononuclear cells, three oligoclonal bands (OCB), and an increased IgG index. He then experienced two further attacks over the next 3 years, including another episode of myelopathy, and now had persistent sensory and motor complaints in the left leg without objective motor weakness, as well as bladder urgency; his expanded disability status scale (EDSS) was 2.0. At age 47 (1999), disease‐modifying therapy was instituted with weekly IFN‐β1a (Avonex) and 5 years later (2004) changed to three times weekly (Rebif); he was fully compliant with his medication regimen but continued to experience disease activity characterized by seven additional relapses during this 7 year period, ongoing focal inflammatory disease activity demonstrated by MRI, and incomplete recovery from several attacks. His EDSS was now 3.5 (2006).
He began off‐label treatment with rituximab in 2006. At the time he was 53 years old, he had full muscle strength, slowed toe tapping on the right, pyramidal signs worse on the right, and an EDSS of 3.5. He could bike several miles without difficulty but was no longer able to jog. He received 10 rituximab courses; the first three spaced 6 months apart, four subsequent doses administered annually, and the most recent three doses again spaced at 6‐month intervals. He has had no further relapses since starting rituximab.
However, in 2009, 3 years after beginning rituximab, a very mild right leg weakness (5‐/5 proximally) first became evident and painful dysesthesias, bladder incontinence, constipation, and sexual complaints had now worsened. The monoparesis became progressive and over time weakness was also evident in the left leg. He began to use a cane in 2012, crutches in early 2013, and purchased a scooter for work in 2015 when his EDSS worsened to 7.0.
MRI findings
In 2013, brain MRI scans showed multiple T2/supratentorial fluid attenuated inversion recovery (FLAIR) hyperintense lesions with a predominantly periventricular distribution pattern typical of MS (Supplementary Figure 1A). Prior to starting rituximab in 2006, an increasing lesion count was seen and a nearly stable lesion count thereafter (Fig. 2A), with one new subpial cerebellar lesion first noted in 2013 (Supplementary Figure 1B and C). Serial imaging revealed multilevel cervical and thoracic spinal cord disease and interval progression of a possibly symptomatic right lateral C6 lesion with myelomalacia involving the corticospinal tract (Supplementary Figure 1D and E), plus development of several new thoracic cord lesions (Supplementary Figure 1D, F and 2C, D). Furthermore, brain and cervical cord atrophy rates indicated increased tissue volume loss compared to rates in normal aging, despite treatment with rituximab (Fig 2B, E and F).2, 3 We searched for cerebral meningeal infiltrates in this patient, but no definite enhancement could be detected on post‐gadolinium T2‐weighted FLAIR images (not shown).
Figure 2.
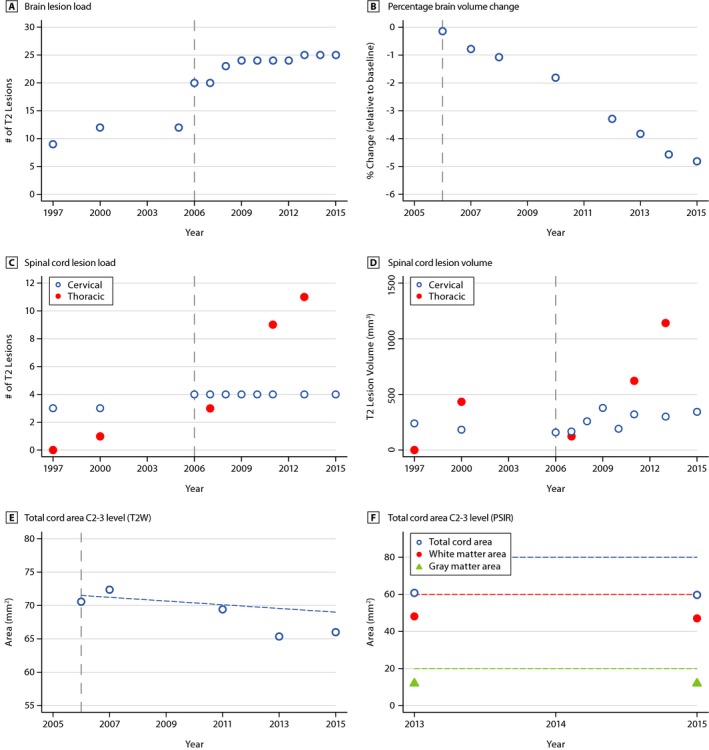
Longitudinal MRI examinations reveal increase in lesion load and lesion volume and decrease in parenchymal volume. Shown are brain lesion load (# of T2 lesions, (A), and percentage brain volume change (% relative to baseline, (B); cervical, thoracic spinal cord T2 lesion load (# of T2 lesions, C), volume (mm3, D) and cervical cord area longitudinally (mm2, T2W contrast, E) and cross‐sectionally for total cord area, white matter area and gray matter area, each at C2‐3 level (PSIR, mm2, (F). Plots (open circles; closed circles; triangles) in the graphs represent the respective time point of detection of the illustrated findings by MRI. The gray vertical dashed line indicates the start of rituximab therapy. The horizontal dashed line in panel E indicates the atrophy rate for normal aging. The dashed lines in panel F indicate lower level of normal. In general, CSP lesion load remains stable, while CSP lesion volume and TSP lesion load and volume increase over time. A temporary increase of TSP lesion volume in 2000 was due to a relapse with transverse myelitis at level T1/2 (see Fig. S1D), followed by clinical remission and a reduced lesion volume. Prior to starting rituximab treatment, a doubling of brain lesions occurred between 1997 and 2006. Only a slight increase in brain lesion number was observed after starting rituximab. MRI, magnetic resonance imaging; T2W, T2‐weighted; PSIR, phase‐sensitive inversion recovery MRI sequence; CSP, cervical spinal cord; TSP, thoracic spinal cord.
Cerebrospinal fluid and peripheral blood
Cerebrospinal fluid analysis in 2013 revealed >5 OCB, compared to 3 OCB in 1997; the IgG index had been elevated at 0.83 in 1997, and was normal at 0.6 in 2013. Interestingly, the CSF white blood cell (WBC) count was normal with four WBC in 1997 but elevated with 11 WBC in 2013. Flow cytometry of CSF lymphocytes in 2013 revealed a virtual absence of CD19+ B cells (0.019%). Almost 90% of CSF lymphocytes were T cells, 6.3% were CD3+CD8+, and >90% were CD3+CD8‐ (e.g., CD4+) T cells. As expected, B cells were almost entirely depleted from peripheral blood at all studied time points, whereas T cells were present at normal levels.
We were interested in determining if clonally related B cells could be detected in CSF and peripheral blood, despite being virtually undetectable by flow cytometry. Indeed, by applying immune repertoire sequencing, we found evidence for a small number of intrathecal B cells with clonally related counterparts in the periphery that persisted over time (Fig 3). The fact that we could identify their clonal signature in samples that were obtained 1 year apart indicates that these belong to long‐lived memory B cells or plasma cell populations that evaded anti‐CD20 targeted depletion, and might support immune mechanisms responsible for enlarging spinal cord lesions and progressive neurological disability in this patient.
Figure 3.
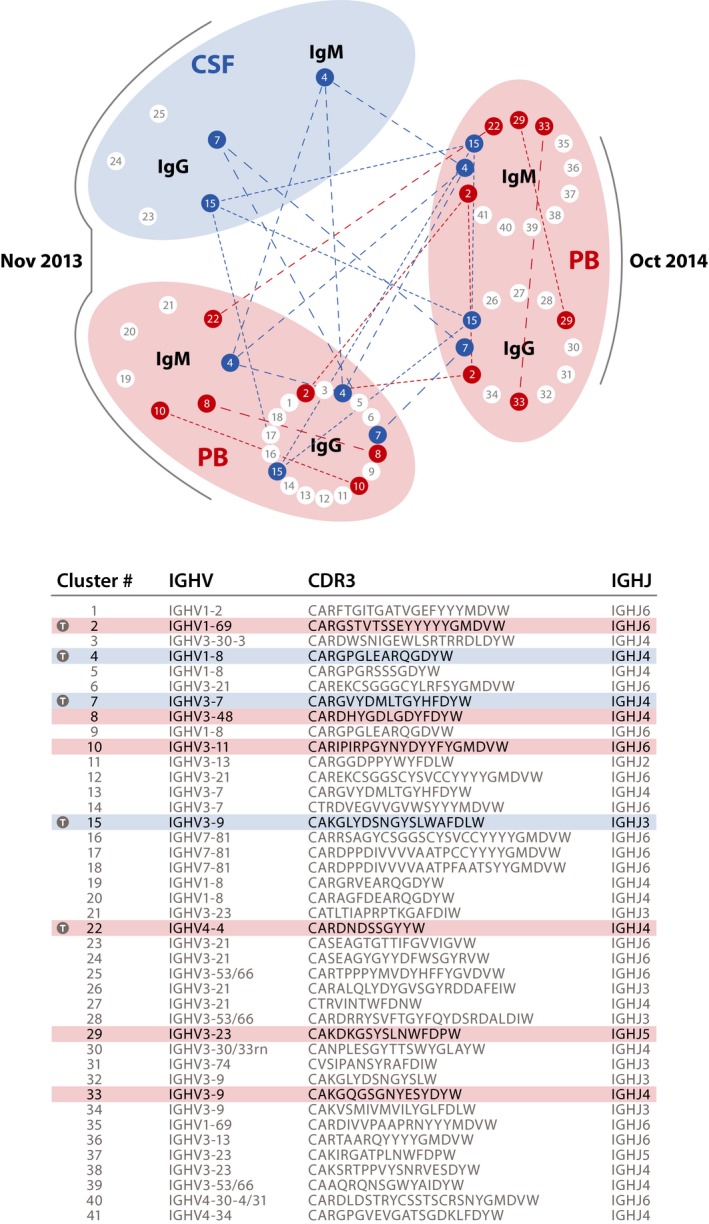
Clonally related B‐cell receptors (BCR) in PB (2013, 2014) and CSF (2013) indicate temporal persistence of B cells in blood and CSF. In MS patients not treated with anti‐CD20 therapies, hundreds of different clusters of clonally related B‐cell receptor/immunoglobulin heavy chain variable region (Ig‐VH) transcripts are normally found in peripheral blood. In this long‐term B cell depleted patient, only very few BCR IgM‐ or IgG‐heavy VH sequences were found in PB or CSF; no IgM/G‐VH could be amplified from the November 2011 PB sample. In this figure, each dot (node) represents a group (cluster) of clonally related Ig‐VH transcripts (clusters 1–41); germline immunoglobulin IGHV/IGHJ usage and most common CDR3 per cluster of related B cells are shown in the table. Blue nodes indicate IgM‐VH or IgG‐VH sequences belonging to B cells that were present in CSF in November 2013 and/or also present in PB in November 2013 or October 2014; red nodes indicate BCRs found in PB at either time point. Blue lines in the graph or shades in the table indicate related B cells found in CSF and PB at both time points; red lines in the graph or shades in the table indicate related B cells in PB only, present at either/both time points; time (T/gray circle) markers in table indicate B cells present across both time points. Overall, Ig‐VH obtained from peripheral blood or CSF by polymerase chain reaction suggests persistence of recirculating memory B cells, or long‐lived plasma cells, unaffected by rituximab despite long‐term anti‐CD20 treatment. CSF, cerebrospinal fluid; PB, peripheral blood; IgG, immunoglobulin G; IgM, immunoglobulin M; IGHV, immunoglobulin heavy chain variable; IGHJ, immunoglobulin heavy chain joining; CDR3, complementarity determining region three.
Discussion
A number of points of emphasis are highlighted in this case report. First, a secondarily progressive course developed during chronic B‐cell depletion therapy with rituximab, an agent that appeared to have been effective in this patient during the relapsing phase of MS. Second, CSF analysis by flow cytometry demonstrated that levels of B cells were extremely low in the intrathecal compartment, an observation in agreement with earlier reports indicating that rituximab therapy can successfully deplete B cells from the CNS.4 Third, despite B‐cell depletion, there was evidence for ongoing CNS inflammation: (1) OCB were present in CSF even after nearly 7 years of anti‐CD20 therapy, indicating active robust intrathecal antibody synthesis, most likely by long‐lived, CNS resident, plasma cells; (2) Clonally related B‐cell populations were detected on both sides of the blood–brain barrier, where they might contribute to ongoing CNS damage; (3) There was persistent CSF pleocytosis, comprised predominantly of T cells; (4) Serial MRI examination revealed a stable white matter lesion burden in the cerebral hemispheres but formation of a new infratentorial and new and/or enlarging spinal cord lesions despite therapy with rituximab.
An increase in the size of a cervical cord lesion and the development of multiple new thoracic spinal cord lesions despite rituximab therapy represented the most likely imaging correlate of the progressive neurological deficit. Notably, nearly complete stabilization of brain white matter lesion burden by anti‐CD20 therapy was repeatedly shown on MRI and sustained for nearly a decade.5, 6, 7 As expected for a patient with chronic MS, progressive atrophy of total brain and spinal cord volume were also present. These observations are consistent with converging evidence that increasing cortical pathology underlies progressive MS and that these changes are largely independent of underlying white matter lesions but rather might be associated with adjacent overlying meningeal lymphoid aggregates containing B cells and plasma cells.8, 9, 10, 11, 12, 13 Could the development of SPMS been the consequence of ectopic lymphoid aggregates in the meninges that are resistant to anti‐CD20 therapy? In contrast to the cerebral hemispheres, the major white matter tracts in the spinal cord are located in a superficial location adjacent to the meninges where they might be susceptible to damage from effects of cytokines, free radicals, or autoantibodies. This anatomic feature raises the question of whether chronic meningeal inflammation might promote neocortical neurodegeneration in the underlying cerebral hemispheres, and demyelination in adjacent spinal cord white matter tracts.
The presence of CSF OCB and ongoing CSF pleocytosis at least indirectly support the persistence of inflammatory sites with a physical connection to the CSF. While the challenge of removing OCB‐producing long‐lived plasma cells from the CNS remains, we propose that in the light of new data the value of serial measurement of OCB deserves re‐examination. As a surrogate for meningeal aggregates and ongoing humoral immunity within the CNS, OCB could represent a useful endpoint for clinical trials, particularly in progressive MS.
In this patient, therapy with IFN‐β1a was started 2 years after the diagnosis of MS was first established. Escalation to rituximab ensued 7 years later and was highly effective in suppressing relapsing disease activity; however, it did not prevent secondary progression. The underlying pathological process resulting in secondary progressive MS was not arrested by rituximab. Lack of efficacy could be due to failure of rituximab to halt CNS inflammation as outlined above. Alternately, noninflammatory processes that had started prior to initiation of this therapy could drive secondary progression. Although the patient continued to have relapses prior to rituximab initiation, he had accumulated clinically significant impairments (EDSS = 3.5) and manifested right pyramidal signs that would later progressively evolve. Would the course have been different had rituximab been initiated at clinical onset or used in a more intensive fashion? There is evidence that the risk of SPMS has decreased but is not eradicated in the treatment era,14, 15, 16 and it is possible, but unproven, that more aggressive “induction” therapy using highly effective agents early in the disease course might further lower the progression risk. This is a testable concept, and one that challenges the conventional “treat to target” approach for MS, for example, the common practice of advancing therapy for RMS patients incrementally, only when clinical relapses occur or new focal white matter lesions are found on serial MRI. The most promising near‐term opportunity to impact progressive MS might be to prevent its development in patients with early relapsing disease.
Conflict of Interest
At the time of submission, Dr. von Büdingen is an employee of F. Hoffman‐La Roche; at the time of study conception, execution, and preparation of the mansucript, he was a full‐time faculty member at UCSF. At the time of submission, Dr. Wang is an employee of Adaptive Biotechnology; at the time of study conception, execution, and preparation of the mansucript, he was a full‐time employee at UCSF. Dr. von Büdingen has received compensation for consulting activities from Roche, Novartis, and Genzyme, and research funding from Roche, Genentech, and Pfizer. Dr. Bischof reports travel support and speaking fees from Biogen Idec. Dr. Cree has received compensation for consulting activities from Biogen, EMD Serono, and Teva. Dr. Hauser serves on the scientific advisory boards for Symbiotix, Annexon, Bionure, Neurona, and Molecular Stethoscope; also reports receiving travel reimbursement and writing assistance from F. Hoffmann‐La Roche for CD20‐related meetings and presentations. No other disclosures were reported.
Supporting information
Figure S1. MRI Findings of the Brain and Spinal Cord.
Data S1: Materials and Methods.
Acknowledgments
We thank our patient for his enthusiastic participation in our study. This patient is a member of the UCSF MS EPIC cohort (http://msepicstudy.com); many members of the UCSF MS EPIC Team were involved in patient visit logistics, MR imaging, acquisition of clinical data, and lumbar punctures; the authors acknowledge in particular Refujia Gomez, Pamela Qualley, and William Stern. We also thank Andrew Barnecut for his editorial assistance with the preparation of this manuscript. These studies were supported by grants from the US National Multiple Sclerosis Society (RG4856 to HCvB), the NIH/NINDS (K02NS072288 and R01NS092835 to HCvB; R01NS026799 and R01NS049477 to SLH), gifts from Friends of the Multiple Sclerosis Research Group at UCSF, and an endowment by the Rachleff Family Foundation (HCvB). Dr. Bischof is supported by the Gottfried and Julia Bangerter‐Rhyner Foundation and the Freiwillige Akademische Gesellschaft (Basel, Switzerland).
References
- 1. Cree BA, Gourraud PA, Oksenberg JR, et al. Long‐term evolution of multiple sclerosis disability in the treatment era. Ann Neurol 2016;80:499–510. [DOI] [PMC free article] [PubMed] [Google Scholar]
- 2. Enzinger C, Fazekas F, Matthews PM, et al. Risk factors for progression of brain atrophy in aging: Six‐year follow‐up of normal subjects. Neurology 2005;64:1704–1711. [DOI] [PubMed] [Google Scholar]
- 3. Papinutto N, Schlaeger R, Panara V, et al. Age, gender and normalization covariates for spinal cord gray matter and total cross‐sectional areas at cervical and thoracic levels: a 2D phase sensitive inversion recovery imaging study. PLoS ONE 2015;10:e0118576. [DOI] [PMC free article] [PubMed] [Google Scholar]
- 4. Cross AH, Stark JL, Lauber J, et al. Rituximab reduces B cells and T cells in cerebrospinal fluid of multiple sclerosis patients. J Neuroimmunol 2006;180(1–2):63–70. [DOI] [PMC free article] [PubMed] [Google Scholar]
- 5. Bar‐Or A, Calabresi PA, Arnold D, et al. Rituximab in relapsing‐remitting multiple sclerosis: a 72‐week, open‐label, phase I trial. Ann Neurol 2008;63:395–400. [DOI] [PubMed] [Google Scholar]
- 6. Hauser SL, Waubant E, Arnold DL, et al. B‐cell depletion with rituximab in relapsing‐remitting multiple sclerosis. N Engl J Med 2008;358:676–688. [DOI] [PubMed] [Google Scholar]
- 7. Kappos L, Li D, Calabresi PA, et al. Ocrelizumab in relapsing‐remitting multiple sclerosis: a phase 2, randomised, placebo‐controlled, multicentre trial. Lancet 2011;378:1779–1787. [DOI] [PubMed] [Google Scholar]
- 8. Hauser SL. The Charcot Lecture beating MS: a story of B cells, with twists and turns. Multiple Sclerosis (Houndmills, Basingstoke, England). 2015;21:8–21. [DOI] [PMC free article] [PubMed] [Google Scholar]
- 9. Magliozzi R, Howell OW, Reeves C, et al. A Gradient of neuronal loss and meningeal inflammation in multiple sclerosis. Ann Neurol 2010;68:477–493. [DOI] [PubMed] [Google Scholar]
- 10. Reynolds R, Roncaroli F, Nicholas R, et al. The neuropathological basis of clinical progression in multiple sclerosis. Acta Neuropathol 2011;122:155–170. [DOI] [PubMed] [Google Scholar]
- 11. Popescu BF, Lucchinetti CF. Meningeal and cortical grey matter pathology in multiple sclerosis. BMC Neurol 2012;12:11. [DOI] [PMC free article] [PubMed] [Google Scholar]
- 12. Calabrese M, Poretto V, Favaretto A, et al. Cortical lesion load associates with progression of disability in multiple sclerosis. Brain. 2012;135(Pt 10):2952–2961. [DOI] [PubMed] [Google Scholar]
- 13. Fisniku LK, Chard DT, Jackson JS, et al. Gray matter atrophy is related to long‐term disability in multiple sclerosis. Ann Neurol 2008;64:247–254. [DOI] [PubMed] [Google Scholar]
- 14. Goodin DS, Traboulsee A, Knappertz V, et al. Relationship between early clinical characteristics and long term disability outcomes: 16 year cohort study (follow‐up) of the pivotal interferon beta‐1b trial in multiple sclerosis. J Neurol Neurosurg Psychiatry 2012;83:282–287. [DOI] [PubMed] [Google Scholar]
- 15. Rotstein DL, Healy BC, Malik MT, et al. Evaluation of no evidence of disease activity in a 7‐year longitudinal multiple sclerosis cohort. JAMA Neurol 2015;72:152–158. [DOI] [PubMed] [Google Scholar]
- 16. Trojano M, Pellegrini F, Fuiani A, et al. New natural history of interferon‐beta‐treated relapsing multiple sclerosis. Ann Neurol 2007;61:300–306. [DOI] [PubMed] [Google Scholar]
- 17. Smith SM, Jenkinson M, Woolrich MW, et al. Advances in functional and structural MR image analysis and implementation as FSL. NeuroImage 2004;23(Suppl 1):S208–S219. [DOI] [PubMed] [Google Scholar]
- 18. Schlaeger R, Papinutto N, Panara V, et al. Spinal cord gray matter atrophy correlates with multiple sclerosis disability. Ann Neurol 2014;76:568–580. [DOI] [PMC free article] [PubMed] [Google Scholar]
- 19. Absinta M, Vuolo L, Rao A, et al. Gadolinium‐based MRI characterization of leptomeningeal inflammation in multiple sclerosis. Neurology 2015;85:18–28. [DOI] [PMC free article] [PubMed] [Google Scholar]
- 20. von Budingen HC, Kuo TC, Sirota M, et al. B cell exchange across the blood‐brain barrier in multiple sclerosis. J Clin Investig 2012;122:4533–4543. [DOI] [PMC free article] [PubMed] [Google Scholar]
Associated Data
This section collects any data citations, data availability statements, or supplementary materials included in this article.
Supplementary Materials
Figure S1. MRI Findings of the Brain and Spinal Cord.
Data S1: Materials and Methods.