

Abstract
Glycosylation is one of the most common post-translational modifications of proteins and plays essential roles in various biological processes, including protein folding, host-pathogen interaction, immune response, and inflammation and aberrant protein glycosylation is a well-known event in various disease states including cancer. As a result, it is critical to develop rapid and sensitive methods for the analysis of abnormal glycoproteins associated with diseases. Mass spectrometry in conjugation with different separation methods, such as capillary electrophoresis, ion mobility, and high performance liquid chromatography, has become a popular tool for glycoprotein analysis, providing highly informative fragments for structural identification of glycoproteins. This review provides an overview of the developments and accomplishments in the field of glycomics and glycoproteomics reported between 2014 and 2016.
Keywords: Mass spectrometry, Enrichment, Purification, Glycomics, Glycoproteomics, Biomedical Applications
1. Introduction
Protein glycosylation is a common and important post-translational modification that plays a critical role in a wide range of biological processes, such as intra- and intercellular signaling, inflammation, tumor immunology, protein folding and protein stabilization. Abnormal protein glycosylation and alteration of glycans have been associated with many diseases such as pancreatic, breast and gastric cancers. Therefore, the comprehensive characterization of protein glycosylation at high sensitivity is a major step for either the early detection diseases or the evaluation of therapeutic efficacy for treatment of diseases [1–3].
Glycosylation of proteins has two major forms, namely N-linked glycosylation (N-glycosylation) and O-linked glycosylation (O-glycosylation), together with less abundant forms such as C-glycosylation and phosphoglycosylation. N-Glycosylation involves the attachment of a glycan chain to the amide end of an asparagine residue in an Asn-X-Ser or Asn-X-Thr sequon, where X can be any amino acid except proline. The glycoprotein is correctly folded, after the glycan attachment; therefore, N-glycosylation influences the tertiary structure and the stability of the glycoprotein. On the other hand, O-glycosylation does not involve any specific motif but includes the modification of serine or threonine residues through the attachment of oligosaccharides and occurs after protein folding. Also, there were some rare types of glycosylation detected in mammalian proteins, including Glcβ-Asn, Man-α, C-mannosylation and Glcβ1–3Fuc-α in laminin, α-dystroglycan, properdin and thrombospondin proteins, respectively. Attachment of different glycan structures to the same glycosylation site, structural microheterogeneity, poses additional challenges in glycomics and glycoproteomics.
Over the past decade, mass spectrometry (MS) techniques such as high-performance liquid chromatography-electrospray tandem mass spectrometry (LC–ESI-MS/MS) and matrix-assisted laser desorption/ionization time-of-flight tandem mass spectrometry (MALDI-TOF MS/MS), coupled to a variety of dissociation techniques, including high or low energy collision-induced fragmentation (CID), electron excitation dissociation (EED), electron capture dissociation (ECD), electron transfer dissociation (ETD) and electron detachment dissociation (EDD), have become a powerful tools for glycan profiling due to their high sensitivity and ability to provide glycan structural information [4–8].
Over the past few years, several published articles have reviewed the analytical methods developed for the characterization of glycans and glycoproteins with focuse on chromatography, electrophoresis, electrochemistry and mass spectrometry [2–4, 8–16]. This review specifically summarizes and highlights recent developments (2014–2016) in the fields of glycomics and glycoproteomics with emphasis on the latest advancements involving mass spectrometry imaging, ion mobility-mass spectrometry, and capillary separations. This review also highlights sample preparation methods recently developed for labeling of glycans and glycopeptides and enrichment of glycoproteins.
2. Advancements in sample preparation methods
The release of glycans from purified glycoproteins or glycoproteins in complex biological samples remains to be a time consuming process. Usually, the enzymatic release of N-glycans is achieved through overnight incubation at 37 °C while more elaborate and laborious protocols are employed to release O-glycans effectively. Recently, several methods have been developed to enable efficient release of N- and O-glycans at a much shorter time employing much less laborious protocols.
2.1. Advancements in the release of glycans
Recently, a simple and efficient approach has been introduced to prepare N- and O-glycans and glycosphingolipid-derived glycans (GSL-glycans) [17]. This method involved the oxidative release of natural glycans (ORNG) by using sodium hypochlorite (NaClO), which selectively liberates intact N-, O- and GSL-glycans. NaClO degrades N-glycoproteins in 2-minutes at room temperature, and releases free reducing end N-glycans, which can be subsequently derivatized (Figure 1a). MALDI-TOF-MS analysis of native N-glycans derived from model glycoproteins, such as ovalbumin, bovine immunoglobulin (IgG) and horseradish peroxidase (HRP), depicted the production of N-glycans as glycosylamines, which, in aqueous conditions at room temperature, automatically convert to free reducing glycans (Figure 1b). The results also suggested that the labile sialic acid residues are preserved during ORNG, as shown in the case of N-glycans derived from bovine fetuin (Figure 1c). Moreover, analysis of the NaClO treatment products from porcine stomach mucin, using MALDI-TOF-MS, demonstrated recovered intact O-glycans with their reducing ends bound to lactic or glycolic acid; however, larger amounts of NaClO and longer incubation times were needed to degrade peptide chains and release O-glycans (6-times more reagent and 24 hrs of incubation). Finally, comparison of permethylated glycans released from fetuin and human plasma using Peptide-N-Glycosidase F (PNGase F) or ORNG revealed MALDI-TOF-MS profiles that were closely similar, which confirmed that ORNG could be used as a cheap and rapid method for glycomic profiling of large-scale biological samples.
Figure 1.

NaClO treatment of glycoproteins to release N-glycans. (a) Chemical scheme of NaClO treatment. (b) MALDI-TOF-MS profiles of N-glycans released from several glycoproteins by bleach treatment. (c) MALDI-TOF-MS profiles of permethylated glycans released from fetuin by PNGase F digestion (top) or bleach treatment (bottom). Reprint with permission from Ref [17]
Waters and Prozyme introduced two kits enabling rapid enzymatic release of N-glycans. Both products facilitate the release of N-glycans in minutes. Waters reported a complete deglycosylation in approximately 10 min, using a high concentration of an enzyme-compatible surfactant combined with elevated incubation temperature [18]. Briefly, glycoprotein solutions (0.52 mg/ml, 28.8 μl) containing 1% (w/v) RG surfactant (RapiGest SF, Waters, Milford) and 50 mM HEPES buffer, at pH 7.9, were heated to approximately 95 °C for 2 min, which is critical for glycoprotein denaturation, to render oligosaccharide structures readily accessible for enzymatic deglycosylation. The solutions were allowed to cool to 50 °C, and then 1.2 μl of PNGase F solution was added (GlycoWorks Rapid PNGase F, Waters, Milford). The samples were incubated for 5 min at 50 °C to complete deglycosylation. In some cases, in order to complete deglycosylation, a reducing agent (such as tris(2-carboxyethyl)phosphine) must be used. It is believed that some surfactants, such as RG, enhance deglycosylation by relaxing protein structure and ensuring that N-glycans are accessible for efficient deglycosylation. HILIC-FLR chromatograms and MS analysis of IgG1 monoclonal antibody (mAb) samples, before and after the deglycosylation process, showed complete loss of its N-glycans and confirmed the completeness of glycan release using this method.
Prozyme procedure, on the other hand, involved denaturation prior to mixing with N-glycanase solution (GS24-RX, GlykoPrep Digestion Module, Prozyme, Hayward) and incubation at 37 °C for 15–60 min to complete deglycosylation. The incubation time is dependent on the glycoprotein structure. For glycoproteins that are comparatively easy to deglycosylate, such as monoclonal antibodies, 15 min incubation was reported to be sufficient to completely deglycosylated such glycoprotein (http://prozyme.com/collections/glykoprep-2-ab/products/gp24ng-ab).
2.2. Advancements in the purification and enrichment of glycans and glycoproteins
Although recent advances in mass spectrometry possess many advantages in glycoproteomics, direct analysis of glycoproteins in complex samples by MS based strategies remains a significant challenge, because of their typical low abundance, heterogeneity of each glycosylation site, the complexity of glycan structures and the low ionization efficiency relative to unmodified proteins. Therefore, the selective enrichment and isolation of glycopeptides from biological samples is necessary for MS-based glycoproteomics. Accordingly, various glycoprotein enrichment methods have been developed and discussed in several reviews [19–22]. These developed methods are based on hydrophilic interaction chromatography (HILIC), hydrazide chemistry, boronate and lectin-based affinity, ion-pairing, and size exclusion methods.
A new strategy based on solid-phase extraction for the sensitive and selective MS analysis of glycans was reported by Li et.al. [23]. Heptadecafluoroundecylamine, a hydrophobic fluorinated carbon tag, was used for the derivatization of glycans via reductive amination, and facilitating the enhancement of MS ionization efficiency of glycans by more than one order of magnitude. Perfluoroalkyl compounds possess a number of defining characteristics, such as high hydrophobicity and chemical stability as well as low polarizability that permit effective purification and MS analysis of labeled glycans. Also, the fluorinated carbon tag enabled efficient fluorous solid-phase extraction of labeled glycans through their dipole–dipole interactions with the fluorinated carbon-linked silica gel as a stationary phase, facilitating purification of glycans from solutions containing MS interfering species such as proteins, detergents, and salts. The reported method enabled the detection of 34 N-glycans, including each of the three major N-glycosylation forms (high mannose, complex, and hybrid structures), from a 0.25-μL aliquot of human serum.
To facilitate high throughput quantitative studies, a method based on a 96-well plate platform has been developed for the comparative evaluation of fucosylation changes in serum haptoglobin of patients with hepatocellular carcinoma (HCC) versus cirrhosis [24]. In the reported strategy, an antibody-immobilized HPLC column was used for extraction and enrichment of haptoglobin, followed by N-glycan release, desialylation, extraction, and permethylation performed on a 96-well plate platform. The use of a single 96-well plate for denaturation, deglycosylation, and desialylation of the glycoproteins minimized the sample loss that is commonly observed during multiple-step procedures. A porous graphitized carbon (PGC) containing 96-well plate was used for the purification of released N-glycans, which were subsequently permethylated using a 96-well spin column plate filled with sodium hydroxide beads (Figure 2.I). MALDI-TOF-MS analysis of the permethylated N-glycans indicated that the degree of haptoglobin bifucosylation was significantly elevated in HCC patients compared with cirrhosis patients (Figure 2.II). The method provided a high throughput technique for the glycomic evaluation of a large cohort of clinical serum samples.
Figure 2.


(I) Workflow scheme of the purification of haptoglobin from serum using 96-well plate format for MS analysis of N-glycans. (II) MALDI-QIT-TOF MS spectra show the difference of fucosylation in tri- and tetra-antennary N-glycans of haptoglobin between (a) HCC and (b) cirrhosis. Reprint with premssion from Ref [24]
A disposable functionalized membrane suitable for the coating of MALDI targets or substrates such as glass or plastic was fabricated for glycopeptide enrichment and MS analysis [25]. Hydrophobic and hydrophilic plates were constructed by coating porous C18 and polyhydroxyethyl silica particles on a polydimethylsiloxane (PDMS)-coated plate, respectively. The C18 coated-plates proved effective for the removal of SDS, urea, and salts commonly utilized in the extraction of proteins from cell lysate. The use of such plates was shown to be more effective than conventional C18 coated or packed tips. Meanwhile, the polyhydroxyethyl silica particle-coated PDMS plate purification produced a three-fold enhancment of the MALDI-MS signal observed for glycopeptides derived from HRP that were contaminated with bovine serum albumin (BSA) peptides. Peptides originating from BSA were effectively removed upon washing while glycopeptides derived from HRP were retained resulting in an enhanced MALDI-MS signal.
Hamouda and coworkers introduced a rapid and reproducible sample preparation process to profile surface N-glycosylation in living cells by MALDI-TOF, using HEK 293 cells as a model [26]. The traditional procedure for glycome analysis involves cell lysis and extraction of membrane glycoproteins, which results in contamination of the sample with a large number of high-mannose N-glycans that stem from endoplasmic reticulum derived intracellular glycoproteins. Contrastingly, the reported method directly cleaves cell surface glycopeptides by tryptic digestion of living cells. Harvested cells were thoroughly washed with PBS and centrifuged at low speed (15 min at 600 rpm), after which the cell pellets were digested using trypsin at 37 °C. The samples were then centrifuged at 15,000 rpm (15 min at 4 °C) and the released cell surface glycopeptides, present in the supernatant, were collected. PNGase F digestion of the glycopeptides followed and released glycans were purified from the peptide mixture using C18 cartridges. The presented results suggested an enhanced detection and quantification of complex-type N-glycans associated with cell membrane proteins. Although differences in the glycomic profiles suggested that cells remained intact after enzymatic treatment, no additional data such as imaging or spectroscopic were presented to support that claim.
An off-line strategy, utilizing a 3-carboxy-benzoboroxole-functionalized monolithic capillary column, was described for the enrichment and MS analysis of glycoprotein/peptides in complex biological samples [27]. The reported method takes advantage of the fact that benzoboroxoles, a unique class of boronic acids, have a strong affinity for the recognition and binding of cis-diol-containing compounds. By the analysis of 3-carboxy-benzoboroxole purified glycopeptides, from tryptic digests of HRP, and intact glycoproteins, from human saliva, the reported hyphenated approach was successfully validated, with a total of 22 glycopeptides and 6 intact glycoproteins identified.
An efficient method for purification of N-linked glycans derived from human serum proteins has been developed based on a cysteine-bonded zwitterionic hydrophilic material known as Click TE-Cys that exhibits positive and negative charges on the amino and carboxylic groups of the immobilized cysteine, respectively [28]. The unique surface structure and charge distribution of the material (positively and negatively charged groups are parallel to the surface of the silica gel), resulted in Click TE-Cys having a high degree of hydrophilicity that facilitated the effective removal of co-existing salts and endogenous serum peptides in comparison with PGC and zwitterionic (ZIC)-HILIC materials. N-glycans liberated from IgG and also a mixture of tryptic peptides from human serum albumin mixed with IgG N-glycans were used to test the Click TE-Cys substrate’s ability to remove peptides from the glycan fraction. Prior to enrichment, peptide signals dominated the mass spectra causing only one N-linked glycan to be detected with low peak intensity and a poor S/N ratio. However, following purification, 16 IgG N-linked glycans were identified confirming the removal of the co-existing peptides and salts. Moreover, when the same sample was purified using PGC or ZIC-HILIC the MS results exhibited mass spectra dominated by peptide signals with limited N-glycans detection, if any. The electrostatic repulsion interactions between the Click TE-Cys material and the co-existing peptides, both of which were positively charged at the experimental pH, facilitated the removal of the peptides from the glycan fraction.
Filter aided sample preparation involves the use of a molecular weight cutoff filter for the removal of complex lysis buffer or metabolic contaminants from biological specimens. Filter-aided-N-glycan separation coupled to labeling with glycan hydrazide tags has been developed to create high-throughput quantitative glycan workflow for complex biological samples [29]. The results demonstrated that the described strategy was comparable to SPE preparation, a widely utilized technique for glycan purification, in terms of glycan abundances, quantitative reproducibility, and had no obvious bias toward different classes of glycans samples. Also, a definitive screening design of experiments was used to optimize the MS parameters for glycan analyses, the results of this optimization, when applied to plasma samples, demonstrated a 3-fold increase in sensitivity.
Owing to the superior physicochemical characteristics of nanomaterials, such as large specific surface area, their capacity for functionalization, and outstanding mechanical, and both their thermal and electrical properties, different nanomaterials have been utilized in some of the aforementioned enrichment strategies. As an example, carbon-functionalized ordered graphene/mesoporous silica composites, characterized by their large surface area and uniform pore size, were used for selective extraction of glycans in human serum (Figure 3) [30]. The nanocomposite possessed many benefits, including high enrichment capacity, quick adsorption process, proper magnetization and high recovery efficiency. Table 1 gives an overview of the different substrates that have been recently used for glycan and glycoprotein enrichment.
Figure 3.

(I) Selective enrichment of glycans using carbon-functionalized ordered graphene/mesoporous silica to further characterization by MS analysis. (II) MALDI-TOF MS analysis of N-linked glycan released from OVA: (a) without enrichment; (b) after enrichment by active carbon materials; (c) after enrichment by C-graphene@mSiO2 nanocomposites. Reprint with permission from Ref [30]
Table 1.
Overview of the different functionalized nanomaterials that have been recently used for glycan and glycoprotein enrichment.
| Enriched Species | Sorbent | Interaction | Sample (s) | MS technique(s) | Ref. |
|---|---|---|---|---|---|
| Glycan | Pyrenebutyric hydrazide functionalized reduced graphene oxide (PBH-rGO) | Hydrazide-aldehyde coupling | Human serum | MALDI-TOF-MS | [104] |
| Glycan | Ordered mesoporous silica–carbon composite nanoparticles (NP-MCM-C) | Size exclusion | Human serum | MALDI-TOF-MS | [105] |
| Glycan & Glycopeptide | Glucose-functionalized hydrophilic magnetic mesoporous nanoparticles (Fe3O4@mSiO2-glucose) | Hydrophilic interaction & Size exclusion | HRP & human serum | Nano-LC–MS/MS | [106] |
| Glycopeptide | Hydrazide functionalized poly(amido amine) (PAMAM) nano-polymer | Hydrazide-aldehyde coupling | Human serum | MALDI-TOF-MS | [107] |
| Glycopeptide | Boronic-acid-functionalized Fe3O4 nanoparticles (Fe3O4@SiO2-APB) | Boronate affinity | Human serum | MALDI-TOF-MS & Nano-LC–MS/MS | [108] |
| Glycopeptide | Hydrazide-functionalized poly-GMA modifed magnetic nanoparticles (Fe3O4@pGMA-H) | Hydrazide-aldehyde coupling | Mouse liver | MALDI-TOF-MS | [109] |
| Glycopeptide | Hydrazide-functionalized poly-methacrylic modifed magnetic nanoparticles (Fe3O4@PMAH) | Hydrazide-aldehyde coupling | Colorectal cancer patient serum | MALDI-TOF-MS & Nano-LC–MS/MS | [110] |
| Glycopeptide | Triblock copolymer grafted silica-microparticles (TCP-SMs) | Zwitterionic–Hydrophilic interaction | Mouse liver | MALDI-TOF-MS & Nano-LC–MS/MS | [111] |
| Glycopeptide | Boronic acid-functionalized magnetic carbon nanotubes (APBA–MCNTs) | Boronate affinity | HRP & Asialofetuin | MALDI-TOF-MS | [112] |
| Glycopeptide | Cysteine-functionalized polyethylenimine-gold graphene oxide nanocomposite (GO–PEI–Au–L-Cys) | Zwitterionic–Hydrophilic interaction | Human serum | MALDI-TOF-MS | [113] |
| Glycopeptide | Amino-functionalized metal–organic frame-work (MOF-NH2) | Hydrophilic interaction | Human serum | MALDI-TOF-MS | [114] |
| Glycopeptide | Maltose-functionalized iron oxide magnetic nanoparticles (Fe3O4@Maltos) | Hydrophilic interaction | HRP, IgG, human renal mesangial cells | MALDI-TOF-MS | [115] |
| Glycopeptide | Cysteine functionalized gold nanoparticles (GNPs) immobilized poly (glycidyl methacrylate-co-poly(ethylene glycol) diacrylate) monolith | Zwitterionic–Hydrophilic interaction | Human serum | NanoRPLC-ESI-MS/MS | [116] |
| Glycopeptide | Magnetic nanoparticles coated with maltose-functionalized polyethyleneimine (Fe3O4-PEI-Maltose) | Hydrophilic interaction | Mouse liver & IgG | MALDI-TOF-MS | [117] |
| Glycopeptide | Magnetic Poly(Styrene-co-4-Vinylbenzene-boronic acid) Microspheres (Fe3O4@SiO2@PSV) | Boronate affinity | HRP & human serum | Nano-LC–MS/MS | [118] |
| Glycopeptide | Polyethylene glycol functionalized gold nanoparticles (GNPs) immobilized on magnetic graphene oxide (GO/Fe3O4/Au/PEG) | Hydrophilic interaction | HRP & human serum | MALDI-TOF-MS | [119] |
| Glycopeptide | Chitosan-polyglycidyl methacrylate-poly iminodiacetic acid (CS@PGMA@IDA) nanomaterial | Hydrophilic interaction | HRP, IgG & human serum | MALDI-TOF-MS | [120] |
| Glycopeptide | Cysteine functionalized gold nanoparticles (GNPs) immobilized on polydopamine-coated magnetic graphene composites (MagG/PDA/Au/L-Cys) | Zwitterionic–Hydrophilic interaction | human serum | MALDI-TOF-MS | [121] |
| Glycopeptide | Concanavalin A-chelating magnetic nanoparticles (Con A-MNPs) | Lectin affinity | Ovalbumin & egg white | SDS-PAGE | [122] |
| Glycopeptide | Magnetic colloidal nanocrystal clusters coated with chitosan (Fe3O4@CS MCNCs) | Hydrophilic interaction | HeLa cells | MALDI-TOF-MS & LC–MS/MS | [123] |
| Glycopeptide | SiO2-RAFT@PMSA nanoparticles | Zwitterionic–Hydrophilic interaction | Mouse liver & IgG | MALDI-TOF-MS & LC–MS/MS | [124] |
| Glycopeptide | Hydrazine functionalized polymer brushes hybrid magnetic nanoparticles (Fe3O4@SiO2@GMA–NHNH2)) | Hydrazide-aldehyde coupling | Ovalbumin, fetuin, human liver cancer tissues | MALDI-TOF-MS & LC–MS/MS | [125] |
| Glycopeptide | 4-mercaptophenylboronic acid functionalized gold nanoparticles immobilized on graphene oxide nanosheets (GO/PEI/Au/4-MPB) | Boronate affinity | HRP & asialofetuin | MALDI-TOF-MS | [126] |
| Glycopeptide | Dendrimer-assisted magnetic graphene-silica nanocomposite (Fe3O4-GO@nSiO2-PAMAM-Au-maltose) | Hydrophilic interaction | Mouse liver & IgG | MALDI-TOF-MS | [127] |
| Glycopeptide & glycoprotein | Phenylboronic acid and copolymer multifunctionalized magnetic nanoparticles (Fe3O4@P(AAPBA-co-monomer)) | Boronate affinity & Hydrophilic interaction | HRP & egg white | MALDI-TOF-MS | [128] |
| Glycoprotein | Benzoboroxole-functionalized magnetic composite microspheres (Fe3O4/PAA-AOPB) | Boronate affinity | BSA, MYO, β–casein, HRP | SDS-PAGE | [129] |
2.3. Advancements in the derivatization of glycans and glycoproteins
Glycans are hydrophilic molecules that do not ionize efficiently in MS and are only separated by capillary electrophoresis and hydrophilic interaction based chromatography. Derivatization of glycans improves separation and enhances detection. A variety of chemical reagents has been used to derivatize glycans prior to MS analysis as a means to enhance ionization efficiency and eliminate ionization bias between neutral and acidic glycans. ESI- and MALDI-MS of glycans is improved by derivatization with hydrophobic reagents, which is routinely achieved via permethylation, reductive amination, and hydrazide chemistry. For this purpose, usually glycoproteins or glycopeptides were digested by glycosidase enzymes (e.g. PNGase F or Endo-α-N-acetylgalactosaminidase for N−/O− glycoperoteins, respectively) to release glycan molecules, which can be further subjected to chemical derivatization. Figure 4 shows the typical reaction of PNGase F, which hydrolyzes the amide bond of β-aspartylglycosylamine to produce a glycosylamine that can be derivatized using amine reactive labels or can be allowed to equilibrate to the aldehyde/hemiacetal forms that can be derivatized with aldehyde reactive labeling reagents.
Figure 4.

Reaction mechanism of PNGase F and N-linked glycopeptides.
In addition, relative quantification strategies improve run to run variation, which originates in part from instrument instability and sample preparation, through normalization of internal standards. In this regard, relative quantitation strategies based on stable isotope labeling combined with MS detection is a promising analytical tool for the qualitative and quantitative analysis of glycans derived from biological samples.
All the labeling methods mentioned above improve the detection of derivatized N-glycans in MS. A labeling approach derived from the tandem mass tag (TMT), a strategy first developed for proteomics, has been recently adopted for the analysis of N-glycans. The quantitation of such labeled glycans is based on the detection of reporter ions generated in tandem MS. This TMT approach enabled simultaneous analysis of up to six samples.
2.3.1. Advancements in the chemical labeling of glycans and glycopeptides
2.3.1a. Permethylation of glycans
Permethylation is currently considered one of the most common derivatization methods in MS-based glycomics analysis. The procedure improves ionization efficiency and stability of sialylated glycans in positive ionization mode and also enhances separation performance on reversed-phase liquid chromatography (RPLC). However, intermolecular interactions between the methyl groups in high-molecular-weight branched glycans was shown to result in peak broadening on a C18 column and adversely influenced the efficiency of the separation. Improvement in peak width, peak shape as well as resolution in isomeric separation was obtained by employing high separation temperature conditions (55 °C as optimized temperature) for RPLC of permethylated glycans [31]. Higher molecular vibration at elevated temperatures effectively reduces the number of glycan molecular conformers, which contributed to the reduction in peak width and subsequently enhanced separation efficiency. The performance of high-temperature C18-LC-MS/MS analysis of glycans was confirmed by using pooled human blood serum, as a complex biological sample. To further investigate the applicability of the optimized method, permethylated free oligosaccharides, and N-glycans derived from bovine, goat and human milk were explored [32]. The LC-MS/MS analyses revealed (without isomeric consideration) the presence of 11, 8 and 11 free oligosaccharide compositions and 58, 21 and 43 N-glycan structures in bovine, goat, and human milk samples, respectively. Also, the isomeric glycans in milk samples were successfully resolved by PGC-LC at elevated temperatures.
The relationship between retention time and glycan structure has been investigated by the separation of permethylated N-glycans, using a C18 nanocolumn that was interfaced to an Orbitrap mass spectrometer [33]. The data obtained from dextrin, dextran, and N-glycans extracted from model glycoproteins confirmed the relationship between retention time and glycan structure, degree of branching (antennary), and molecular weight. The results demonstrated that retention time values are inversely related to the branching of glycans and increase linearly as the number of glucose units in the glycan structures rise.
2.3.1b. Labeling of sialylated glycans
A new strategy for in-depth characterization of glycopeptide structures using MALDI-QIT-TOF-MS has been introduced, complete derivatization of carboxyl groups to methylamine is achieved using (7-azabenzotriazol-1-yloxy) tripyrrolidinophosphonium hexafluoro-phosphate, as a condensing reagent, which enhances fragmentation efficiency of glycans under negative-ion CID conditions and suppresses preferential loss of sialic acid residues during MS analysis [34]. During negative-ion CID, strong negative charge retention on peptide moieties inhibits efficient proton abstraction from hydroxyl groups on glycan moieties. Derivatization of glycopeptide carboxyl groups decreased negative charge retention on peptide moieties and improved fragmentation of glycans in negative-ion mode. The combination of these two advantages enabled detailed characterization of glycopeptide structures, including those of sialylated glycopeptides. Finally, in-depth structural information on peptide sequence and glycan composition were obtained by positive and negative ion CID analysis of methylamine-derivatized glycopeptides.
A facile method was reported for the derivatization of IgG glycopeptides, from both human plasma and biopharmaceutical sources, with selective reactivity for different sialic acid linkages, which can be used for IgG subclass- and sialic acid-linkage-specific glycosylation analysis by MALDI-TOF-MS [35]. The method, employing dimethylamidation with the carboxylic acid activator 1-ethyl-3-(3-dimethylamino)propyl)carbodiimide and the catalyst 1-hydroxybenzotriazole, resulted in uniform peptide modification. Distinct masses being imparted onto α2,3 and α2,6 linked sialic acids, by their respective lactonization (Δm: −18.011 Da) and dimethylamidation (Δm: +27.047 Da), resulted in a mass difference of 45.058 Da and enabling mass discrimination during MS analysis. When compared to fragmentation spectra of underivatized samples, which were dominated by sialic acid loss, more informative fragmentation spectra of sialylated glycopeptides were obtained by stabilization of sialylated structures.
Recently, co-derivatization of succinimidyloxycarbonylmethyl tris (2,4,6-trimethoxyphenyl) phosphonium bromide and methylamidation was used to conduct highly sensitive MALDI-MS analyses of N-glycans by introducing a permanent positive charge and neutralizing carboxylic groups simultaneously. This method resulted in 20 and 50-fold enhancement in the detection sensitivity for sialylated and desialylated N-glycans, respectively [36]. The technique was successfully validated using three model glycoproteins, including ribonuclease B, ovalbumin, and transferrin.
2.3.1c. Labeling of glycan reducing end
A rapid and sensitive approach for glycan profiling was introduced using HILIC-Fluorescence-ESI-MS [18]. A labeling reagent, named RapiFluor-MS (RFMS), comprised of an N-hydroxysuccinimide (NHS)-carbamate reactive group, a quinoline fluorophore, and a tertiary amine for enhancing ionization efficiency, was synthesized and rapidly reacted (less than 5 min) with glycosylamines upon their release from glycoproteins using PNGase F. An NHS-carbamate reactive group was chosen for its rapid reaction kinetics with amine residues of released glycans via a peptide-type amine reaction. In addition to rapid tagging capabilities, the new labeling reagent also supports high sensitivity fluorescence and MS detection through a quinoline fluorophore, which serves as the central functionality of the new reagent, and a tertiary amine side chain, respectively. The efficiency of the method was demonstrated by characterizing the N-glycan profile of monoclonal antibody samples. Figure 5.I, presents HILIC fluorescence and base peak intensity MS chromatograms for labeled N-glycans with RFMS and Instant AB, which demonstrated higher fluorescence and MS signal for RFMS labeled N-glycans. The performance of RFMS labeling has also been compared to other conventional labeling reagents (Figure 5.II). It was determined that RFMS labeled glycans were detected with superior sensitivity, specifically with 14 times higher fluorescence and 160 times greater MS signal than 2-AB labeled glycans.
Figure 5.

(I) HILIC-FLR-MS of (a) RFMS- and (b) IAB-labeled N-glycans from anticitrinin murine IgG1 (using 0.4 μg of glycoprotein). Fluorescence (FLR) chromatograms are shown in orange and base peak intensity (BPI) MS chromatograms are shown in blue. (c) Response factors for RFMS and IAB labeled glycan (measured as the FA2 peak area per sample of N-glycans resulting from 1 μg of anticitrinin murine IgG1) (II) Relative (%) performance of glycan labels. Response factors shown as percentages versus the fluorescence and MS response factors of RFMS labeled N-glycans. Reprint with permission from Ref [18]
In the interest of further improving sensitivity in MALDI MS glycan analysis, Jiao and coworkers reported direct and effective N-glycan profiling by simultaneously suppressing the ionization of interfering species, such as peptides, while increasing the ionization efficiency of glycans. This was accomplished by labeling the reducing end of glycans with diazanyl groups using a hydrazinonicotinic acid labeling reagent [37]. The signal to noise ratio (S/N) was improved by more than one order of magnitude in both positive and negative ion mode. Complementary fragmentation patterns for the elucidation of glycan structures were obtained by using a unique acid catalyzer and resulted in the identification of 40 N-glycans in 10 μL of human serum samples.
A sensitive high-throughput approach has been introduced, based on 96-well plate sample preparation and MS analysis of 2-aminobenzoic acid labeled N-glycans, for the characterization of biopharmaceuticals in early development [38]. The tag not only improved ionization by the contribution of an additional charge carrying residue to the N-glycan, but it also promoted separation of the labeled glycans on a reverse phase column where N-glycans were separated according to their glycan type (high mannose, hybrid and complex). Different glycan isomers could be identified, and various samples were successfully analyzed with minimal sample consumption.
Procainamide labeling significantly increases fluorescent and MS sensitivities of N-glycans. Recently, to inhibit fucose migration during tandem MS analysis, the effect of labeling N-glycans with procainamide was evaluated by Nwosu et.al. [39]. Core fucosylation was rapidly verified by the observation of a peak at m/z 587.3, corresponding to [GlcNAc + Fucose + Procainamide + H]+ in the tandem MS spectrum. The results confirmed procainamide labeling not only increased fluorescent and MS sensitivity of N-glycans, but also reduced fucose migration during tandem MS analysis thus resulting in increased confidence in the assignment of protein fucosylation. The proposed approach was successfully validated by analyzing both core and antenna fucosylated glycoproteins.
2.3.1d. Hydrazine labeling of glycans
A hydrazine labeling procedure was applied for glycan profiling of chicken avidin and human serum samples [40]. Ten hydrazino-s-triazine based labeling reagents were synthesized and evaluated for their efficiency by non-reductive labelling of standard maltoheptaose (DP7) via HILIC–ESI-MS. Three of the ten labelling reagents were shown to be reliable with satisfactory linearity and an almost 30-fold improvement in limits of detection.
2.3.2. Isotopic labeling of glycans
Today, MS-based isotopic labeling is a promising tool in quantitative glycomics. Currently, enzymatic 18O-labeling, chemical labeling, and metabolic labeling are the three most currenlty used approaches. In the enzymatic O-labeling process, incorporation of 18O into the reducing ends of glycans occurs by releasing N-glycans from glycoproteins using an endoglycosidase in the presence of 18O-water. An efficacious enzymatic labeling method, termed glycan reducing end dual isotopic labeling by PNGase F catalysis and NaBD4 reduction was reported, in which 18O and D atoms were incorporated into glycans [41]. The NaBD4-mediated reduction reaction replaced the H atom with the D atom and increased the molecular mass difference between the labeled glycan pairs, which reduced the overlap of isotopic clusters. Moreover, the stability of 18O-labeled glycans improved by reducing the aldehyde group of the glycan to a hydroxyl which impeded the exchange between 18O and 16O in normal water.
Recently, a stable isotope labeled IgG2b monoclonal antibody, iGlycoMab, has been used as an internal standard to minimized errors caused by sample handling (digestion and derivatization) and instrumentation (fluctuation of nanoESI efficiency) in N-glycan profiling by LC-MS analysis [42]. Although, the unexpected degradation of isotopically labeled glycans was observed when iGlycoMab was denatured and digested with blood serum, the stability of the labeled glycan was improved by increasing the denaturation temperature and by performing a tryptic digest of the samples prior to the addition of iGlycoMab internal standard.
2.3.3. Multiplexed labeling of glycans
Aminoxy tandem mass tag (aminoxyTMT) reagents are newly commercialized isobaric tags that enable relative quantitation of up to six different glycan samples simultaneously, effectively improving quantitative reliability and analytical efficiency while also resulting in significant time savings for LC–MS. It was first introduced by Hahne et al. [43]. They explored stable isotope labeled carbonyl-reactive tandem mass tags (glyco-TMTs) as a novel approach for the quantification of N-linked glycans. Glyco-TMTs were investigated as hydrazide- and aminooxy-functionalized reagents and a detailed comparison demonstrated that aminooxy TMTs were superior to their hydrazide counterparts, in terms of labeling efficiency (>95% vs. 65% at 0.1 μM) and quantification accuracy (15% vs. 36%). The results also showed that glycan quantification using heavy and light glyco-TMTs was superior to reporter ion quantification in tandem MS spectra. High lability of O-glycosidic bonds in the gas phase results in extensive fragmentation along glycosidic bonds, which negatively affects quantification accuracy and dynamic range. The practical usefulness of the developed approach was confirmed by N-glycan profiling of isogenic human colon carcinoma cell lines. Finally, the use of the aminoxyTMT method was demonstrated to feature a simple labeling procedure, excellent labeling efficiency, and improved ionization performance due to the presence of tertiary amine groups in the reporter region of the aminoxyTMT tags.
Modification of glycans by an aminoxyTMT tag, also improves electrophoretic separation of the labeled neutral and acidic glycans, by introducing a tertiary amine group at the glycan reducing end. Online coupling of capillary electrophoresis (CE) with ESI-CID-MS/MS for the analysis of multiplexed aminoxyTMT-labeled glycans derived from human serum proteins and different glycoprotein standards has been investigated by Zhong and coworkers [44]. CE coupled with traveling wave ion mobility (TWIM)-CID MS/MS was also demonstrated to be efficient in resolving human milk oligosaccharide isomers and improving relative quantification accuracy. In the case of small sialylated oligosaccharides and high-mannose N-glycans, CID fragmentation of the [M + Na + H]2+ ion was found to generate the most information rich tandem mass spectra for qualitative and quantitative analyses. Also, an MS3 based quantification method was used for relative quantification of complex type N-glycans without interference from HexNAc fragments. The performance of the method was demonstrated by CE-ESI-MS/pseudo-MS3 analysis of six-plex aminoxyTMT labeled N-Glycans released from human serum proteins.
Recently, a reliable PGC-LC–MS/MS quantitative glycomic analysis of different biological samples, using aminoxyTMT reagents was introduced [45]. The optimized LC gradient conditions reported provided effective isomeric separation of TMT-labeled glycans on a PGC column. The method was first evaluated using N-glycans derived from bovine serum fetuin, by dividing purified N-glycans into six equal aliquots and labeling with TMT reagents, including aminoxyTMT6–126 to aminoxyTMT6–131 (Figure 6.I). Extracted ion chromatograms of precursor ions exhibited good separation of all fetuin sialylated N-glycans. Moreover, TMT-labeled glycans appeared in the MS spectrum, and all six reporter ions relating to biantennary disialylated glycans were identified in the MS2 spectrum, indicating the reliability of utilizing the reporter ion for relative quantitation (Figure 6.II). Introducing sodium adducts solved the issue of low reporter ion yield (especially for higher molecular weight glycans), by improving energy transfer efficiency in sodiated precursor ions. The strategy was further applied to the glycomic profiling of N-glycans released from blood serum samples of healthy adults and patients with different esophageal diseases, confirming the methods applicability for the simultaneous analysis of six different complex biological samples containing more than 40 different glycans in one run.
Figure 6.

(I) Summary of aminoxyTMT sample preparation steps. (II) (a) Extracted ion chromatograms of precursor ions for all six glycan structures in fetuin from bovine serum. (b) MS spectrum for the biantennary disialylated glycan. (c) MS2 spectrum of the biantennary disialylated glycan. Reprint with permission from Ref [45]
Glycan reductive isotope-coded amino acid labeling (GRIAL) was used for MS analysis of N-glycans, where the reducing end of the N-glycan was labeled with isotope-coded arginine (Arg(13C6)) [46]. The results showed the GRIAL strategy as an effective method for enhancement of ionization efficiency (3.6–5.5 fold). Moreover, due to the proton affinity of arginine, Y-type ions were preferably formed during fragmentation, resulting in tandem mass spectra of labeled N-glycans with simplified fragmentation patterns which facilitated the discrimination of glycan isomers. Furthermore, in comparison with enzymatic 18O labeling, a larger mass difference (6 Da) was obtained, minimizing inaccurate glycan quantitation due to isotopic interferences. Good linearity (R2> 0.99) and reproducibility (CV< 18.1%) were obtained for the reported strategy.
An efficient approach based on stable cationic isotope labeling with either nondeuterated or deuterated Girard’s reagent, P (1-(2-hydrazino-2-oxoethyl)pyridinium), for the quick and sensitive relative quantitation of reducing glycans was reported by Wang et al. [47]. Reducing glycans were efficiently labeled based on the hydrazone formation reaction under nonreductive conditions without any metal salts introduced. The derivatized glycans exhibited only [M]+ type molecular ion signals in MS profiles, which greatly simplified the interpretation of glycan MS data. Reaction conditions for isotopic labeling were optimized, a reaction temperature of 70 °C, a reaction time of 3 h, and a molar ratio of glycan to labeling reagent of 1:2 were found to be optimal. The linearity, reproducibility, and accuracy of the method were also verified using N-glycans released from ribonuclease B and chicken ovalbumin.
2.3.4. Isotopic labeling of glycopeptides
In general, determination of glycosylation site occupancy of a glycoprotein has been done using PNGase F to release glycan from protein and comparing the abundance of peptide fragments that contain aspartic acid versus those that contain non-glycosylated asparagine. However, spontaneous chemical deamidation of the non-glycosylated asparagines can lead to inaccurate quantitation in measuring the site occupancy. To overcome this limitation, a new method was reported to measure the glycosylation site occupancy by spiking two sets of heavy isotope-labeled peptide internal standards into the glycoprotein sample prior to trypsin digestion [48]. The total protein concentration and the non-glycosylated portion of the protein were determined simultaneously by relative quantitation versus normal and non-glycosylated labeled peptide standards, respectively, and the extent of site occupancy was subsequently determined. No glycosidase was used; therefore, the reported approach was free from quantification inaccuracies encountered when using the PNGase F method. To compare the new method with the traditional approach, the site occupancy of fetuin were determined, using the standard protocol of adding PNGase F to deglycosylate protein before trypsin digestion. In comparison to the approach using labeled internal standards, the PNGase F method estimated higher site occupancy; this was caused by the spontaneous deamidation of non-glycosylated peptides which was incorrectly assigned as deglycosylated peptides generated from the PNGase F reaction.
A quantitative proteomic approach to identifying N-linked glycoproteins using isotope-coded carbamidomethylation (iCCM), with iodoacetamide (IAA) or its isotope (IAA-13C2,D2), combined with an online microbore hollow fiber enzyme reactor and nanoflow liquid chromatography-tandem mass spectrometry (mHFER-nLC-MS/MS) was reported [49]. Proteolysis was carried out by the mixing of light-/heavy-labeled glycoprotein samples; followed by online enrichment of N-glycopeptides using lectin affinity on mHFER before nLC-MS/MS analysis. When the mixture was loaded onto the mHF, peptides unbound to lectins passed through the pores of the mHF membrane and were quantified by MS analysis. Then, lectin bonded glycopeptides were released using PNGase F and deglycosylated peptides eluted from the wall of the mHF were measured in sequence to determine the relative ratio of carbamidomethylation (CM)-/iCCM-labeled peptides using a multiple reaction monitoring (MRM) method. The approach was evaluated by successful quantification of three standard glycoproteins (α-1 acid glycoproteins, fetuin, and transferrin) and serum glycoproteins from liver cancer patients and controls.
3. Advancements in glycan and glycoprotein profiling by MS(/MS)
Several quantitation strategies for glycomics and glycoproteomics, which permit reliable and sensitive monitoring of glycan changes and peptide sequences correlated to different biological conditions and diseases, have been developed. This review aims to evaluate and discuss the developed strategies recently employed in glycomics and glycoproteomics.
3.1. Advancements in MS-based glycomics
Mass spectrometry imaging (MSI) has been utilized for the spatially resolved profiling of proteins, lipids, small molecule metabolites, and drugs from tissue sections. Owing to the high sensitivity and specificity of mass spectrometric analysis, a number of challenges encountered during conventional immunostaining have been overcome by MSI. Eshghi et al. [50] reported a new approach to direct MSI analysis of N-glycans from formalin-fixed paraffin-embedded (FFPE) tissues. The process consists of sectioning FFPE tissues, immobilization of tissue sections on glass slides, deparaffinization and rehydration of the sections in xylene and ethanol solutions, respectively, denaturing tissue proteins in dithiothreitol buffer, releasing N-linked glycans from proteins by printing PNGase F over the sections, spray-coating the tissue with matrix and analyzing N-glycans by MALDI-MSI (Figure 7). The MSI data were used to investigate the relative abundance of oligomannose, non-fucosylated, and fucosylated complex N-glycans in a variety of brain areas and the results demonstrated that oligomannose and nonfucosylated complex N-glycans were more abundant in the brainstem, while isocortex and the hippocampal formations were richer with fucosylated N-glycans.
Figure 7.

(I) Illustration of mass spectrometry imaging of N-linked glycans from FFPE mouse brain tissue. (II) MALDI-MS analysis of N-glycans released by PNGase F from FFPE tissue section. (a) PNGase F negative and (b) PNGase F positive. Reprint with permission from Ref [50]
The efficacy of using MALDI-MSI glycan profiling to distinguish tumor from non-tumor tissues in a tumor microarray format (TMA) was also demonstrated [51]. The technique increased the number of tumor samples it is possible to analyze in one experiment. The comparative analysis of glycans detected in a TMA core versus source FFPE tissue was also enabled by the method. Commercially available hepatocellular carcinoma TMA consisting of samples from 16 individual patients, with two tumor tissue cores and one non-tumor tissue core per patient, were analyzed and the majority of glycans detected were found to occur at increased levels relative to non-tumor tissue.
Recently, matrix-free methods based on soft laser desorption ionization (LDI)-MS have been developed to improve sensitivity and the detection limit of glycan analysis. In this regard, sample plates for LDI-MS of small biomolecules up to a mass range of around 1500 Da were designed by employing weathering steel [52]. High quality performance in LDI-MS was determined by effective UV absorption over the entire UV/Vis spectrum, porosity and the heat conductivity of the nanostructured inner rust layer formed during passivation. Matrix-free detection of serum metabolites, milk lipid analysis, lactose quantification, glycoprofiling of antibodies and imaging mass spectrometry of brain tissues were successfully evaluated. The results indicated that the weathering steel sample plate has the highest S/N ratio of all surfaces tested with a nearly 4.5 fold gain in sensitivity over standard sample plates at considerably lower laser fluence.
Improvements in structural characterization and sequencing of glycans can be achieved by prominent glycan cross-ring fragmentation with the use of a MALDI-ISD (In-source decay) technique. Gluthathione-capped iron oxide nanoparticles were demonstrated as an effective matrix for the analysis of glycans by MALDI-MS [53]. Compared to the traditional organic matrix, the proposed matrix provides much cleaner mass spectral background in the low m/z region with efficient ISD fragmentation, indicating that the matrix provides strong energy transfer to analytes. Linear, branched, and cyclic glycans were found to undergo abundant glycosidic and cross-ring cleavages by ISD. The authors demonstrated that, sodium ions, that are present in the electric double layer of the negatively charged nanoparticles, can act as a salt bridge between the nanoparticle capping molecules and glycans, facilitating glycan particle surface adherence and thus efficient energy transfer.
An integrated strategy of combining of mass spectrometry, lectin and glycogene microarray analysis was applied for profiling the altered expression of N-glycans and their related glycogenes during TGFβ-induced EMT (epithelial-to-mesenchymal transition) in a normal mouse mammary gland epithelial cell model [54]. EMT is a vital biological process that occurs in embryonic development, metastatic diseases, and cancer progression. In the reported approach, PNGase F released N-glycans were analyzed by MALDI-TOF–MS, followed by analysis of mRNA levels of glycan related genes using glycogene microarrays. Further, altered N-glycans on glycoproteins were analyzed using lectin microarrays. The results showed that, in TGFβ-induced EMT, the levels of high-mannose-type N-glycans were enhanced, and levels of antennary and fucosylated N-glycans were suppressed.
3.2. Advancements in MS-based glycomics in conjunction with separation techniques
Effective characterization of glycans demands the use of a separation technique. This is prompted by the high complexity of glycan samples consisting of many compositional and linkage isomers. Generally, a separation technique is also needed to enhance sensitivity by reducing the number of species that endure simultaneous ionization. Several separation techniques have been utilized to improve MS-based analysis of glycans, including ion mobility (IM), capillary electrophoresis (CE) and liquid chromatography (LC).
3.2.1. Ion mobility-Mass spectrometry
Ion mobility-mass spectrometry (IMS) is an effective analytical technique in isomeric glycan separation that measures the mobility of gas-phase ions under the influence of an electric field in the presence of a buffer gas. Ions are separated on the basis of their mobility in a conventional drift-tube (DT)-IMS. The recent development of trapped ion mobility spectrometry (TIMS) provides a promising new tool that offers high mobility resolution and compatibility with high-performance Fourier transform ion cyclotron resonance (FTICR) mass spectrometers. A combination of selected accumulation-TIMS (SA-TIMS) and FTICR MS was reported by Pu et al. to provide an analytical platform for generating IMS-mass spectra with high mass resolution and accuracy [55]. The SA-TIMS -FTICR MS approach showed great potential in identification of isomeric glycans. In a separate study, the nature of both reducing and non-reducing glycans of a series of epimeric disaccharides and branched pentasaccharide glycans were determined using ion-mobility mass spectrometry the following fragmentation by CID. These data demonstrated that this technique may prove useful for the sequencing of complex oligosaccharides [56].
Further, a simple method has been developed for the analysis of non-derivatized glycans using a reverse phase column on a liquid chromatography-ion mobility-mass spectrometry (LC-IM-MS) instrument [57]. The method was optimized to fractionate both proteins and non-derivatized glycans on the same reverse-phase column, which supported both glycomics and proteomics without the necessity of switching columns. The results also showed that, peak capacity and separation of non-derivatized glycans improved by combining reverse phase LC and IM-MS.
3.2.2. Capillary electrophoresis-Mass spectrometry
Capillary electrophoresis is a powerful tool for glycan separation owing to its high sensitivity and speed, as well as its superior peak capacity and isomer resolution. Therefore, the coupling of CE to MS is a powerful analytical approach, allowing potentially comprehensive and sensitive analysis of complex glycan samples. Recently, improvements in glycan separation efficiency and detection were achieved with the use of a double-layer poly (vinyl alcohol)-coated capillary column [58]. A more stable, homogeneous and compact PVA film provided better separation processes.
Guttman and coworkers [59] investigated the effect of separation temperature on the migration behavior of linear (maltooligosaccharides) and branched (sialylated, neutral, and core fucosylated biantennary IgG glycans) carbohydrates using capillary electrophoresis in the temperature range of 20–50 °C. The activation energy values (derived from the slopes of the Arrhenius plots of logarithmic electrophoretic mobility vs reciprocal absolute temperature) were used to understand the electrophoretic mobility shifts between the different structures at different temperatures. The results confirmed, although the migration times of both structural groups significantly decreased with the increase of the temperature, that branched and linear structures could be differentiated based on their relative migration times. The branched glycans migrated much faster than their corresponding maltooligosaccharides at a higher temperature. This study emphasizes that temperature should be carefully controlled during glycosylation analysis by capillary electrophoresis.
3.2.3. High performance liquid chromatography- Mass spectrometry
Mass spectrometry in conjugation with high performance liquid chromatography based on different separation methods such as HILIC, reversed-phase LC (RPLC), graphitized carbon LC and ion pairing chromatography has become a prevailing tool in glycomic analyses during the past two decades.
3.2.3a. PGC-LC-MS
Porous graphitized carbon has been widely used for glycan profiling, especially in isomeric separation studies. PGC has higher separation efficiency, in comparison to RPLC and HILIC, due to its retention mechanism, including hydrophobic and ionic interactions with analyte molecules.
A microfluidic PGC chip-LC/MS-based approach has been developed for comprehensive profiling of N-glycans in the rat, mouse and human sera [60]. The resolution and sensitivity increased in comparison with routine HPLC and UHPLC techniques, because of reduced flow rates, minimized dead volume, and lower peak dispersion. Also, improvement in detection of sialylated N-glycans, especially multi-sialylated N-glycans was achieved by applying higher pH and a high ionic strength mobile phase instead of a routine chromatographic mobile phase. This approach resulted in the detection of 282 N-glycans, including 27 novel N-glycans, in rat serum with enhanced glycan isomeric separation. Comparisons between rat, mouse, and human serum glycomes revealed that the rat glycome is more similar to that of human sera than to that of mouse sera according to the sialylation, fucosylation, and the degree of branching patterns.
3.2.3b. RPLC-MS
Selected reaction monitoring (SRM) and MRM are among the most reliable MS quantitation methods. In these methods, quantitation is based on ion transitions instead of using full MS scans, which improves detection sensitivity by reducing chemical background noise and results in the identification of low abundance glycans. A new strategy has been developed for quantitation of methylated N-linked glycans based on MRM using a triple quadrupole mass spectrometer instrument [61]. The number of transitions (three transitions) and normalized collision energy (35% for high mannose and complex type and 30% for sialylated and fucosylated N-glycans) were optimized to obtain effective and reliable MRM quantitation. A total of 88 N-glycans were quantified in human blood serum with high sensitivity and reasonable concentration dynamic range.
Complete glycan identification of an IgG1 mAb and a glycosylated IgG1 fusion protein was reported based on oligosaccharide profiling, using top- and middle-down analyses with FT-ICR or HPLC-ESI MS analysis combined with multiple fragmentation techniques (ETD, ECD, and ISD) [62]. Compared to conventional bottom-up analysis, complementary information regarding glycosylation sites and peptide sequences were obtained. Several features were obtained by top-down analysis including detection of heterogeneous glycosylated protein species of intact proteins at high mass accuracy, quantitation of the relative abundance of protein species and the validation of protein structural information. In combination with MALDI-ISD, middle-down analysis confirmed conversion of the N-terminal Glutamine to Pyroglutamate for the mAb and C-terminal truncations in both mAb and the fusion proteins and also improved peptide sequence coverage.
The distribution of glycans is heterogeneous between different tissue regions, therefore, targeting small areas may be promising for both glycomics and glycoproteomics studies. A reliable workflow for the analysis of multiple glycan classes and proteins on single tissue spots was demonstrated by Turiak et al [63]. Digestion times were first optimized for individual compounds by applying standards on the tissue using microwave irradiation. Then, a multi-enzyme protocol was developed for consecutive digestion of glycosaminoglycans, N-glycans and proteins, on 1.5 mm diameter tissue surface areas, of both fresh frozen and formalin-fixed mouse liver and brain sections for subsequent LC-MS analysis. In summary, hyaluronidase and chondroitinase ABC enzymes were added on predetermined spots of tissue slides to digest glycosaminoglycans. The resulting disaccharides were extracted manually using a ammonium hydroxide solution, water and 10% acetic acid, respectively, and the slides were dried at 55 °C for 5 min. Trypsin and PNGase F enzyme solutions were also used in sequence, respectively, and the resulting peptides and N-glycans were extracted in the same way. Adding 10% glycerol to each reaction solution minimized dispersion by improving the surface tension of the droplets. The reliability of the method was confirmed by comparing the obtained data, from the 1.5 mm diameter tissue surface area spots, with data from the analysis of bulk mouse liver and brain tissues.
3.2.3c. HILIC-MS
HILIC utilizes a hydrophilic stationary phase and a polar organic solvent such as acetonitrile mixed in some proportion with water and low concentrations of acid or volatile salts, consequently, this mode of chromatography is well-suited for ESI-MS interfacing. The determination and quantification of soluble milk glycans and their precursors using HILIC-MS/MS in serum samples were successfully performed on an amide column, using an acetonitrile-water gradient with ammonia as an additive and triple quadrupole mass spectrometric detection in negative electrospray ionization mode [64]. Also, quantitative analysis of the neutral N-glycans released from bovine and porcine IgG, as well as of those from mouse and rat sera, was reported by relative quantitation of isotopically labeled glycans using HILIC-ESI-MS/MS [47]. Further, glycan profiling of human serum samples was achieved by analysis of procainamide and hydrazine labeled glycans using HILIC columns [64–65].
An efficient method for the enrichment and profiling of influenza A virus glycopeptides has been developed using a HILIC trapping column online, prior to a C18 analytical column [66]. It was observed that the glycopeptides were the most abundant ions in the data sets and were, therefore, preferentially selected for tandem mass analysis. Significantly; a higher number of glycopeptide matches were observed, using HILIC-C18 LC–MS data, over those obtained using a RPLC-chip that had C18 packing material in both enrichment and analytical columns.
3.3. Advancements in MS-based glycoproteomics
3.3.1. Glycoproteins analysis by IMS-MS
A hybrid technique for the enrichment and comprehensive identification of site heterogeneity and structural diversity of glycopeptides was reported using lectin affinity chromatography (LAC) combined with a high-resolution Orbitrap mass spectrometer as well as IMS-MS [65]. A high degree of glycopeptide site heterogeneity was revealed by IMS-MS analysis, enabling confident assignment of glycopeptides. Also, interpretation of the IMS distributions of the glycopeptides confirmed more structures could be resolved by increasing charge state. Furthermore, discrimination of isomeric glycans improved by using the IMS-CID-MS platform, which resulted in a total of 117 glycopeptides having 27 glycan forms being identified using a model glycoprotein derived from chicken ovomucoid.
A rapid approach for the discrimination of α2,3 and α2,6 NeuAc linkages in N-glycopeptides using IMS-MS, without any additional sample preparation steps and with significantly improved separation of isomeric glycopeptides, was reported by Hinneburg et al. Two isomeric forms of α-1 proteinase inhibitor, produced in different cell types, were successfully differentiated by tandem IMS-MS experiments, which illustrated the robustness of the method (Figure 8) [67].
Figure 8.
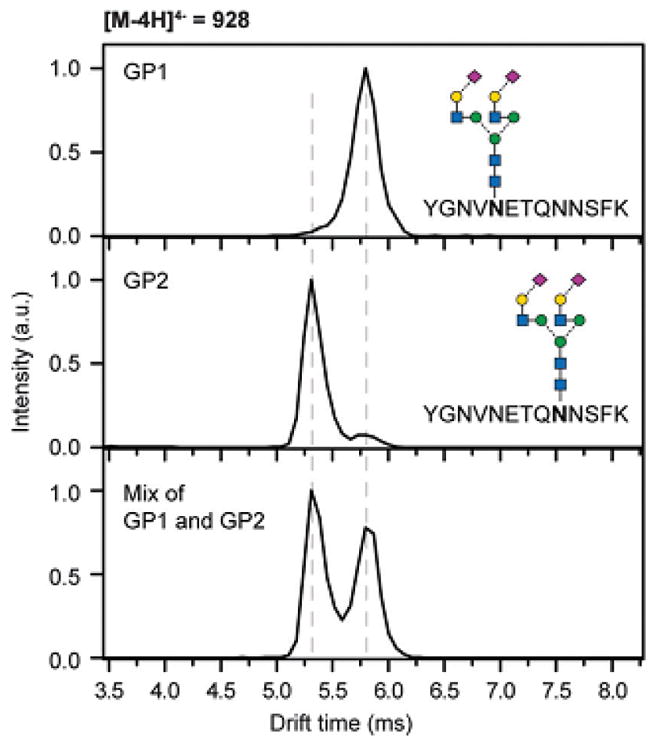
IM-MS separation of the isobaric glycopeptides GP1 and GP2, which can be distinguished based on their drift time (top and middle) and separated in mixtures (bottom). Reprint with permission from Ref [67]
3.3.2. Glycoproteins analysis by CE-MS
To improve the separation and detection of human transferrin glycoforms by CE-TOF-MS, a modified method was developed by eliminating undesirable interferences, caused by surfactant, with a desalting procedure using μElution plates. Suppression of the desialylation of glycopeptide glycoforms was also achieved using 5% of HF, for 30 min at 37ºC, as the optimum conditions to hydrolyze residual surfactant [68]. The methodology was further confirmed following the successful analysis of human transferrin glycopeptides in serum samples from a healthy control and patients with congenital disorders of glycosylation.
3.3.3. Glycoprotein analysis by LC-MS
A comprehensive analysis of IgG1 glycopeptides has been done by C18-ESI-LC-MS/MS over a wide range of HCD collision energies using both one and two dimensional (1D and 2D) LC separations [69]. A total of 247 glycopeptide ions with 60 glycan structures were confirmed by the 2D studies, where 30 different glycan compositions were determined from 195 glycopeptide ions in the 1D runs. Improvement in separation of sialylated vs asialylated species in the first (high pH) dimension and the ability to inject large amounts of glycosylated peptides, resulted in identification of a larger number of glycans in 2D studies. Also, energy dependent changes in HCD fragmentation confirmed the proposed glycan structures, with asialylated, biantennary core fucosylated complex glycans as the predominant group.
To improve the identification of core-fucosylation (CF) sites in the serum of pancreatic cancer patients, a protocol was optimized using Lens culinaris Agglutinin enrichment and confirmed by characterization of CF glycopeptide sites in 13 sets of serum samples from pancreatic cancer, chronic pancreatitis, healthy controls, and a standard reference [70]. Improvement in the enrichment of CF proteins was obtained by using an optimized elution buffer. Two elution steps were applied to maximize CF elution efficiency, first using regular elution buffer and then by buffer without NaCl and the divalent cations Ca2+ and Mn2+ to decrease lectin affinity. A total of 630 CF sites were identified among 322 CF proteins in pancreatic cancer patient serum using nanoLC–MS/MS analysis, and 8 CF peptides were found to distinguish pancreatic cancer from other controls or chronic pancreatitis.
To study posttranslational modifications in mouse and human collagen IV, Vanacore et al. have employed an optimized bioinformatics workflow combined with high-resolution mass spectrometry using different fragmentation techniques [71]. The new strategy significantly improved identification of both sequence coverage and the number of posttranslational modifications. The results showed that HCD fragmentation was superior at detecting collagen IV glycopeptides as it identified 75% and 82% of the hydroxylation and O-glycosylation sites and 33% of unique amino acid sequences. ETD and CID contributed to identifying about 6% and 4% of non-overlapping amino acid residues and 55% and 41% of hydroxylation and O-glycosylation sites.
An effective strategy has been developed for qualitative site-specific N- and O-glycosylation analysis of pronase treated glycoproteins, in one sample run using an integrated sequential C18-PGC-LC approach coupled to high resolution ESI-QTOF-MS/MS, for the elucidation of both glycan and peptide moieties [72]. Briefly, a two valve nanoUPLC system was used, valve 1 and 2, which were equipped with C18 and PGC precolumns, respectively, also were connected to analytical columns. In the loading position, both precolumns were connected, allowing the loading of the sample (20–50 ng protein digest) onto the C18 precolumn with the flow-through passing directly onto the PGC precolumn. After a switching of valves, the samples were eluted consecutively from the two precolumns over their corresponding analytical columns and directed to the mass spectrometer for detection. The method allowed glycopeptide analysis with minimal sample handling and low sample consumption. The performance of the approach was evaluated by comprehensive glycosylation analysis of several mammalian glycoproteins containing both N- and O-glycosylation, including human IgG3.
3.3.4. Intact glycoproteins analysis
Mass spectrometric analysis of intact proteins is capable of being a very powerful tool in the characterization of proteins, including post-translational modifications. However, it has rarely been used due to the complicated interpretation of spectra required, sample impurities, instability of proteins, multiple sites of modification and multiple peaks of a single molecule. Meyer et al. demonstrated that glycan compositions can be determined directly by C8-LC-ESI/TOF-MS from intact glycoproteins even with a complex glycosylation pattern [73]. Glycan compositions of 38 glycoforms were determined by interpretation of isotopically resolved mass spectra of prostate specific antigen (PSA) using bioinformatics tools. The MATLAB script was designed to calculate theoretical isotope distributions for each manually assigned glycan species of a glycoprotein.
Characterization of intact antibody drug conjugates (ADCs) was demonstrated using microfluidic CE-ESI with online MS analysis [74]. ADCs are mAbs decorated with highly effective small molecule drugs that generally have anti-tumor activity. Having CE separation prior to MS analysis, charge variants of mAbs and ADCs can be separated and introduced directly into the mass spectrometer. Although some minor glycoforms (less than 0.15% of total population) are not resolved in the mass domain, the reported method was able to detect aglyco isoforms of the mAb, with the informative data being obtained with minimal sample preparation. The average drug-to-antibody ratios and their distribution were also determined based on the resulting electropherogram.
Bispecific antibodies (bsAbs) are antibodies, composed of two different half-antibody arms which recognize two distinct targets that have recently attracted attention in the field of protein therapeutics. However, covalent and non-covalent knob homodimers in bsAb are undesired products, and it has been challenging to separate and quantify homodimers because these species and bsAbs often have similar physicochemical properties. An efficient strategy for unbiased quantitation of homodimers in bsAbs was introduced based on a standard addition approach using, knob hAbs (half antibodies) as a surrogate for the non-covalent knob homodimer, by chip-based-RPLC-TOF-MS analysis [75]. The method demonstrated accurate and reproducible quantitation of homodimers resulting in precise quantitation of intact antibodies (Figure 9).
Figure 9.

(a) Quantitation of intact recombinant antibody product variants using standard addition approach by mass spectrometry. (b) Representative figures for MS data extraction, deconvolution, and normalization. Reprint with permission from Ref [75]
Fragmentation of RNase A and B by top-down approaches, using both vibrational (CID/IRMPD) and radical activation (ECD, ETD) with/without a pre-or post-activation event, to explore peptide sequence information, glycan structure and glycosylation sites were investigated by Bourgoin-Voillard and coworkers [76]. Their results showed that extensive sequence coverage was obtained with radical activation modes (58–65%), compared to vibrational activation modes (12–23%), and using CID pre-activation prior ETD or ECD resulted in a slight improvement (62–69%). Comparison of fragmentation patterns confirmed that the presence of glycan chains increased the gas phase stability of analytes, and preferential fragmentation occurred around glycosylation sites.
A complete posttranslational modification mapping of the protein PilE, purified from a uncharacterized strain of Neisseria meningitidis isolated from a patient hospitalized, was performed using top-down and bottom-up MS methods [77]. Mass profiling of PilE confirmed the presence of four major proteoforms, differing only by the number of 2,4-diacetamido 2,4,6-trideoxy α-D-hexose (DATDH) glycans. Information obtained from the bottom-up approach proved only capable of characterizing the PTM content of the lightest and heaviest proteoforms, but not those of intermediate mass. Complete assignment of all glycosylation sites was obtained by selecting individual proteoforms and subjecting them to top-down ECD MS/MS on a 12T FT-ICR mass spectrometer.
4. Advancements in the development of Bioinformatics tools for MS glycoproteomics
Proteomics experiments are moving away from single protein identification and moving towards global proteome analysis. Modern mass spectrometers have reached a point where data generation is no longer the rate limiting step in proteomics experiments; data for whole cell lysates are routinely acquired. Data analysis remains a time consuming endeavor that would be an enormous if not impossible undertaking without the help of various bioinformatics tools. The software available for proteomics researchers is robust and widely available making targeted proteomics studies possible [78].
Glycoproteomics studies are different from routine proteomics studies in that the glycan cannot be treated as a simple modification like phosphorylation, acetylation, methylation, etc… The variance of glycans is enormous, requires a different approach. Glycoproteomics studies are generally aimed at identifying the microheterogeneity of glycan(s) present on a glycopeptide, identifying the peptide sequence and ultimately glycoprotein identity, and quantitating the glycan and glycoprotein. CID is the most common technique for fragmenting peptides in a bottom-up proteomics approach but it does not work well with glycopeptides; CID fragments the glycan while leaving the peptide predominantly intact. This has been overcome by using a combination of ETD and CID; CID yields glycan product ions while ETD selectively yields peptide product ions [79].
The glycoproteomic bioinformatics field is in its infancy when compared to the well established proteomics field. The difficulty in glycoproteomics analysis is accurate glycan identification in addition to accurate peptide identification. Some glycopeptides have the same peptide backbone but different glycans attached; the more similar the glycans, the more likely they are to co-elute. Nevertheless, robust tools, encompassing different strategies, have been developed for various glycoproteomic studies. It should be noted that all results, especially the most important results, should be validated manually; this is also the case with proteomics software. Some of the automated validation includes searching against a decoy database. To keep in line with the rest of this review article, software programs specifically aimed at analyzing glycopeptides from the past two years were reviewed. An overview of the different bioinformatics tools that have been recently used in glycomics and glycoproteomics studies are shown in Table 2.
Table 2.
Bioinformatics tools for glycoproteomics
| Bioinformatics tool | Analyzed Species | Sample(s) | Accessible | Ref. |
|---|---|---|---|---|
| GlycoMaster DB | N-glycopeptides | Ribonuclease B, human serum IgG, human urine | http://www.novo.cs.uwaterloo.ca:8080/GlycoMasterDB | [80] |
| Automated algorithm based on ArMone | N-glycopeptides | Human embryonic kidney cell line | N/A | [81] |
| GlycoPep Evaluator | N-glycopeptides | Bovine fetuin, RNase B, human serum IgG | https://desairegroup.ku.edu/research | [82] |
| GlycoMID | O-glycopeptides | Bovine collagen α-(II) chain protein | http://proteomics.informatics.iupui.edu/software/glycomid/ | [83] |
| GlycoSeq | N-glycopeptides | Human breast cancer cells | https://github.com/chpaul/GlycoSeq/ | [84] |
| LaCyTools | N-glycopeptides | α1-antitrypsin, human serum IgG | https://github.com/Tarskin/LaCyTools | [85] |
| MassyTools | N-glycans and N-glycopeptides | Human serum IgG | https://github.com/Tarskin/MassyTools | [86] |
| Integrated GlycoProteome Analyzer (I-GPA) | N-glycopeptides | RNase B, human serum IgG, human plasma | N/A | [87] |
| GPQuest | N-linked glycopeptides | Prostate tumor LNCaP cells | N/A | [88] |
| SweetNET | N-, O-, CS-glycopeptides | Human urine, Human CSF | Molecular networks: http://gnps.ucsd.edu/ | [89] |
N/A: not available.
He et al. developed Glycomaster DB to analyze glycopeptides extracted from the human urinary proteome and fragmented with both HCD and ETD [80]. They were able to identify multiple N-linked glycan forms on the same glycosylation site but were not able to determine any O-linked glycopeptides. On the other hand, Cheng et al. utilized their own program to identify 2200+ unique N-glycopeptides assigned to 1700+ site specific N-glycans on 450+ glycosylation sites in HEK 293T cells [81]. Their low false-discovery rate (FDR) indicates a robust identification algorithm for the glycopeptide.
Zhu et al. developed GlycoPep Evaluator (GPE) to improve upon existing FDR approaches. GPE generates decoy glycopeptides de novo for every target peptide [82]. Zhang et al. developed GlycoMID for the specific task of identifying O-linked glycosylations in which Gal or Glc-Gal are attached to hydroxylysine residues commonly found in collagen; this type of glycopeptide is not commonly identified with most software packages [83]. The authors proceeded to identify more glycopeptides in collagen, including two glycosylation sites than had been previously discovered.
GlycoSeq was implemented to determine glycopeptides derived from two breast cancer cell lines [84]. The software program utilizes a heuristic iterated glycan sequencing algorithm coupled to biological glycosidic linkage information to identify glycans readily.
Jansen et al. created LaCytools to improve glycopeptide identification in therapeutic monoclonal antibodies [85]. A focus on quality control measurements including signal-to-noise, isotope pattern quality, and mass accuracy resulted in a powerful software suite. Jansen developed MassyTools to improve glycopeptide data generated from MALDI-MS. This resulted in improved calibration and quantitation over existing software [86].
Park et al. developed a robust software package, Integrated GlycoProteome Analyzer (I-GPA), to analyze and map N-glycoproteomes [87]. Their method identified 600+ N-glycopeptides and quantified ~600 N-glycopeptides from human plasma with an astonishing 0% false positive discovery rate; which was manually verified.
Eshghi et al. developed the GPQuest algorithm for identifying intact glycopeptides [88]. They utilized HCD to fragment the glycopeptides followed by a search against a spectral library of glycosite-containing peptides; only spectra with the diagnostic glycopeptide oxonium ion were considered. They were able to identify 769 unique N-linked glycopeptides which corresponded to over 344 N-liked glycosylation sites with over 57 different N-glycans derived from prostate tumor LNCaP cells.
Nasir et al. developed SweetNET to specifically identify sialyated glycopeptides and chondroitin sulfate (CS) linkage region glycopeptides [89]. They incorporated molecular networking to cluster similar MS/MS spectra, oxonium ion intensity profiles, and precursor ion m/z shift distributions to classify N-, O- and CS-linked glycopeptides before database searching. Previously published datasets on human urine and cerebral spinal fluid were analyzed with SweetNET. This increased the spectra identification and assignment from 10 to 30% of spectra with the unidentified spectra attributed to various adducts.
5. New glycomics and glycoproteomics biomedical applications
Much research has been conducted in the interest of understanding the various biological roles of glycoproteins, which include cell signaling, adhesion, and communication, among other things. A correlation between changes in glycan moieties and the pathogenesis of many mammalian diseases, including hereditary disorders, immune deficiencies, cardiovascular disease, and cancer has fostered a continuing interest in the elucidation of their biofunctions. To this end, the development of methods for the sensitive monitoring of glycans and glycoproteins in biological samples is an ongoing field of study. Table 3 gives an overview of the different biological samples that have been recently used in glycomic and glycoproteomic studies. Selected examples of these biological applications are highlighted next.
Table 3.
A number of biological samples that have been recently used in glycomics and glycoproteomics studies.
| Analyzed Species | Sample (s) | MS technique(s) | Ref. | |
|---|---|---|---|---|
| Glycan | Human serums from throat cancer patients | LC–MS/MS-MRM mode | [100] | |
| Glycan | Human serums from gastric cancer patients | LC-MS/MS-CID | [99] | |
| Glycan | Human IgG and Bovine fetuin | HILIC-Fluorescence-MS/MS-CID | [18] | |
| Glycan | Human blood serum and Fetuin | LC-MS/MS-CID | [33] | |
| Glycan | Human blood serum and Fetuin | LC–MS/MS-MRM mode | [61] | |
| Glycan | Human embryonic kidney 293 (HEK 293) cells | MALDI-TOF-MS | [26] | |
| Glycan | Human serum and Chicken avidin | LC-MS | [40] | |
| Glycan | Rat and Human serums | LC-MS/MS-CID | [60] | |
| Glycan | Mouse brain tissue | MALDI-MSI | [50] | |
| Glycan | Mouse kidneys tissue | MALDI-MSI | [51] | |
| Glycan | Bovine and porcine IgG, Rat and mouse serums | LC-MS/MS-CID | [47] | |
| Glycan | Bovine and goat milk | LC-MS/MS-CID | [32] | |
| Glycan/Glycopeptide | Human serums from healthy adults and liver cancer patients | LC-MS/MS-CID/HCD | [49] | |
| Glycan/Glycopeptide | Prostate specific antigen (PSA) | LC-MS/MS-CID/HCD/ETD | [95] | |
| Glycan/Glycopeptide | Human fetal lung fibroblasts | LC-MS/MS-CID | [93] | |
| Glycan/Glycopeptide | Influenza A Virus | LC-MS/MS-CID/HCD and MALDI-TOF | [102, 130] | |
| Glycopeptide | Human serums from pancreatic cancer patients | LC-MS/MS-HCD | [70] | |
| Glycopeptide | Human serums from cirrhosis (CIR) and HCC patients | LC–MS/MS-MRM mode | [94] | |
| Glycopeptide | Human serums from healthy adults and HCC patients | LC-MS/MS-CID/HCD | [101] | |
| Glycopeptide | Prostate specific antigen (PSA) | LC-MS/MS-CID/HCD | [98] | |
| Glycopeptide | Human cerebrospinal fluid (CSF) and Urine | LC-MS/MS-CID/HCD | [131] | |
| Glycopeptide | Donkey milk | LC-MS/MS-CID/HCD MALDI-TOF/TOF | [90] | |
| Glycopeptide | Streptococcus agalactiae | LC-MS/MS-CID/HCD/ETD | [97] | |
| Glycopeptide | Hen egg | LC-MS/MS-CID | [92] | |
| Glycoprotein | Human blood plasma from healthy adults | LC-ESI-MS | [96] | |
| Glycoprotein | Prostate specific antigen (PSA) | LC-MS/MS-CID | [73] | |
The primary structure and glycosylation sites of donkey lactoferrin were characterized by means of multiple enzyme digestions, cationic exchange purification, sulfophenyl isothiocyanate derivatization, and RPLC-ESI-MS/MALDI-MS, using CID/HCD for glycan and peptide ion fragmentation [90]. The results showed that, compared to the horse homolog, donkey lactoferrin presents five amino acid point substitutions, with the identification of asparagine residues located at the positions 137, 281 and 476 as glycosylation sites of donkey lactoferrin.
N- and O-linked glycosylation of cytotoxic T-lymphocyte-associated antigen (CTLA4-Ig) fusion protein was fully characterized by liquid chromatography coupled to fluorescence detection and mass spectrometry [91]. Peptide mapping, using an ETD fragmentation technique, determined 3 N- and 4 O-linked glycosylation sites on the peptides and demonstrated the similarity of the CTLA4-Ig fusion protein at the level of glycosylation patterns.
The glycosylation site of Ovomacroglobulin (OVMG) has been characterized using mass spectrometry and two-dimensional electrophoresis [92]. The molecular weight of the OVMG subunit was measured by MALDI-TOF MS and the mass of carbohydrate moieties was calculated as 11.5% of the whole OVMG molecule. Also, LC-ESI-MS/MS analysis identified 13 potential N-glycosylation sites with glycosylated/nonglycosylated forms at one site. Finally, 2-DE analysis of OVMG confirmed the heterogeneity of OVMG glycosylation occurred at both glycosylation sites and Glycan profiling on each occupied site.
Recently, Kawasaki et al. characterized the membrane glycoproteome of fetal lung fibroblasts by aceton enrichment of membrane glycopeptides using LC-LTQ-FT-MS/MS [93]. The glycoproteomic approach resulted in the recognition of over 272 glycoforms on 63 sites of 44 glycoproteins, with high-mannose and monosialo-fucosylated biantennary oligosaccharides as the predominant forms at the site of N-glycosylation.
Simultaneous quantification of immunoglobulins and site specific glycoforms of subclasses IgG1–4 in liver cirrhosis and HCC patients were investigated using optimized LC–MS–MRM, by the quantification of glycan oxonium and peptide-GlcNAc fragment ions [94]. Compared to healthy controls, HCC patients had increased levels of IgG1, IgG3, IgA1, and IgM, with a drastically higher concentration of IgG1 and IgM but a lower concentration of IgG2, in contrast to CIR patients. Also, the results confirmed a higher level of a-galactosylated core fucosylated glycoforms (in all IgG subclasses) and increased the degree of fucosylation (in IgG1 and IgG3) in CIR and HCC patients.
The identification and quantitation of a mutant glycosylation site (N102) of PSA were achieved for the first time, using C18-LC–MS analysis with different fragmentation methods (CID/HCD and ETD) [95]. The amino acid sequences and associated glycoforms of three different PSA samples were successfully investigated, and it was demonstrated that HexNAc2Hex5 is the primary glycoform at N102, whereas HexNAc4Hex5Fuc1NeuAc1 or HexNAc4Hex5Fuc1NeuAc2 is the predominant form at N69 (Figure 10).
Figure 10.

Examples of identified glycoforms at N102 glycosylation site using CID MS/MS and ETD MS/MS. The assignment of fragments of HexNAc2Hex5 on HSLFHPEDTGQVFQVSHSFPHPLYN102MSLLK with m/z value of 942.6390 in CID MS/MS (A) and ETD MS/MS (B). The assignment of fragments of HexNAc2Hex5 on HSLFHPEDTGQVFQVSHSFPHPLYN102MCAMSLLK with m/z value of 795.2017 in CID MS/MS (C) and in ETD MS/MS (D). The fragments indicating N102 glycosylation and the carbamidomethylation of methionine are highlighted in yellow. Reprint with permission from Ref [95]
Posttranslational modifications including; glycosylation, phosphorylation and sequence polymorphisms (SNPs) of human fibrinogen, which was isolated and separated into the Aα-, Bβ- and γ-subunits by reversed-phase high performance liquid chromatography, were identified simultaneously by top-down mass spectrometry [96]. Two coding single nucleotide polymorphisms on the Aα- and Bβ-subunit were recognized, indicating both heterogeneous and homogeneous sites. Phosphorylated and O-glycosylated Aα-subunit and N-glycosylated Bβ and γ-subunit, were also identified.
Comprehensive analysis of Serine-rich (Srr1) glycosylation of Streptococcus agalactiae was reported using lectin affinity chromatography, to enrich Srr1, and nanoLC-tandem MS analyzer coupling to different fragmentation techniques (CID, HCD and ETD) [97]. 27 glycopeptides corresponding to six different segments of the N-terminal region of Srr1 were identified. The results demonstrated that Srr1 was modified by O-acetylated–N-acetylhexosamine beside N-acetyl-hexosamine (HexNAc) and hexose (Hex) residues. Also, six different glycosylation sites, which were associated with five serine and one threonine residues, were assigned by electron transfer dissociation (ETD) experiments.
The detailed glycoproteomic profiling of two PSA isoforms was successfully obtained by LC–MS/MS. 56 and 57 N-glycans were identified for PSA and PSAH, respectively, using three peptide backbones with a total of three sulfated/phosphorylated neutral N-glycans [98]. The levels of the glycosylation patterns were investigated for two isoforms, and the results confirmed HexNAc4Hex5dHex1NeuAc1 (28.9%) and HexNAc4Hex5dHex1NeuAc2 (27%) were predominant in forms of PSAH, whereas HexNAc3Hex4dHex1NeuAc1 (13.3%) was observed with the highest intensity in PSA.
The differences in O-glycosylation in the serum of gastric cancer patients (GC) and healthy donors were investigated by using labeled O-glycans (released from proteins) with 1-phenyl-3-methyl-5-pyrazolone followed by LC-MS/MS analysis [99]. Analyzing the LC-MS data by partial least squares discriminant and unpaired Student t-tests confirmed core1, core2, ST antigen, and core2 complex O-glycans were clearly increased in the serum of gastric cancer patients.
The levels of free and conjugated forms of deaminated sialic acid (KDN), Neu5Ac and Neu5Gc in head and neck cancers of the throat, and in a subpopulation of matched regional lymph nodes, using C18-LC–MS/MS technique were investigated by Wang et al. [100]. The results revealed that higher levels of free KDN, relative to levels of free Neu5Ac and Neu5Gc, were expressed in throat cancers and in a subset of paired regional lymph nodes which would be useful as a biomarker for detecting some early-stage cancers and the degree of malignancy.
N-glycopeptide profiling of vitronectin, a multifunctional glycoprotein in the blood and extracellular matrix, has been investigated by tandem mass spectrometry combined with immunoprecipitation purification (by its monoclonal antibody) and HILIC enrichment [101]. The sequences of N-glycopeptides were identified using HCD and CID, where oxonium and Y ions were used for characterizing glycopeptides and y ions for sequencing the peptide backbone. 17 site-specific N-glycopeptides were recognized in all of the three N-glycosylation sites of vitronectin in human plasma. The results also showed that in comparison with normal plasma, three hybrid and four complex glycopeptides of triantennary forms with outer fucosylation increased in HCC patients.
Surface glycoprotein hemagglutinin (HA) of the influenza virus has been characterized using nano-LC–MS for sequence and site occupancy analysis of glycopeptides and MALDI-TOF MS permethylation profiling for characterization of released glycans [102]. The results revealed that, over the 90% of N-glycosylation sites are occupied, with high mannose type structures exclusively at Asn 165 and Asn 246, which are associated with interactions between HA and mouse lung surfactant protein D (SP-D) lung collectin.
P-glycoproteins in breast tissue were fully analyzed using LC-MS/MS operated in the positive ionization MRM mode [103]. The method was applied to the quantitative analysis of P-glycoproteins in 60 matched pairs of breast tissue samples from patients; a cancer diagnosis resulted in overexpression of P-glycoproteins in some cases. The resulting values were compared to those obtained by antibody-based methods, Western blotting, and IHC, and were determined to be more accurate and sensitive measurements.
6. Concluding remarks
This review provides an overview of the most recent research and accomplishments in glycan and glycoprotein profiling of biological samples, in the field of mass spectrometry based methods, by focusing on the latest advancements in both sample preparation and instrumental technologies. The sensitivity and accuracy of glycan profiling have been improved through the use of novel chemical and isotopic labeling reagents in conjunction with powerful tools for isomeric glycan separation such as capillary electrophoresis and ion mobility techniques coupled MS instruments. Further, owing to the superior physicochemical characteristics of nanomaterials, enrichment, and purification of glycoproteins has been successfully investigated by using different functionalized nanomaterials. Fortunately, new technologies for glycopeptide analysis will continue to be developed that can enhance the ability to characterize glycan structures and patterns in biological samples.
Acknowledgments
This work was supported by an NIH grant (1R01GM112490-01) and a grant from the Cancer Prevention and Research Institute of Texas (RP130624).
References
- 1.Mechref Y, Madera M, Novotny MV. Methods Mol Biol. 2008;424:373–96. doi: 10.1007/978-1-60327-064-9_29. [DOI] [PubMed] [Google Scholar]
- 2.Song E, Mechref Y. Biomark Med. 2015;9:835–44. doi: 10.2217/bmm.15.55. [DOI] [PMC free article] [PubMed] [Google Scholar]
- 3.Stavenhagen K, Kolarich D, Wuhrer M. Chromatographia. 2015;78:307–320. doi: 10.1007/s10337-014-2813-7. [DOI] [PMC free article] [PubMed] [Google Scholar]
- 4.Kolli V, Schumacher KN, Dodds ED. Bioanalysis. 2015;7:113–31. doi: 10.4155/bio.14.272. [DOI] [PubMed] [Google Scholar]
- 5.Leymarie N, Griffin PJ, Jonscher K, Kolarich D, Orlando R, McComb M, Zaia J, Aguilan J, Alley WR, Altmann F, Ball LE, Basumallick L, Bazemore-Walker CR, Behnken H, Blank MA, Brown KJ, Bunz SC, Cairo CW, Cipollo JF, Daneshfar R, Desaire H, Drake RR, Go EP, Goldman R, Gruber C, Halim A, Hathout Y, Hensbergen PJ, Horn DM, Hurum D, Jabs W, Larson G, Ly M, Mann BF, Marx K, Mechref Y, Meyer B, Moginger U, Neusubeta C, Nilsson J, Novotny MV, Nyalwidhe JO, Packer NH, Pompach P, Reiz B, Resemann A, Rohrer JS, Ruthenbeck A, Sanda M, Schulz JM, Schweiger-Hufnagel U, Sihlbom C, Song E, Staples GO, Suckau D, Tang H, Thaysen-Andersen M, Viner RI, An Y, Valmu L, Wada Y, Watson M, Windwarder M, Whittal R, Wuhrer M, Zhu Y, Zou C. Mol Cell Proteomics. 2013;12:2935–51. doi: 10.1074/mcp.M113.030643. [DOI] [PMC free article] [PubMed] [Google Scholar]
- 6.Mechref Y, Madera M, Novotny MV. Methods Mol Biol. 2009;492:161–80. doi: 10.1007/978-1-59745-493-3_9. [DOI] [PubMed] [Google Scholar]
- 7.Tang Z, Varghese RS, Bekesova S, Loffredo CA, Hamid MA, Kyselova Z, Mechref Y, Novotny MV, Goldman R, Ressom HW. J Proteome Res. 2010;9:104–12. doi: 10.1021/pr900397n. [DOI] [PMC free article] [PubMed] [Google Scholar]
- 8.Zhu Z, Desaire H. Annu Rev Anal Chem (Palo Alto Calif) 2015;8:463–83. doi: 10.1146/annurev-anchem-071114-040240. [DOI] [PubMed] [Google Scholar]
- 9.Gray CJ, Thomas B, Upton R, Migas LG, Eyers CE, Barran PE, Flitsch SL. Biochim Biophys Acta. 2016;1860:1688–709. doi: 10.1016/j.bbagen.2016.02.003. [DOI] [PubMed] [Google Scholar]
- 10.Lazar IM, Deng J, Ikenishi F, Lazar AC. Electrophoresis. 2015;36:225–37. doi: 10.1002/elps.201400400. [DOI] [PubMed] [Google Scholar]
- 11.Levery SB, Steentoft C, Halim A, Narimatsu Y, Clausen H, Vakhrushev SY. Biochim Biophys Acta. 2015;1850:33–42. doi: 10.1016/j.bbagen.2014.09.026. [DOI] [PubMed] [Google Scholar]
- 12.Nilsson J. Glycoconj J. 2016;33:261–72. doi: 10.1007/s10719-016-9649-3. [DOI] [PubMed] [Google Scholar]
- 13.Paschinger K, Wilson IB. Glycoconj J. 2016;33:273–83. doi: 10.1007/s10719-016-9650-x. [DOI] [PMC free article] [PubMed] [Google Scholar]
- 14.Sethi MK, Fanayan S. Int J Mol Sci. 2015;16:29278–304. doi: 10.3390/ijms161226165. [DOI] [PMC free article] [PubMed] [Google Scholar]
- 15.Struwe WB, Pagel K, Benesch JL, Harvey DJ, Campbell MP. Glycoconj J. 2016;33:399–404. doi: 10.1007/s10719-015-9613-7. [DOI] [PubMed] [Google Scholar]
- 16.Thaysen-Andersen M, Packer NH. Biochim Biophys Acta. 2014;1844:1437–52. doi: 10.1016/j.bbapap.2014.05.002. [DOI] [PubMed] [Google Scholar]
- 17.Song X, Ju H, Lasanajak Y, Kudelka MR, Smith DF, Cummings RD. Nat Methods. 2016;13:528–34. doi: 10.1038/nmeth.3861. [DOI] [PMC free article] [PubMed] [Google Scholar]
- 18.Lauber MA, Yu YQ, Brousmiche DW, Hua Z, Koza SM, Magnelli P, Guthrie E, Taron CH, Fountain KJ. Anal Chem. 2015;87:5401–9. doi: 10.1021/acs.analchem.5b00758. [DOI] [PubMed] [Google Scholar]
- 19.Ahn YH, Kim JY, Yoo JS. Mass Spectrom Rev. 2015;34:148–65. doi: 10.1002/mas.21428. [DOI] [PMC free article] [PubMed] [Google Scholar]
- 20.Chen CC, Su WC, Huang BY, Chen YJ, Tai HC, Obena RP. Analyst. 2014;139:688–704. doi: 10.1039/c3an01813j. [DOI] [PubMed] [Google Scholar]
- 21.Huang BY, Yang CK, Liu CP, Liu CY. Electrophoresis. 2014;35:2091–107. doi: 10.1002/elps.201400034. [DOI] [PubMed] [Google Scholar]
- 22.Ongay S, Boichenko A, Govorukhina N, Bischoff R. J Sep Sci. 2012;35:2341–72. doi: 10.1002/jssc.201200434. [DOI] [PubMed] [Google Scholar]
- 23.Li L, Jiao J, Cai Y, Zhang Y, Lu H. Anal Chem. 2015;87:5125–31. doi: 10.1021/ac504437h. [DOI] [PubMed] [Google Scholar]
- 24.Zhu J, Wu J, Yin H, Marrero J, Lubman DM. J Proteome Res. 2015;14:4932–9. doi: 10.1021/acs.jproteome.5b00662. [DOI] [PMC free article] [PubMed] [Google Scholar]
- 25.Liao HY, Tsai FJ, Lai CC, Tseng MC, Hsu CY, Chen CJ. Analyst. 2016;141:2183–90. doi: 10.1039/c6an00113k. [DOI] [PubMed] [Google Scholar]
- 26.Hamouda H, Kaup M, Ullah M, Berger M, Sandig V, Tauber R, Blanchard V. J Proteome Res. 2014;13:6144–51. doi: 10.1021/pr5003005. [DOI] [PubMed] [Google Scholar]
- 27.Bie Z, Chen Y, Li H, Wu R, Liu Z. Anal Chim Acta. 2014;834:1–8. doi: 10.1016/j.aca.2014.04.035. [DOI] [PubMed] [Google Scholar]
- 28.Cao L, Zhang Y, Chen L, Shen A, Zhang X, Ren S, Gu J, Yu L, Liang X. Analyst. 2014;139:4538–46. doi: 10.1039/c4an00660g. [DOI] [PubMed] [Google Scholar]
- 29.Hecht ES, McCord JP, Muddiman DC. Anal Chem. 2015;87:7305–12. doi: 10.1021/acs.analchem.5b01609. [DOI] [PMC free article] [PubMed] [Google Scholar]
- 30.Sun N, Deng C, Li Y, Zhang X. Anal Chem. 2014;86:2246–50. doi: 10.1021/ac404103r. [DOI] [PubMed] [Google Scholar]
- 31.Zhou S, Hu Y, Mechref Y. Electrophoresis. 2016;37:1506–13. doi: 10.1002/elps.201500568. [DOI] [PMC free article] [PubMed] [Google Scholar]
- 32.Dong X, Zhou S, Mechref Y. Electrophoresis. 2016;37:1532–48. doi: 10.1002/elps.201500561. [DOI] [PMC free article] [PubMed] [Google Scholar]
- 33.Hu Y, Shihab T, Zhou S, Wooding K, Mechref Y. Electrophoresis. 2016;37:1498–505. doi: 10.1002/elps.201500560. [DOI] [PMC free article] [PubMed] [Google Scholar]
- 34.Nishikaze T, Kawabata S, Tanaka K. Anal Chem. 2014;86:5360–9. doi: 10.1021/ac500340t. [DOI] [PubMed] [Google Scholar]
- 35.de Haan N, Reiding KR, Haberger M, Reusch D, Falck D, Wuhrer M. Anal Chem. 2015;87:8284–91. doi: 10.1021/acs.analchem.5b02426. [DOI] [PubMed] [Google Scholar]
- 36.Gao W, Ou G, Feng X, Liu BF, Zhang H, Liu X. Anal Chim Acta. 2015;896:102–10. doi: 10.1016/j.aca.2015.09.028. [DOI] [PubMed] [Google Scholar]
- 37.Jiao J, Yang L, Zhang Y, Lu H. Analyst. 2015;140:5475–80. doi: 10.1039/c5an00572h. [DOI] [PubMed] [Google Scholar]
- 38.Higel F, Seidl A, Demelbauer U, Sorgel F, Friess W. MAbs. 2014;6:894–903. doi: 10.4161/mabs.29263. [DOI] [PMC free article] [PubMed] [Google Scholar]
- 39.Nwosu C, Yau HK, Becht S. Anal Chem. 2015;87:5905–13. doi: 10.1021/ac5040743. [DOI] [PubMed] [Google Scholar]
- 40.Zhao MZ, Zhang YW, Yuan F, Deng Y, Liu JX, Zhou YL, Zhang XX. Talanta. 2015;144:992–7. doi: 10.1016/j.talanta.2015.07.045. [DOI] [PubMed] [Google Scholar]
- 41.Cao W, Zhang W, Huang J, Jiang B, Zhang L, Yang P. Chem Commun (Camb) 2015;51:13603–6. doi: 10.1039/c5cc05365j. [DOI] [PubMed] [Google Scholar]
- 42.Zhou S, Tello N, Harvey A, Boyes B, Orlando R, Mechref Y. Electrophoresis. 2016;37:1489–97. doi: 10.1002/elps.201600013. [DOI] [PMC free article] [PubMed] [Google Scholar]
- 43.Hahne H, Neubert P, Kuhn K, Etienne C, Bomgarden R, Rogers JC, Kuster B. Anal Chem. 2012;84:3716–24. doi: 10.1021/ac300197c. [DOI] [PubMed] [Google Scholar]
- 44.Zhong X, Chen Z, Snovida S, Liu Y, Rogers JC, Li L. Anal Chem. 2015;87:6527–34. doi: 10.1021/acs.analchem.5b01835. [DOI] [PMC free article] [PubMed] [Google Scholar]
- 45.Zhou S, Hu Y, Veillon L, Snovida SI, Rogers JC, Saba J, Mechref Y. Anal Chem. 2016;88:7515–22. doi: 10.1021/acs.analchem.6b00465. [DOI] [PMC free article] [PubMed] [Google Scholar]
- 46.Cai Y, Jiao J, Bin Z, Zhang Y, Yang P, Lu H. Chem Commun (Camb) 2015;51:772–5. doi: 10.1039/c4cc08086f. [DOI] [PubMed] [Google Scholar]
- 47.Wang C, Wu Z, Yuan J, Wang B, Zhang P, Zhang Y, Wang Z, Huang L. J Proteome Res. 2014;13:372–84. doi: 10.1021/pr4010647. [DOI] [PubMed] [Google Scholar]
- 48.Zhu Z, Go EP, Desaire H. J Am Soc Mass Spectrom. 2014;25:1012–7. doi: 10.1007/s13361-014-0859-2. [DOI] [PMC free article] [PubMed] [Google Scholar]
- 49.Kim JY, Oh D, Kim SK, Kang D, Moon MH. Anal Chem. 2014;86:7650–7. doi: 10.1021/ac501544r. [DOI] [PubMed] [Google Scholar]
- 50.Toghi Eshghi S, Yang S, Wang X, Shah P, Li X, Zhang H. ACS Chem Biol. 2014;9:2149–56. doi: 10.1021/cb500405h. [DOI] [PMC free article] [PubMed] [Google Scholar]
- 51.Powers TW, Neely BA, Shao Y, Tang H, Troyer DA, Mehta AS, Haab BB, Drake RR. PLoS One. 2014;9:e106255. doi: 10.1371/journal.pone.0106255. [DOI] [PMC free article] [PubMed] [Google Scholar]
- 52.Etxebarria J, Calvo J, Reichardt NC. Analyst. 2014;139:2873–83. doi: 10.1039/c4an00216d. [DOI] [PubMed] [Google Scholar]
- 53.Liang Q, Macher T, Xu Y, Bao Y, Cassady CJ. Anal Chem. 2014;86:8496–503. doi: 10.1021/ac502422a. [DOI] [PubMed] [Google Scholar]
- 54.Tan Z, Lu W, Li X, Yang G, Guo J, Yu H, Li Z, Guan F. J Proteome Res. 2014;13:2783–95. doi: 10.1021/pr401185z. [DOI] [PubMed] [Google Scholar]
- 55.Pu Y, Ridgeway ME, Glaskin RS, Park MA, Costello CE, Lin C. Anal Chem. 2016;88:3440–3. doi: 10.1021/acs.analchem.6b00041. [DOI] [PMC free article] [PubMed] [Google Scholar]
- 56.Both P, Green AP, Gray CJ, Sardzik R, Voglmeir J, Fontana C, Austeri M, Rejzek M, Richardson D, Field RA, Widmalm G, Flitsch SL, Eyers CE. Nat Chem. 2014;6:65–74. doi: 10.1038/nchem.1817. [DOI] [PubMed] [Google Scholar]
- 57.Lareau NM, May JC, McLean JA. Analyst. 2015;140:3335–8. doi: 10.1039/c5an00152h. [DOI] [PMC free article] [PubMed] [Google Scholar]
- 58.Zhang YW, Zhao MZ, Liu JX, Zhou YL, Zhang XX. J Sep Sci. 2015;38:475–82. doi: 10.1002/jssc.201401025. [DOI] [PubMed] [Google Scholar]
- 59.Guttman A, Kerekgyarto M, Jarvas G. Anal Chem. 2015;87:11630–4. doi: 10.1021/acs.analchem.5b03727. [DOI] [PubMed] [Google Scholar]
- 60.Gao WN, Yau LF, Liu L, Zeng X, Chen DC, Jiang M, Liu J, Wang JR, Jiang ZH. Sci Rep. 2015;5:12844. doi: 10.1038/srep12844. [DOI] [PMC free article] [PubMed] [Google Scholar]
- 61.Zhou S, Hu Y, DeSantos-Garcia JL, Mechref Y. J Am Soc Mass Spectrom. 2015;26:596–603. doi: 10.1007/s13361-014-1054-1. [DOI] [PMC free article] [PubMed] [Google Scholar]
- 62.Tran BQ, Barton C, Feng J, Sandjong A, Yoon SH, Awasthi S, Liang T, Khan MM, Kilgour DP, Goodlett DR, Goo YA. J Proteomics. 2016;134:93–101. doi: 10.1016/j.jprot.2015.10.021. [DOI] [PubMed] [Google Scholar]
- 63.Turiak L, Shao C, Meng L, Khatri K, Leymarie N, Wang Q, Pantazopoulos H, Leon DR, Zaia J. Anal Chem. 2014;86:9670–8. doi: 10.1021/ac5022216. [DOI] [PMC free article] [PubMed] [Google Scholar]
- 64.Santos-Fandila A, Zafra-Gomez A, Vazquez E, Navalon A, Rueda R, Ramirez M. Talanta. 2014;118:137–46. doi: 10.1016/j.talanta.2013.10.013. [DOI] [PubMed] [Google Scholar]
- 65.Zhu F, Trinidad JC, Clemmer DE. J Am Soc Mass Spectrom. 2015;26:1092–102. doi: 10.1007/s13361-015-1110-5. [DOI] [PMC free article] [PubMed] [Google Scholar]
- 66.Khatri K, Staples GO, Leymarie N, Leon DR, Turiak L, Huang Y, Yip S, Hu H, Heckendorf CF, Zaia J. J Proteome Res. 2014;13:4347–55. doi: 10.1021/pr500506z. [DOI] [PMC free article] [PubMed] [Google Scholar]
- 67.Hinneburg H, Hofmann J, Struwe WB, Thader A, Altmann F, Varon Silva D, Seeberger PH, Pagel K, Kolarich D. Chem Commun (Camb) 2016;52:4381–4. doi: 10.1039/c6cc01114d. [DOI] [PubMed] [Google Scholar]
- 68.Barroso A, Gimenez E, Benavente F, Barbosa J, Sanz-Nebot V. Electrophoresis. 2016;37:987–97. doi: 10.1002/elps.201500255. [DOI] [PubMed] [Google Scholar]
- 69.Dong Q, Yan X, Liang Y, Stein SE. J Proteome Res. 2016;15:1472–86. doi: 10.1021/acs.jproteome.5b01046. [DOI] [PubMed] [Google Scholar]
- 70.Tan Z, Yin H, Nie S, Lin Z, Zhu J, Ruffin MT, Anderson MA, Simeone DM, Lubman DM. J Proteome Res. 2015;14:1968–78. doi: 10.1021/acs.jproteome.5b00068. [DOI] [PMC free article] [PubMed] [Google Scholar]
- 71.Basak T, Vega-Montoto L, Zimmerman LJ, Tabb DL, Hudson BG, Vanacore RM. J Proteome Res. 2016;15:245–58. doi: 10.1021/acs.jproteome.5b00767. [DOI] [PMC free article] [PubMed] [Google Scholar]
- 72.Stavenhagen K, Plomp R, Wuhrer M. Anal Chem. 2015;87:11691–9. doi: 10.1021/acs.analchem.5b02366. [DOI] [PubMed] [Google Scholar]
- 73.Behnken HN, Ruthenbeck A, Schulz JM, Meyer B. J Proteome Res. 2014;13:997–1001. doi: 10.1021/pr400999y. [DOI] [PubMed] [Google Scholar]
- 74.Redman EA, Mellors JS, Starkey JA, Ramsey JM. Anal Chem. 2016;88:2220–6. doi: 10.1021/acs.analchem.5b03866. [DOI] [PubMed] [Google Scholar]
- 75.Macchi FD, Yang F, Li C, Wang C, Dang AN, Marhoul JC, Zhang HM, Tully T, Liu H, Yu XC, Michels DA. Anal Chem. 2015;87:10475–82. doi: 10.1021/acs.analchem.5b02627. [DOI] [PubMed] [Google Scholar]
- 76.Bourgoin-Voillard S, Leymarie N, Costello CE. Proteomics. 2014;14:1174–84. doi: 10.1002/pmic.201300433. [DOI] [PMC free article] [PubMed] [Google Scholar]
- 77.Gault J, Malosse C, Machata S, Millien C, Podglajen I, Ploy MC, Costello CE, Dumenil G, Chamot-Rooke J. Proteomics. 2014;14:1141–51. doi: 10.1002/pmic.201300394. [DOI] [PMC free article] [PubMed] [Google Scholar]
- 78.Hu H, Khatri K, Klein J, Leymarie N, Zaia J. Glycoconj J. 2016;33:285–96. doi: 10.1007/s10719-015-9633-3. [DOI] [PMC free article] [PubMed] [Google Scholar]
- 79.Singh C, Zampronio CG, Creese AJ, Cooper HJ. J Proteome Res. 2012;11:4517–25. doi: 10.1021/pr300257c. [DOI] [PubMed] [Google Scholar]
- 80.He L, Xin L, Shan B, Lajoie GA, Ma B. J Proteome Res. 2014;13:3881–95. doi: 10.1021/pr401115y. [DOI] [PubMed] [Google Scholar]
- 81.Cheng K, Chen R, Seebun D, Ye M, Figeys D, Zou H. J Proteomics. 2014;110:145–54. doi: 10.1016/j.jprot.2014.08.006. [DOI] [PubMed] [Google Scholar]
- 82.Zhu Z, Su X, Go EP, Desaire H. Anal Chem. 2014;86:9212–9. doi: 10.1021/ac502176n. [DOI] [PMC free article] [PubMed] [Google Scholar]
- 83.Zhang Y, Yu CY, Song E, Li SC, Mechref Y, Tang H, Liu X. J Proteome Res. 2015;14:5099–108. doi: 10.1021/acs.jproteome.5b00299. [DOI] [PubMed] [Google Scholar]
- 84.Yu CY, Mayampurath A, Zhu R, Zacharias L, Song E, Wang L, Mechref Y, Tang H. Anal Chem. 2016;88:5725–32. doi: 10.1021/acs.analchem.5b04858. [DOI] [PMC free article] [PubMed] [Google Scholar]
- 85.Jansen BC, Falck D, de Haan N, Hipgrave Ederveen AL, Razdorov G, Lauc G, Wuhrer M. J Proteome Res. 2016;15:2198–210. doi: 10.1021/acs.jproteome.6b00171. [DOI] [PubMed] [Google Scholar]
- 86.Jansen BC, Reiding KR, Bondt A, Hipgrave Ederveen AL, Palmblad M, Falck D, Wuhrer M. J Proteome Res. 2015;14:5088–98. doi: 10.1021/acs.jproteome.5b00658. [DOI] [PubMed] [Google Scholar]
- 87.Park GW, Kim JY, Hwang H, Lee JY, Ahn YH, Lee HK, Ji ES, Kim KH, Jeong HK, Yun KN, Kim YS, Ko JH, An HJ, Kim JH, Paik YK, Yoo JS. Sci Rep. 2016;6:21175. doi: 10.1038/srep21175. [DOI] [PMC free article] [PubMed] [Google Scholar]
- 88.Toghi Eshghi S, Shah P, Yang W, Li X, Zhang H. Anal Chem. 2015;87:5181–8. doi: 10.1021/acs.analchem.5b00024. [DOI] [PMC free article] [PubMed] [Google Scholar]
- 89.Nasir W, Toledo AG, Noborn F, Nilsson J, Wang M, Bandeira N, Larson G. J Proteome Res. 2016;15:2826–40. doi: 10.1021/acs.jproteome.6b00417. [DOI] [PubMed] [Google Scholar]
- 90.Gallina S, Cunsolo V, Saletti R, Muccilli V, Di Francesco A, Foti S, Lorenzten AM, Roepstorff P. Amino Acids. 2016;48:1569–80. doi: 10.1007/s00726-016-2209-0. [DOI] [PubMed] [Google Scholar]
- 91.Zhu L, Guo Q, Guo H, Liu T, Zheng Y, Gu P, Chen X, Wang H, Hou S, Guo Y. MAbs. 2014;6:1474–85. doi: 10.4161/mabs.36313. [DOI] [PMC free article] [PubMed] [Google Scholar]
- 92.Geng F, Huang X, Majumder K, Zhu Z, Cai Z, Ma M. J Agric Food Chem. 2015;63:8209–15. doi: 10.1021/acs.jafc.5b02618. [DOI] [PubMed] [Google Scholar]
- 93.Takakura D, Tada M, Kawasaki N. Proteomics. 2016;16:47–59. doi: 10.1002/pmic.201500003. [DOI] [PubMed] [Google Scholar]
- 94.Yuan W, Sanda M, Wu J, Koomen J, Goldman R. J Proteomics. 2015;116:24–33. doi: 10.1016/j.jprot.2014.12.020. [DOI] [PMC free article] [PubMed] [Google Scholar]
- 95.Song E, Hu Y, Hussein A, Yu CY, Tang H, Mechref Y. J Proteome Res. 2015;14:2872–83. doi: 10.1021/acs.jproteome.5b00362. [DOI] [PMC free article] [PubMed] [Google Scholar]
- 96.Nagel T, Meyer B. Biochim Biophys Acta. 2014;1844:2284–9. doi: 10.1016/j.bbapap.2014.09.021. [DOI] [PubMed] [Google Scholar]
- 97.Chaze T, Guillot A, Valot B, Langella O, Chamot-Rooke J, Di Guilmi AM, Trieu-Cuot P, Dramsi S, Mistou MY. Mol Cell Proteomics. 2014;13:2168–82. doi: 10.1074/mcp.M114.038075. [DOI] [PMC free article] [PubMed] [Google Scholar]
- 98.Song E, Mayampurath A, Yu CY, Tang H, Mechref Y. J Proteome Res. 2014;13:5570–80. doi: 10.1021/pr500575r. [DOI] [PMC free article] [PubMed] [Google Scholar]
- 99.He Y, Xie Q, Wang Y, Liang Y, Xu X, Li Y, Miao J, Chen Z, Li Y. Proteomics Clin Appl. 2016;10:206–15. doi: 10.1002/prca.201500041. [DOI] [PubMed] [Google Scholar]
- 100.Wang F, Xie B, Wang B, Troy FA., 2nd Glycobiology. 2015;25:1362–74. doi: 10.1093/glycob/cwv051. [DOI] [PubMed] [Google Scholar]
- 101.Hwang H, Lee JY, Lee HK, Park GW, Jeong HK, Moon MH, Kim JY, Yoo JS. Anal Bioanal Chem. 2014;406:7999–8011. doi: 10.1007/s00216-014-8226-5. [DOI] [PubMed] [Google Scholar]
- 102.An Y, McCullers JA, Alymova I, Parsons LM, Cipollo JF. J Proteome Res. 2015;14:3957–69. doi: 10.1021/acs.jproteome.5b00416. [DOI] [PubMed] [Google Scholar]
- 103.Yang T, Chen F, Xu F, Wang F, Xu Q, Chen Y. Clin Chim Acta. 2014;436:283–9. doi: 10.1016/j.cca.2014.06.013. [DOI] [PubMed] [Google Scholar]
- 104.Bai H, Pan Y, Tong W, Zhang W, Ren X, Tian F, Peng B, Wang X, Zhang Y, Deng Y, Qin W, Qian X. Talanta. 2013;117:1–7. doi: 10.1016/j.talanta.2013.08.031. [DOI] [PubMed] [Google Scholar]
- 105.Qin H, Hu Z, Wang F, Zhang Y, Zhao L, Xu G, Wu R, Zou H. Chem Commun (Camb) 2013;49:5162–4. doi: 10.1039/c3cc41479e. [DOI] [PubMed] [Google Scholar]
- 106.Zheng J, Xiao Y, Wang L, Lin Z, Yang H, Zhang L, Chen G. J Chromatogr A. 2014;1358:29–38. doi: 10.1016/j.chroma.2014.06.070. [DOI] [PubMed] [Google Scholar]
- 107.Zhang L, Jiang H, Yao J, Wang Y, Fang C, Yang P, Lu H. Chem Commun (Camb) 2014;50:1027–9. doi: 10.1039/c3cc47347c. [DOI] [PubMed] [Google Scholar]
- 108.Wang Y, Liu M, Xie L, Fang C, Xiong H, Lu H. Anal Chem. 2014;86:2057–64. doi: 10.1021/ac403236q. [DOI] [PubMed] [Google Scholar]
- 109.Cao Q, Ma C, Bai H, Li X, Yan H, Zhao Y, Ying W, Qian X. Analyst. 2014;139:603–9. doi: 10.1039/c3an01532g. [DOI] [PubMed] [Google Scholar]
- 110.Liu L, Yu M, Zhang Y, Wang C, Lu H. ACS Appl Mater Interfaces. 2014;6:7823–32. doi: 10.1021/am501110e. [DOI] [PubMed] [Google Scholar]
- 111.Pan Y, Ma C, Tong W, Fan C, Zhang Q, Zhang W, Tian F, Peng B, Qin W, Qian X. Anal Chem. 2015;87:656–62. doi: 10.1021/ac5034215. [DOI] [PubMed] [Google Scholar]
- 112.Ma R, Hu J, Cai Z, Ju H. Nanoscale. 2014;6:3150–6. doi: 10.1039/c3nr05367a. [DOI] [PubMed] [Google Scholar]
- 113.Jiang B, Liang Y, Wu Q, Jiang H, Yang K, Zhang L, Liang Z, Peng X, Zhang Y. Nanoscale. 2014;6:5616–9. doi: 10.1039/c4nr00274a. [DOI] [PubMed] [Google Scholar]
- 114.Zhang YW, Li Z, Zhao Q, Zhou YL, Liu HW, Zhang XX. Chem Commun (Camb) 2014;50:11504–6. doi: 10.1039/c4cc05179c. [DOI] [PubMed] [Google Scholar]
- 115.Bi C, Zhao Y, Shen L, Zhang K, He X, Chen L, Zhang Y. ACS Appl Mater Interfaces. 2015;7:24670–8. doi: 10.1021/acsami.5b06991. [DOI] [PubMed] [Google Scholar]
- 116.Liang Y, Wu C, Zhao Q, Wu Q, Jiang B, Weng Y, Liang Z, Zhang L, Zhang Y. Anal Chim Acta. 2015;900:83–9. doi: 10.1016/j.aca.2015.10.024. [DOI] [PubMed] [Google Scholar]
- 117.Li J, Wang F, Wan H, Liu J, Liu Z, Cheng K, Zou H. J Chromatogr A. 2015;1425:213–20. doi: 10.1016/j.chroma.2015.11.044. [DOI] [PubMed] [Google Scholar]
- 118.Wang M, Zhang X, Deng C. Proteomics. 2015;15:2158–65. doi: 10.1002/pmic.201300523. [DOI] [PubMed] [Google Scholar]
- 119.Jiang B, Wu Q, Deng N, Chen Y, Zhang L, Liang Z, Zhang Y. Nanoscale. 2016;8:4894–7. doi: 10.1039/c5nr08126b. [DOI] [PubMed] [Google Scholar]
- 120.Zou X, Jie J, Yang B. Chem Commun (Camb) 2016;52:3251–3. doi: 10.1039/c5cc10416e. [DOI] [PubMed] [Google Scholar]
- 121.Wu R, Li L, Deng C. Proteomics. 2016;16:1311–20. doi: 10.1002/pmic.201500383. [DOI] [PubMed] [Google Scholar]
- 122.Dong L, Feng S, Li S, Song P, Wang J. Anal Chem. 2015;87:6849–53. doi: 10.1021/acs.analchem.5b01184. [DOI] [PubMed] [Google Scholar]
- 123.Fang C, Xiong Z, Qin H, Huang G, Liu J, Ye M, Feng S, Zou H. Anal Chim Acta. 2014;841:99–105. doi: 10.1016/j.aca.2014.05.037. [DOI] [PubMed] [Google Scholar]
- 124.Huang G, Xiong Z, Qin H, Zhu J, Sun Z, Zhang Y, Peng X, ou J, Zou H. Anal Chim Acta. 2014;809:61–8. doi: 10.1016/j.aca.2013.11.049. [DOI] [PubMed] [Google Scholar]
- 125.Huang G, Sun Z, Qin H, Zhao L, Xiong Z, Peng X, Ou J, Zou H. Analyst. 2014;139:2199–206. doi: 10.1039/c4an00076e. [DOI] [PubMed] [Google Scholar]
- 126.Jiang B, Qu Y, Zhang L, Liang Z, Zhang Y. Anal Chim Acta. 2016;912:41–8. doi: 10.1016/j.aca.2016.01.018. [DOI] [PubMed] [Google Scholar]
- 127.Wan H, Huang J, Liu Z, Li J, Zhang W, Zou H. Chem Commun (Camb) 2015;51:9391–4. doi: 10.1039/c5cc01980j. [DOI] [PubMed] [Google Scholar]
- 128.Zhang X, Wang J, He X, Chen L, Zhang Y. ACS Appl Mater Interfaces. 2015;7:24576–84. doi: 10.1021/acsami.5b06445. [DOI] [PubMed] [Google Scholar]
- 129.Zhang Y, Ma W, Li D, Yu M, Guo J, Wang C. Small. 2014;10:1379–86. doi: 10.1002/smll.201302841. [DOI] [PubMed] [Google Scholar]
- 130.Khatri K, Klein JA, White MR, Grant OC, Leymarie N, Woods RJ, Hartshorn KL, Zaia J. Mol Cell Proteomics. 2016;15:1895–912. doi: 10.1074/mcp.M116.058016. [DOI] [PMC free article] [PubMed] [Google Scholar]
- 131.Halim A, Westerlind U, Pett C, Schorlemer M, Ruetschi U, Brinkmalm G, Sihlbom C, Lengqvist J, Larson G, Nilsson J. J Proteome Res. 2014;13:6024–32. doi: 10.1021/pr500898r. [DOI] [PubMed] [Google Scholar]