Abstract
Little is known about how valvular tissues grow and remodel in response to altered loading. In this work, we used the pregnancy state to represent a non-pathological cardiac volume overload that distends the mitral valve (MV), using both extant and new experimental data and a modified form of our MV structural constitutive model. We determined that there was an initial period of permanent set-like deformation where no remodelling occurs, followed by a remodelling phase that resulted in near-complete restoration of homeostatic tissue-level behaviour. In addition, we observed that changes in the underlying MV interstitial cell (MVIC) geometry closely paralleled the tissue-level remodelling events, undergoing an initial passive perturbation followed by a gradual recovery to the pre-pregnant state. Collectively, these results suggest that valvular remodelling is actively mediated by average MVIC deformations (i.e. not cycle to cycle, but over a period of weeks). Moreover, tissue-level remodelling is likely to be accomplished by serial and parallel additions of fibrillar material to restore the mean homeostatic fibre stress and MVIC geometries. This finding has significant implications in efforts to understand and predict MV growth and remodelling following such events as myocardial infarction and surgical repair, which also place the valve under altered loading conditions.
Keywords: remodelling, heart valve, pregnancy, volume overload, structural constitutive model, valve interstitial cell
1. Introduction
A primary hallmark of biological tissues that distinguishes them from abiotic structures is their ability to actively adapt to mechanical, chemical, electrical and thermal cues from their surroundings. In tissues that respond largely to mechanical stimuli, altered loading can trigger a strategic blend of extracellular matrix (ECM) synthesis, degradation and remodelling, producing adaptive changes in mechanical properties that lead to restored function. While valvular tissues are known to remodel in response to various pathological and non-pathological conditions [1–6], few studies have elucidated the mechanisms through which heart valve tissues grow and remodel. Most investigations of valvular remodelling also focus on disease conditions and are therefore potentially influenced by factors specific to the pathology of interest. As a result, very little is known about how heart valves grow and remodel purely in response to altered loading. Such information is important not only for our general understanding of heart valve pathophysiology, but also to serve as the basis for improved methods of valvular repair and replacement.
Of the four heart valves, the mitral valve (MV) is under the greatest mechanical demands. Physiologically, the MV functions to prevent the backflow of blood from the left ventricle (LV) to the left atrium when the LV contracts during systole. MV leaflet tissue is composed of four morphologically distinct layers: (i) the atrialis, which faces the left atrium; (ii) the spongiosa, which is made up primarily of hydrated glycosaminoglycans (GAGs) and proteoglycans; (iii) the fibrosa, which consists mainly of collagen; and (iv) the ventricularis, which contains not only some collagen, but also a substantial amount of elastin. Elastin in MV leaflets has been shown to consist of two highly aligned subpopulations of fibres, oriented circumferentially in the ventricularis and radially in the atrialis [7]. Similarly, collagen in MV leaflets is also highly aligned, with the majority of fibres pointing within ±15° of the circumferential direction. Collagen fibres are also highly undulated (crimped) and thus bear no load until after they have been stretched enough to be completely straightened [7,8]. While native valve properties have been extensively studied, we have comparatively little knowledge regarding how these functional aspects of heart valve leaflet tissues adapt and remodel to altered stresses induced by changes in valvular and ventricular geometry from various surgical procedures and cardiac pathologies.
Pregnancy induces a gradual cardiac volume overload, thus providing a natural paradigm for studying growth and remodelling in the non-pathological heart valve in response to altered loading. This is because pregnancy induces a wide array of cardiac changes, as the presence of the fetal–placental unit places additional demands on the maternal heart. Among these effects, some of the most notable in humans include 50% increases in cardiac output and LV mass, a 40% increase in blood volume, a 30% increase in stroke volume, a 20% increase in end-diastolic LV volume and a 12% increase in MV orifice area [9–11]. At the organ level, the MV is connected to the LV through the chordae tendineae and papillary muscles (PMs) as well as the annulus, making its mechanical behaviour tightly coupled to that of the LV. Changes in the geometry or contractile motion of the LV, owing to factors such as systemic hypertension, myocardial infarction and pregnancy, result in displacement of the PMs and changes to the shape of the MV annulus. This leads to a net change in MV external loading patterns. In response, the MV undergoes complex remodelling to adapt to its new ventricular environment. Previous animal studies have uncovered significant mechanical, structural and compositional changes in all four heart valves during pregnancy (table 1) [5,12–14]. The mechanical behaviour of the MV anterior leaflet has been shown to undergo a biphasic change during pregnancy, with the apparent stiffness of the leaflet increasing significantly in early pregnancy (EP) but returning to normal by late pregnancy (LP) [12]. In contrast, a more recent investigation into structural changes of MV collagen during pregnancy uncovered no biphasic changes, but instead found only monotonic changes in mass fraction, preferred fibre direction, degree of fibre alignment and crimp period [13]. The same study also reported significant changes in the thickness of each MV leaflet tissue layer, with the fibrosa thickening by about 50%, the spongiosa/atrialis thinning by about 30% and the ventricularis thinning by about 45%. We do not yet have a clear understanding of the underlying basis of these phenomena.
Table 1.
Previous findings for MV growth and remodelling during pregnancy. All values previously reported in [5,12–14].
| NP average | P average | |
|---|---|---|
| leaflet stretch (under 60 N m−1) | ||
| circumferential stretch | 1.37 ± 0.03 | 1.26 ± 0.03 |
| radial stretch | 1.67 ± 0.06 | 1.67 ± 0.06 |
| leaflet surface dimensions | ||
| circumferential (cm) | 5.1 ± 0.1 | 5.9 ± 0.2 |
| radial (cm) | 2.5 ± 0.1 | 3.0 ± 0.1 |
| thickness (µm) | 1170 ± 75 | 1194 ± 59 |
| layer thicknesses (µm) | ||
| atrialis/spongiosa | 431 ± 85 | 346 ± 76 |
| fibrosa | 540 ± 130 | 833 ± 76 |
| ventricularis | 221 ± 40 | 135 ± 22 |
| constituent fractions (% dry wt) | ||
| total collagen | 56.7 ± 3.0 | 66.0 ± 3.3 |
| extractable collagen | 0.6 ± 0.1 | 0.6 ± 0.1 |
| elastin | 6.2 ± 0.6 | 2.8 ± 0.4 |
| GAGs | 3.3 ± 0.5 | 1.6 ± 0.2 |
| collagen crimp period (µm) | 22.9 ± 1.2 | 65 ± 15 |
| MVIC population density (per 0.1 mm2) | 10.2 ± 0.7 | 7.6 ± 0.7 |
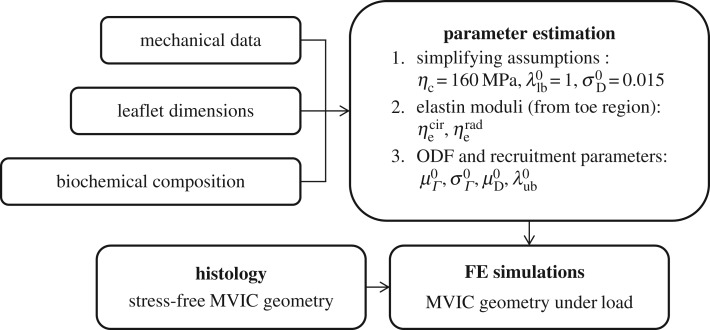
The objective of this study was thus to develop a better understanding of the valvular growth and remodelling process, using the MV pregnancy response as a model system for normal heart valve tissues. Specifically, we sought to draw connections between changes in tissue mechanical properties, composition, structure and MV interstitial cell (MVIC) geometry. Using these results, we began an effort to elucidate the mechanisms through which heart valves are able to adapt under persistent altered loading conditions in vivo. In particular, we wanted to determine if there is a specific homeostatic endpoint that the MV tissue system attempts to re-establish, similar to vascular tissues [15]. To link the observed structural and morphological information, we used a recently developed comprehensive structural constitutive model specialized for the MV [16]. Moreover, we linked tissue-level and cellular changes by quantifying how MVIC geometry changes throughout pregnancy (figure 1). This additional focus on MVIC geometry was based in part on the role of MVICs (particularly their induced deformations over the cardiac cycle) in MV tissue maintenance [17]. Because both the LV and MV are otherwise healthy throughout pregnancy, our results provided insights into how valvular tissues adapt without the confounding pathological factors that must be considered in other diseased systems.
Figure 1.
Schematic of the workflow in this study.
2. Methods
2.1. Mechanical database and processing
In this study, we used extant biaxial mechanical data from a previous study, for which experimental testing methods have been described previously [12]. Briefly, fresh MV anterior leaflets from five never-pregnant heifers (NP) and 10 pregnant cows (P) at a variety of gestational time points were excised, laid flat, and their in-plane dimensions (circumferential length ℓcir and radial length ℓrad) were measured, using a ruler of 1 mm resolution. Leaflet thicknesses were also determined from light microscopy images of radial Verhoeff-stained histological sections. A rectangular specimen from the belly region of each anterior leaflet was mechanically preconditioned and loaded under a membrane tension-controlled equibiaxial protocol to a peak tension of 60 N m−1 in both the circumferential and radial directions. The specimen geometry and applied forces for each dataset were used to calculate right Cauchy–Green deformation tensors C = FTF, where F is the deformation gradient tensor, and second Piola–Kirchhoff stress tensors S at each instant of loading.
2.2. Accounting for changes in leaflet dimensions
Permanent set, growth and true tissue remodelling can all produce substantial changes in the apparent material properties and structure of tissue. To distinguish between these effects, we defined all moduli and structural parameters in our constitutive model with respect to an NP reference state (§2.3), which we estimated by establishing correspondence between the leaflet's NP geometry and its geometry throughout pregnancy. Specifically, we accounted for both permanent set and growth by defining Fges(s) as a function of the gestation time s, which maps a specimen from its NP stress-free configuration β0 to its P stress-free configuration βs (figure 2 and table 2). Because it was not possible to know the actual pre-pregnant dimensions of each P leaflet, Fges(s) was estimated by linear regression fitting of data from Pierlot et al. [14] for circumferential and radial lengths versus gestation time. From the trend lines for ℓcir(s) and ℓrad(s), respectively, Fges(s) was defined as
 |
2.1 |
Figure 2.
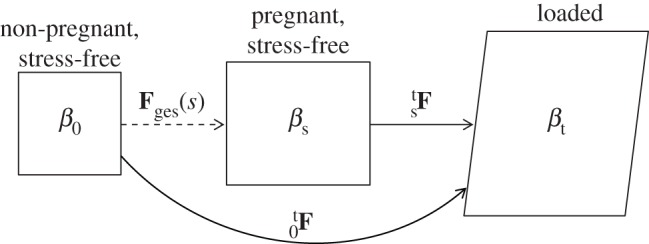
Set of possible states in which a leaflet sample may exist. β0 is the NP reference configuration used for all structural parameters, βs(s) is the natural stress-free configuration of a P leaflet with gestation time s, and βt is the current state of the tissue under load. Corresponding deformation gradient tensors between the reference and loaded states are also shown, as well as Fges(s), which describes the gestation-induced enlargement owing to permanent set and/or growth.
Table 2.
Nomenclature.
| abbreviation | definition | |
|---|---|---|
| anatomy | LV | left ventricle |
| PM | papillary muscle | |
| MV | mitral valve | |
| ECM | extracellular matrix | |
| MVIC | mitral valve interstitial cell | |
| tissue states | NP | non-pregnant/non-pregnancy |
| P | pregnant | |
| EP | early pregnant/pregnancy | |
| LP | late pregnant/pregnancy | |
| s | gestation time | |
| β0 | non-pregnant stress-free tissue configuration | |
| βs | pregnant stress-free tissue configuration | |
| βt | tissue configuration under load | |
| mechanics | Fges | change in configuration during gestation |
| Λges | change in length during gestation | |
| F | deformation gradient | |
| C | right Cauchy–Green deformation tensor | |
| λ | unidirectional stretch | |
| S | second Piola–Kirchhoff stress | |
| constitutive modelling | MSSCM | mesoscale structural constitutive model |
| λslk | collagen fibre slack stretch | |
| D | slack stretch distribution, recruitment function | |
| λlb | lower bound of slack stretch distribution | |
| λub | upper bound of slack stretch distribution | |
| μD | mean recruitment stretch | |
| σD | standard deviation of slack stretch distribution | |
| n | collagen ensemble orientation vector | |
| θ | angle from circumferential axis | |
| ODF, Γ | orientation distribution function | |
| μΓ | preferred fibre angle (ODF mean) | |
| σΓ | fibre splay (ODF standard deviation) | |
| ϕc | collagen fraction | |
| ϕe | elastin fraction | |
| ηc | collagen modulus | |
 |
circumferential and radial elastin moduli |
We used the approximation that ℓcir(0) and ℓrad(0) are equal to the pre-pregnant values of the circumferential and radial lengths, respectively, and that growth and remodelling do not induce appreciable shearing. For any P leaflet with a known βs and s, β0 can be estimated using  . Because growth and remodelling occur on a time scale much larger than that of the cardiac cycle (i.e. weeks versus seconds), any changes with respect to s were quantified without considering how tissue geometry and structure change during in vivo loading and unloading. This also implies that, for each loading cycle, the tissue can be modelled as an incompressible pseudo-hyperelastic biological material.
2.3. Constitutive model
In order to express the mechanical behaviour of each valve leaflet specimen in terms of physically meaningful parameters, we used a recently developed mesoscale structural constitutive model (MSSCM) for MV leaflet tissues [16]. In brief, the total stress in the leaflet in this solid mixture model was assumed to be the weighted linear sum of the stresses borne by the underlying collagen fibre network, elastin fibre network and the remainder of the tissue matrix, with each stress being scaled by the mass fraction of its corresponding phase. The matrix phase has been shown to have very low tensile stiffness and thus to contribute very little to the mechanical behaviour of the total tissue [16]. Therefore, in this study, we neglected the matrix phase and instead attributed all the stress in the tissue to the collagen and elastin fibre networks.
A collagen fibre within the MV leaflet is naturally undulated and bears negligible load for stretch values smaller than some critical ‘slack’ stretch λslk, above which that fibre is fully straightened [16]. In our MSSCM, the collagen phase was modelled at the level of a fibre ensemble, which exhibits the properties of a unidirectional population of collagen fibres having a bounded distribution of slack stretches with lower bound λlb and upper bound λub. We modelled the distribution of slack stretches D, with mean μD and standard deviation σD, using a beta distribution Beta(α,β) that is linearly mapped onto [λlb,λub] and scaled by 1/(λub − λlb) such that  Functionally, D serves to describe the gradual recruitment (i.e. straightening) of fibres in an ensemble, and is thus referred to as the ‘recruitment function’. It has been found that, in normal MV leaflets, D is largely independent of angle [16]. Following anisotropic permanent set and/or growth during pregnancy, however, this assumption is no longer valid if the recruitment function parameters are defined with respect to the natural stress-free reference configuration (βs) of the tissue. To account for this, we defined all structural parameters in the MSSCM with respect to β0, which we estimated for each P specimen using
  . We then recast D with respect to βs under the assumption of affine mapping, following established push-forward procedures [18]. For clarity, we represent the originally defined recruitment function as D0 and the recast version as Ds (note that superscripts are used throughout to designate the reference state of a particular quantity).
Homogenizing to the tissue level, we defined the fibre ensemble orientation as  where
where  is the angle from the circumferential axis in β0. Additionally, we defined a beta-distributed orientation distribution function (ODF) Γ0 supported on
  with mean
  and standard deviation
  which describes the directional density of collagen fibres at any θ0. Following established procedures [19], we recast the ODF into βs using
 |
2.2 |
where  is the pregnancy-induced length change along n0. The total stress in the collagen network is the sum of the stresses along all ensemble directions, weighted by the ODF.
The orientation of elastin fibres has similarly been described using two continuous distributions [16], oriented in the circumferential and radial directions in the ventricularis and atrialis, respectively [7]. We found that, to capture the effective mechanical contribution of elastin, it was sufficient to model the elastin phase as the superposition of two perfectly aligned orthogonal populations of fibres. Consistent with previous findings [20], elastin fibres were assumed to have a linear S–C relationship in this study. To control for changes in the apparent stiffness of the elastin phase owing to permanent set, we defined the effective elastin stiffness modulus for each direction with respect to β0, although S and C are always expressed with respect to the natural stress-free configuration of each specimen (table 3). The sum of the stresses borne by collagen and elastin, weighted by their respective mass fractions ϕc and ϕe, yields the stress tensor for the entire leaflet specimen as
 |
2.3 |
where  are the effective stiffness moduli of collagen, circumferential elastin and radial elastin, respectively,
  is the stretch for an ensemble pointing in ns,
  ,
,  λcir = λ(0), λrad = λ(π/2), and
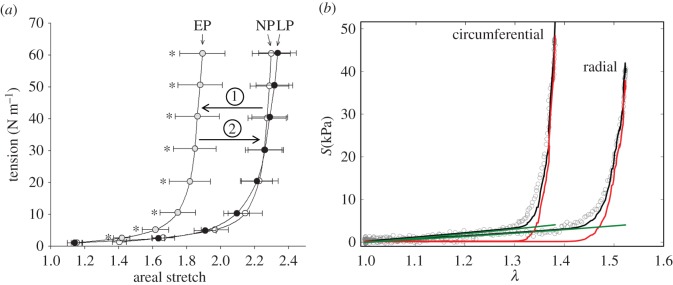
  are the circumferential and radial direction vectors, respectively, cast in βs (table 2). Note that the model does not require any assumptions to be made about the nature of Fges (e.g. negligible shear). The formulation of the MSSCM allows for the convenient decomposition of the contributions by collagen and elastin phases, which can offer insights into the functional roles of each fibre type by highlighting the stress/stretch regimes over which each constituent is dominant (figure 3b).
Table 3.
Reference states for mechanical data and model parameters.
| category | symbols | reference state |
|
|---|---|---|---|
| β0 | βs(s) | ||
| deformation | F, C | X (NP leaflets) | X (P leaflets) |
| stress | S | X (NP leaflets) | X (P leaflets) |
| collagen recruitmenta |  |
X | — |
| collagen orientationa |  |
X | — |
| collagen modulusb | ηc | — | — |
| elastin moduli |  |
X | — |
aNote that recruitment and orientation parameter results for P leaflets presented with a superscript s (e.g.  ) have been mapped into βs for ease of interpretation (§2.5).
bThe collagen modulus is defined with respect to each fibre's fully straightened stress-free state, and is thus independent of tissue reference configuration [16].
Figure 3.
(a) Effective equibiaxial mechanical response of the MV leaflet at each pregnancy stage (adapted from [12]). Tension is plotted against the ratio between the current and stress-free specimen areas. The leaflet apparently stiffens in EP, but recovers its original behaviour by LP. (b) Representative fit of the MSSCM to biaxial mechanical data for an MV leaflet specimen, illustrating the individual contributions of collagen (red) and elastin (green). The left curve corresponds to the circumferential response, whereas the right curve corresponds to the radial response. Model fits achieved R2 = 0.940 on average. (Online version in colour.)
2.4. Parameter estimation
The final MSSCM formulation has nine parameters: the elastin moduli in the circumferential and radial directions  the collagen modulus (ηc), the recruitment function parameters
  and the collagen ODF parameters
  These parameters were estimated in the following order either by assumption or via nonlinear least-squares optimization, using a differential evolution algorithm with a seed range of [ξ/1.1, 1.1ξ] for any parameter initial guess ξ [21] (figure 1). Note that mass fractions of collagen and elastin were not included in the set of estimated parameters, and were instead prescribed from previous biochemical assay results [5,14]. Mass fraction data were re-analysed to identify potential time-dependent trends, and appropriate values for ϕc and ϕe were assigned to each specimen accordingly.
2.4.1. Elastin and collagen moduli
As done previously [16], elastin moduli values were estimated first, under the approximation that elastin fibres are solely responsible for the mechanical response of the leaflet under low stress (figure 3b). In this step, the MSSCM was reduced to just its elastin terms and was then fitted to only the ‘toe region’ points of the response curves for all specimens. We hypothesized that all remodelling could be attributed to structural changes in the collagen phase after accounting for changes in mass fractions and leaflet dimensions, without any need for the inherent material properties of the fibre networks (i.e. the moduli) to change.
Next, we noted that, for collagen ensembles in the MV, full recruitment does not occur until stress in the ensemble direction exceeds 1.5 MPa [16]. Because the mechanical data used in this study only spanned a physiological stress range (less than 100 kPa), we were unable to determine the collagen modulus ηc directly. Instead, we chose to approximate ηc as the average value found by Zhang et al. [16] for the porcine MV anterior leaflet, under the assumption that type I collagen stiffness is well-conserved across species. The collagen modulus was thus fixed at ηc = 160 MPa for all specimens (figure 1). Based on our previous biochemical and thermochemical results, which suggested that collagen synthesized during pregnancy undergoes rapid cross-linking and maturation [5,13], we also assumed that the same collagen modulus could be applied to all groups.
2.4.2. Orientation and recruitment parameters
Owing to covariance both among the recruitment function parameters as well as between the recruitment function and ODF parameters, even a search-based optimization algorithm can often fail, unless data from numerous loading protocols (with varying applied stress ratios) are collected [22]. This issue can be largely remedied, however, by fixing a subset of the parameters to known values. We chose to approximate the standard deviation of the recruitment function, as it has been shown to be consistently close to  with little variation between specimens [16]. Further, based on previous results showing that slack stretch distributions in heart valve leaflets are very negatively skewed, we assumed that
  and thus were able to eliminate an additional parameter by setting the recruitment lower bound
  , without significantly changing the shape of the recruitment function (figure 1). Note that fixing
  and
and  does not lock the effective width of the recruitment function, as
  also greatly affects the shape of D0. Specifically, a linear mapping of
  and
and  onto [0,1] shows that the beta distribution Beta(α, β) from which D0 is defined has the mean
 |
2.4 |
and the standard deviation
 |
2.5 |
which both depend on  Moreover, the shape parameters α and β are given by
| 2.6 |
and thus, by extension, also depend on 
Upon fixing  and
and  we had only four remaining parameters
  which we simultaneously optimized in the final stage of parameter estimation (figure 1). The algorithm was executed several times, using different initial guesses for each parameter that were arbitrarily above or below any feasible value. By confirming that the same optimal solution was obtained every time for each specimen, we demonstrated that the optimization was insensitive to seeding when limited to these four parameters.
2.5. Interpretation of parameter values
All structural parameter values obtained from fitting the MSSCM to P data were defined with respect to an estimated pre-pregnant reference configuration β0 (§2.2 and table 3). In order to draw insights into the relevant changes in collagen structure and to allow for a more physiologically meaningful interpretation of the results, all structural parameters for P specimens were recast into their natural (i.e. post-excision) configuration βs, which corresponds more closely to the functional state of the valve. We obtained the ‘preferred fibre angle’  and ‘fibre splay’
  directly from the corresponding ODF Γs. Owing to the angular dependence of Ds, we chose to consider
  and
and  only for an ensemble oriented in the preferred fibre direction, when
  To arrive at the transformed recruitment parameters, we normalized
  and
and  by the gestational length change along the preferred fibre direction:
 |
2.7 |
All structural parameter results for P specimens presented below are therefore expressed with respect to the βs configuration of each leaflet, and can be interpreted as being closely related to the physiological state of the leaflet at their corresponding gestation time s.
Because the LV remodels substantially during pregnancy [9–11], changes in the fibre architecture of the MV would occur even in the absence of growth and remodelling in the leaflet itself, since annular dilatation and PM displacement change the geometry of the MV. It is thus crucial to determine the extent to which the structural changes seen in the leaflet are consistent with changes in the leaflet's bulk surface dimensions. To determine how large of an effect growth and remodelling had on the MV fibre architecture, we calculated how each structural parameter would have evolved throughout pregnancy in the absence of growth and remodelling. This was accomplished by applying equation (2.2) to the average NP ODF and equation (2.7) to the average NP recruitment parameters for all s, which is equivalent to applying a stretch that corresponds to the observed dimensional changes.
2.6. Mitral valve interstitial cell geometry
To investigate whether structural changes in the ECM coincided with observable changes at the cellular level, we quantified MVIC geometry throughout pregnancy, using the nuclear aspect ratio (NAR) as a metric of overall cell shape (figure 1). First, we obtained histological sections showing the circumferential–transmural plane from three NP and six P leaflets of varying gestation time. Each section was stained with haematoxylin and eosin (H&E), which provided a sharp contrast between nuclei (coloured dark blue) and the surrounding collagen fibres (coloured pale pink). The middle of the fibrosa layer of each section was then imaged using bright-field microscopy at 40× magnification. To determine the average NAR for each section, a custom-written Matlab (MathWorks, Inc.) script was used to automatically detect and fit ellipses to 10 nuclei in each image. The NAR of each MVIC was then calculated as the ratio between the major and minor radii of the corresponding ellipse.
While we used our histological data to quantify the stress-free geometry of MVICs throughout pregnancy, we relied on finite element (FE) simulations to estimate how MVIC NAR changed over the cardiac cycle for different pregnancy stages. In order to estimate changes in MVIC deformation throughout pregnancy, we performed FE simulations using Abaqus (Dassault Systèmes Simulia Corp.) for a representative volume element (RVE) of valve leaflet tissue under biaxial tension, following established procedures [17]. Briefly, 10 MVICs were embedded in a 100 × 100 µm2 ECM region as Saint Venant–Kirchhoff ellipsoidal inclusions of approximately 5 kPa stiffness, with an initial NAR equal to the average found for NP specimens. The number of cells used matched the MVIC population density previously found by Pierlot et al. [5] (table 1). Mechanical properties of non-MVIC elements were prescribed using the MSSCM parameter estimates (§2.4). To simulate the effects of pregnancy-induced dimensional changes at EP, we applied the corresponding pre-stretch to the RVE model and performed the same FE simulation using EP mechanical properties. No separate simulation for LP was performed, because the behaviour of LP leaflets is known to be almost identical to NP [12].
3. Results
3.1. Leaflet dimensions
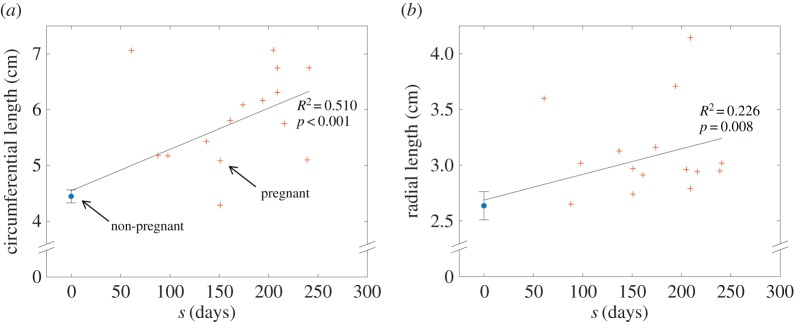
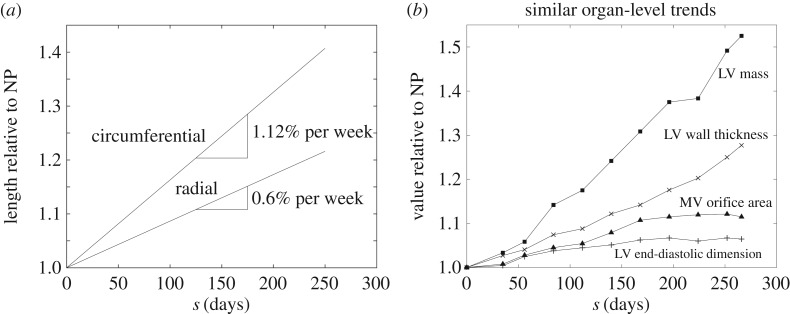
Linear trendlines were sufficient to describe the continual changes in leaflet surface dimensions over the course of pregnancy. The circumferential and radial lengths of the excised MV anterior leaflets were found to correlate significantly with gestation time (figure 4), with R2-values of 0.510 and 0.226, respectively, and p < 0.01 for both cases. Normalizing each dimension by its NP value revealed that relative expansion occurs primarily in the circumferential direction, with the circumferential rate of change doubling its radial counterpart. By 250 days (close to term), circumferential and radial length ratios were found to be 1.4 and 1.2, respectively (figure 5a). The observed leaflet dimensions are consistent with several organ-level dimensions previously measured in humans [10], which also increased linearly throughout pregnancy (figure 5b). No correlation was found for leaflet thickness, which remained relatively constant throughout pregnancy at 1.183 ± 0.046 mm.
Figure 4.
(a) Circumferential and (b) radial length plotted versus gestation time, with NP data displayed as mean ± s.e. at s = 0. Linear trend lines were fitted to all the data, showing a continuous time-dependent correlation for each dimension (adapted from [14], with sample sizes of nNP = 10 and nP = 15). (Online version in colour.)
Figure 5.
(a) Circumferential and radial length ratios (relative to their NP values) over the course of pregnancy. Enlargement occurs primarily in the circumferential direction, at roughly double the rate of that in the radial direction. (b) Similar monotonically increasing dimensional changes that occur at the organ level (adapted from [10]).
3.2. Collagen and elastin fractions
An analysis of mass fraction data from Pierlot et al. [5,14] showed no correlation between ϕc and s (R2 = 0.098, p = 0.073), but revealed a significant time-dependent linear trend in ϕe(s) (figure 6), with R2 = 0.687 and p < 0.001. During model fitting, ϕc was thus assigned groupwise as 0.567 for all NP specimens and 0.660 for all P specimens (table 1), whereas ϕe was prescribed using the regression curve value corresponding to each specimen's gestation time.
Figure 6.
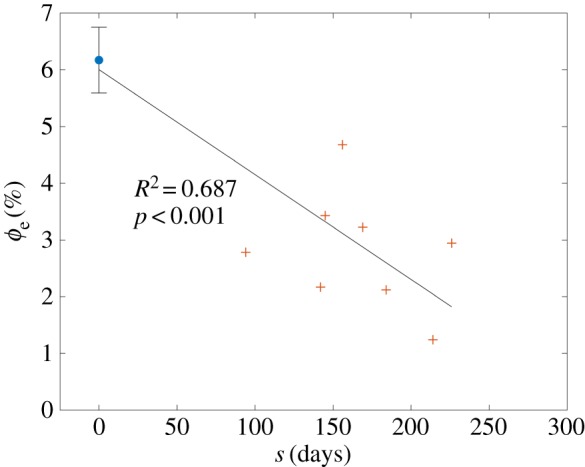
Elastin fraction versus gestation time, showing a significant time-dependent linear decrease (adapted from [5], with sample sizes of nNP = 5 and nP = 8). (Online version in colour.)
3.3. Elastin moduli
The average effective moduli for circumferential and radial elastin were found to be approximately  and
and  respectively, with no time-dependent trends found (R2 = 0.027 and p = 0.278 for
  R2 = 0.155 and p = 0.073 for
  ). When grouped according to pregnancy status, t-tests revealed no significant differences between the mean values of the same modulus in NP and P (p = 0.165 and p = 0.169 for
  and
and  respectively). Additional t-tests comparing the moduli in the two directions indicated that the mean
  is significantly greater than that of
  (p < 0.001 for both NP and P specimens). Note that this result does not imply that the stiffness of the underlying elastin differs between the two axial directions. The discrepancy in the effective elastin moduli should be interpreted instead as an approximation of the relative amounts of circumferential and radial elastin in the leaflet, because this cannot be captured through direct mass measurements. Specifically,
  correlates with the volume of circumferentially oriented elastin in the ventricularis layer, while
  correlates with the volume of radially oriented elastin in the atrialis layer.
3.4. Collagen fibre architecture
No significant time-dependent trend was found for the preferred fibre angle  nor did we find any differences between NP and P groups (p = 0.295). The preferred fibre angle in NP leaflets was 0.07 ± 1.74°, whereas in P leaflets it was 0.82 ± 4.13°. This suggests that the true average fibre angle remains close to
  throughout pregnancy, consistent with negligible growth-induced shearing. In contrast, the fibre splay
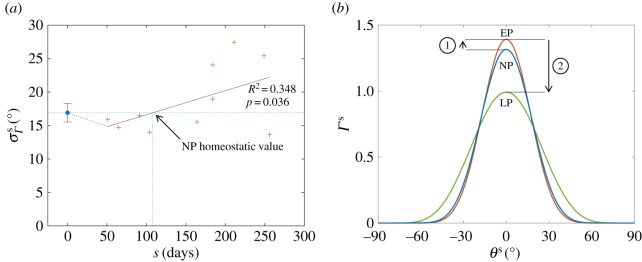
  was found to correlate significantly with gestation time, with R2 = 0.348 and p = 0.036 (figure 7a). We observed that the fibre distribution narrows slightly in EP, whereas in middle and LP the splay continuously increased to values greater than 20°, resulting in a broader ODF (figure 7b).
Figure 7.
(a) Collagen fibre splay plotted versus gestation time, showing a statistically significant time-dependent trend. (b) ODFs representative of NP, EP and LP. While collagen alignment increases initially, fibres are more uniformly oriented in LP. (Online version in colour.)
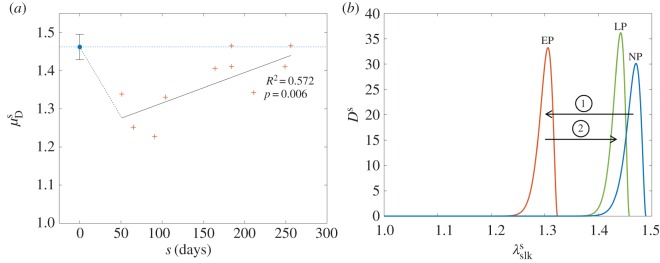
The mean stretch value at which collagen fibres were recruited (i.e. transitioned from a crimped state to a fully straightened state) was found to correlate with gestation time, with R2 = 0.572 and p = 0.006 (figure 8a). The recruitment upper bound was consistently between one and two standard deviations away from the mean, indicating that the effective width of the recruitment function remains relatively constant throughout pregnancy (figure 8b and table 4). The overall behaviour of the recruitment function during gestation paralleled that of the leaflet's effective mechanical response (figures 3a and 8b).
Figure 8.
(a) Mean recruitment stretch for both NP and P specimens, showing a sharp drop in EP followed by a gradual recovery to the pre-pregnant value. (b) Collagen recruitment functions representative of NP, EP and LP. While the distribution of slack stretches is drastically shifted in EP, its normal shape and location are essentially recovered by 250 days (close to term). In addition, the width of the recruitment function stays relatively constant throughout. Parameters used to construct the plotted distributions are listed in table 4. (Online version in colour.)
Table 4.
Representative recruitment parameters.
| parameter | NP | EP (s = 80 days) | LP (s = 250 days) |
|---|---|---|---|
 |
1.462 ± 0.033 | 1.299 ± 0.027 | 1.435 ± 0.030 |
 |
1.489 ± 0.034 | 1.324 ± 0.030 | 1.458 ± 0.043 |
3.5. Structural effects of growth and remodelling
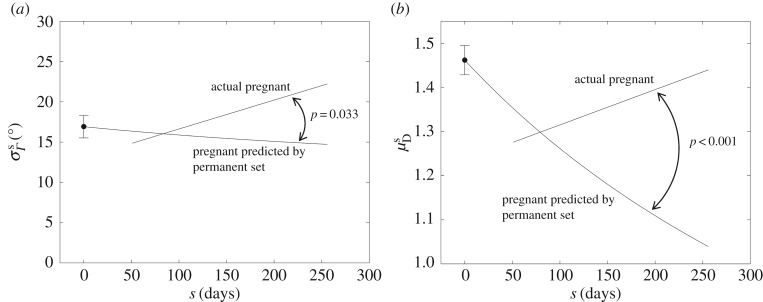
To determine the extent to which growth and remodelling activities change the fibre structure of the leaflet compared with strictly passive processes (e.g. permanent set), we compared the actual fibre splay and recruitment stretch results with a prediction of those same parameters based solely on the observed dimensional changes of the leaflet (figure 9). We found that, in both cases, results for EP specimens were largely consistent with a growth- and remodelling-free permanent set, but results for later stages of pregnancy differed substantially from the growth- and remodelling-free prediction. Specifically, while primarily circumferential enlargement would predict a continual decrease in fibre splay, the actual P data show that fibre splay increases during middle and LP (figure 9a). Similarly, continual enlargement in the absence of growth and remodelling would cause a monotonic decrease in recruitment stretch, although the data show a clear recovery towards the NP value by 250 days (figure 9b). Linear regressions to the difference between the P data and their predicted values were statistically significant for both fibre splay and recruitment stretch (p = 0.033 and p < 0.001 respectively). Interestingly, the gestation time at which the permanent set predictions and the P data regressions intersected was close to s ≈ 80 days for both parameters, suggesting that growth and remodelling effects only become prominent around this time.
Figure 9.
Trend lines for (a) fibre splay and (b) mean recruitment stretch results, plotted together with how each parameter would have evolved in the absence of growth and remodelling. While the bulk dimensional changes in the leaflet alone would cause a continual decrease in both parameters, the actual values diverge from that trend after s ≈ 80 days, demonstrating the magnitude and delay of growth and remodelling effects as well as the significant role of growth and remodelling in the recovery of normal physiological function.
3.6. Quantitative mitral valve interstitial cell geometry
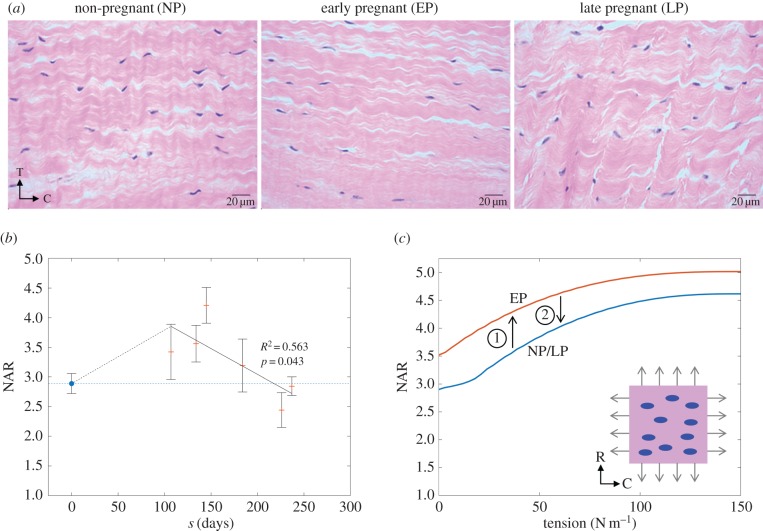
Differences in the shape of MVICs were observable in the H&E-stained histological images (figure 10a). While NP and LP tissues looked morphologically similar with regard to both fibre and cellular geometry, EP leaflets exhibited MVICs that were notably pre-stretched and possibly compressed in the transmural direction by the surrounding collagen. In addition, fibres in EP qualitatively appeared less crimped. NAR quantification revealed a biphasic trend that mirrors that of the mean recruitment stretch, suggesting that these two metrics are tightly coupled (figure 10b). Our results indicated that NAR increases by about 30% in the first 100 days, but then recovers gradually to within its NP range by 200–250 days (R2 = 0.563, p = 0.043).
Figure 10.
(a) Representative histological images of the circumferential–transmural (C–T) plane for leaflets in NP, EP and LP. While fibre architecture and MVIC geometry in NP and LP are relatively similar, collagen in EP is less crimped and MVICs are notably deformed, possibly triggering growth and remodelling. (b) Measured NAR for both NP and P specimens, showing a sharp rise in EP followed by a gradual recovery to the pre-pregnant value. Average NAR for NP leaflets (nNP = 3) is shown as the mean ± s.e. of 30 total MVICs (10 from each specimen). Each P sample is shown as the mean ± s.e. of 10 MVICs. (c) FE simulation results for a population of 10 MVICs in an NP/LP microenvironment, compared with an EP microenvironment. MVICs in EP are predicted to experience higher NARs at all tension levels, but particularly at zero tension (diastole, in vivo). (c, inset) A visualization of the FE mesh used, showing MVICs (blue) as ellipsoidal inclusions in the ECM (pink). (Online version in colour.)
Similar to our direct imaging results, our FE simulations of an MV leaflet RVE likewise showed that EP MVICs experience higher NARs than NP or LP MVICs under any loading, though the difference is most pronounced at zero tension (figure 10c). Specifically, we predicted that EP MVICs experience an increase in NAR greater than 20% when the tissue is unloaded, compared with an increase of less than 10% when the tissue is fully loaded at 150 N m−1. This suggested that alterations in leaflet geometry and loading in vivo primarily cause a deviation from homeostatic MVIC geometry during diastole. Under higher loading, when the ECM is much stiffer owing to earlier collagen recruitment, MVICs do not bear a significant portion of the total stress and thus experience a milder deviation from their normal systolic geometry.
4. Discussion
4.1. General overview
This study, and its antecedents [5,12–14], represent the first detailed attempt at gaining insights into the complex growth and remodelling processes that occur in non-pathological valvular tissues. In this study, we have shown evidence for the substantial growth and remodelling that can result in structural and biochemical changes and dramatically alter the morphology of the valve's leaflet tissue. Specifically, collagen fibre alignment, collagen fibre crimp, layer thicknesses and constituent fractions all change significantly as a result of pregnancy. Our results indicated that growth and remodelling processes in the MV lead to significant structural changes in the collagen phase of the leaflet tissue, at both the tissue and unidirectional fibre ensemble levels. Specifically, we have shown that, as pregnancy advances, growth and remodelling alter the orientation distribution of the collagen network as well as the amount of crimp held by the collagen fibres (figures 7 and 8). Perhaps the most novel aspect of this study was the observation that these tissue architectural adjustments appear to restore the normal physiological pre-pregnant geometry of MVICs.
A key feature of our methodology was that, by quantifying the continually changing dimensions of the leaflet with respect to gestation time, we were able to compensate for the effects of permanent set versus true growth. Moreover, we expressed structural parameters with respect to a single pre-pregnant reference configuration. This approach was vital to establishing correspondence between the mechanical data of NP valves and those of P valves from a wide array of gestational time points. In doing this, we were able to conclude that, although the apparent stiffness of the leaflet changes dramatically during pregnancy [12], the underlying collagen and elastin fibre-level properties are not likely to change appreciably during the remodelling process. Instead, our results demonstrated that changes in the apparent leaflet stiffness can be attributed to a continual change in the natural in vivo configurations of the tissue, as a consequence of permanent set, collagen turnover, mass accretion and elastin degradation. These mechanisms gradually cause the homeostatic mechanical behaviour and interstitial cellular geometry of the MV to be recovered, even in the presence of increasing overload.
At the fibre ensemble level, we hypothesize that collagen crimp is gradually restored at least in part owing to the serial addition of fibrillar material into existing fibres (figure 11). Our past results suggesting that the collagen crimp period increases monotonically in pregnancy [5,13] imply that the overall collagen crimp would need to be restored via an increase in amplitude, a question that should be addressed in a future study. To bring about the significant widening we observed in the ODF (figure 7), we further speculate that new fibres must also be deposited along ensemble directions oriented at larger angles from the circumferential axis. While we do not have exact information on the changes in MV shape during pregnancy, it is likely that in vivo changes in loading make the deposition of more radially oriented fibres adaptive for restoring normal valve function during gestation.
Figure 11.
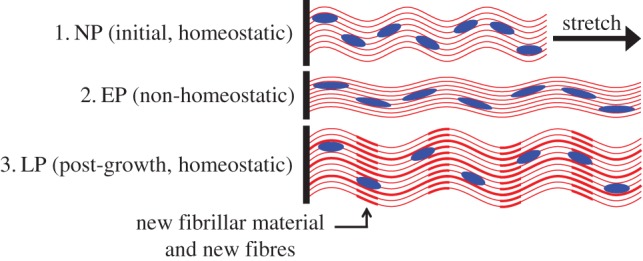
Schematic of a possible mechanism for valvular growth via the serial addition of collagenous fibrillar material as well as the deposition of new collagen fibres. As existing fibres elongate, their crimp amplitude and slack are gradually restored, relieving MVIC compression and restoring normal homeostatic function. (Online version in colour.)
Our model parameters agreed well with the direct structural measurements from Pierlot et al. [13], with both studies finding a decrease in collagen fibre alignment (increase in splay) and an overall decrease in collagen crimp during pregnancy. In addition, our results regarding collagen fibre recruitment showed biphasic changes in mean recruitment stretch and thus the location of the recruitment function overall, which parallels the changes in mechanical behaviour reported by Wells et al. [12] (figure 3a). Viewing these results in their entirety, we are confident that, through the framework of our constitutive model, we have successfully unified the mechanical and structural results of these previous two studies.
Interestingly, although the MV leaflet was able to regain much of its normal mechanical behaviour by the end of pregnancy, growth and remodelling do not appear to restore the MV ECM back to its pre-pregnant state. While our results show that the leaflet virtually recovers its original properties at the ensemble and cellular scales, the same cannot be said for the entire tissue, because the collagen fibre population is significantly less aligned in LP than in NP (figure 7) and the collagen fraction is elevated in LP [13]. These results suggested that the tissue is limited in its ability to reverse the structural changes brought on by altered loading conditions. Alternatively, it is possible that there are multiple tissue states that provide the same essential interstitial cell microenvironment and tensile behaviour under normal stress levels, and that heart valves may not distinguish between these when remodelling. Moreover, while there is some evidence indicating that the effects of pregnancy on the LV are reversed after birth [11], the extent to which valvular tissues in general return to their pre-pregnant state post-partum is unclear, and should be the subject of a future study.
4.2. Delayed restoration of homeostasis
Our results suggested that much of the growth and remodelling in the MV leaflet do not begin immediately after the onset of pregnancy, although the exact reasons for this delay are unknown. This contrasts with pregnancy-induced LV remodelling, which has been shown to be significant just one month after conception [10]. In our results of fibre splay and recruitment stretch, it is apparent that the trend lines for the actual results begin deviating from that which is predicted by the bulk dimensional changes at a gestation time of about 80 days (figure 9). In other words, it seems that the valve is content to obey a trend of mostly passive leaflet enlargement until these parameters reach a critically low level, at which point growth and remodelling are triggered and sustained through middle and LP.
Taking the case of recruitment stretch specifically, the onset of remodelling at the ensemble level can be associated with a significant difference in the in vivo stretch range that the fibres experience as pregnancy advances. Continual leaflet enlargement leads to increasingly large pre-stretch in all directions, which causes collagen fibres to experience significantly higher stretches compared with pre-pregnancy, especially in diastole as the corresponding ensemble mechanical response curve is robbed of its toe region. The way by which this process triggers growth and remodelling must be closely tied to the deformation of MVICs. It has been shown that collagen synthesis as well as the ratio between matrix metalloproteinases (MMPs) and their tissue inhibitors (TIMPs) is dependent on interstitial cell deformation [23,24]. These compounds altogether determine the presence and degradation of collagen in the ECM. Because each MVIC is tightly embedded in the collagen network, its deformation will correlate strongly with the stretch of the fibres surrounding it. Indeed, our cell geometry and FE simulation results clearly showed that the cellular and fibre ensemble scales are tightly coupled, with loss of crimp being associated with a substantial increase in MVIC NAR (figures 8 and 10). As collagen fibre crimp is lost in EP, MVICs become compressed by surrounding fibre bundles and thus experience increasingly non-homeostatic deformations, causing them to initiate growth and remodelling pathways (figure 11). One possible mechanism that would explain the gradual increase in recruitment stretch after EP is the serial addition of fibrillar material within existing collagen fibre bundles, which would increase crimp amplitude and therefore fibre slack. As the insertion of new fibrils causes the fibres to become longer and more undulated, recruitment stretch would steadily increase and normal MVIC geometry would be restored. In direct correlation with local collagen fibre density, it has been shown that MVIC deformation varies across the different tissue layers of the MV leaflet [17]. It is therefore not surprising that MV growth and remodelling is also layer-specific, as demonstrated by the non-uniform changes in layer thicknesses seen in pregnancy [13].
Mechanisms of load-induced stabilization and destabilization of collagen fibres may play an important role in growth and remodelling as well. Several types of collagen are thought to be protected from enzymatic breakdown under low and moderate forces, but are made vulnerable to degradation by higher forces, as large deformations expose sites of protease binding [25–27]. In a collagen network under high pre-stretch (e.g. in EP), it follows that those fibres with the smallest slack stretch (which bear more load and experience higher deformation) are most vulnerable to binding by MMPs and will thus be preferentially degraded. Alongside the deposition of new fibrillar material, this phenomenon would cause the distribution of slack stretches to shift location while maintaining a relatively constant width, which is consistent with our findings (figure 8b). In order for net growth to occur, the synthesis of new collagen fibres, mediated by MVIC deformation, must increase sufficiently to outpace degradation. It is therefore likely that both synthesis and degradation increase significantly in pregnancy, similarly to what is seen following tendon overloading in exercise [28–31]. Because fibres are always deposited with respect to a valve's current state, any new fibres will be less pre-stretched and more crimped than the existing population of fibres, thus helping to shift the recruitment function to the right and closer to its pre-pregnant location (figure 8b). This chain of growth and remodelling processes, including serial fibril addition, has the potential to explain all the recruitment results reported in this study and may be a plausible hypothesis for the mechanism by which the MV recovers its normal physiological function during middle and LP. Future studies should seek to investigate this question, using innovative methods that combine microstructural and biochemical measurements related to collagen synthesis and degradation.
4.3. Generalization and special considerations
Valvular remodelling owing to overload (in pregnancy or otherwise) is fundamentally a result of alterations in the boundary conditions to which the valve leaflets are subjected over the cardiac cycle. In the case of the MV, these alterations come primarily in the form of annular dilatation and expansion of the LV cavity, which causes displacement of the PMs [9–11]. As the LV continues to grow and remodel, these changes in boundary conditions become more pronounced and place an increasingly large pre-stretch on the MV leaflets, which eventually triggers growth and remodelling in the valve. Our study suggests that, in pregnancy, valvular growth and remodelling become significant after about three months. Moreover, we have found that, by 250 days (close to term), homeostatic MVIC geometry and the pre-pregnant mechanical behaviour of the valve are fully recovered.
It is important to note that pregnancy is a special non-pathological case of volume overload and is unique in several ways. Unlike pathological volume overload brought on by anaemia or valvular regurgitation, pregnancy is a condition in which the ventricles and heart valves remain functional but require remodelling nonetheless owing to increased cardiovascular demand. Moreover, pregnancy-induced remodelling is a response to a gradual and continuous onset of volume overload, in contrast with the sporadic stimulus of exercise or certain disease conditions (e.g. infarction). These features make pregnancy a particularly convenient model for studying how heart valves adapt to conditions of increased stretch, because many different magnitudes of overload can be investigated without any influence from disease-specific third variables. In addition to uncovering some of the higher-level mechanisms that drive valvular growth and remodelling, our pregnancy studies provide a first approximation of the rate at which growth and remodelling occurs in response to an increased-stretch condition. This time-course information can potentially be used to inform future studies of valvular growth and remodelling in response to other overload-inducing conditions, such as myocardial infarction [32].
4.4. Limitations
The quantitative accuracy of our results may have been affected by multiple factors. First, the mass fractions of collagen and elastin were prescribed in an average sense, because the mechanical and mass fraction data were taken from different studies and therefore came from different groups of animals [5,12–14]. Because the mass fraction data had relatively high variance, this assumption may have introduced errors in the parameter estimates, because the ODF and recruitment parameters would need to compensate for mass fractions that were too high or too low. Future studies would benefit from controlling individual variations in constituent fractions by performing mass quantification assays on each specimen from which mechanical data are collected. Second, the ODF and recruitment function for each specimen were each modelled using a single beta distribution. While this is likely to provide reasonable approximations of the overall distribution shapes, we acknowledge that a combination of multiple distributions could more precisely describe the orientation and recruitment functions, because newly synthesized fibres are deposited in a different material state and thus belong to a distinct statistical population. Despite these sources of error, we believe the trends of growth and remodelling elucidated in this study are accurate. A further limitation of this study that could impact the generalizability of our results is the potential role of pregnancy-specific hormonal conditions in valvular remodelling, the magnitude of which is currently unknown.
4.5. Conclusion
There is a need to develop a mechanistic model of growth and remodelling in heart valve leaflet tissues. In this study, a cellular- and tissue-level modelling approach was developed to deduce changes in MV leaflets subjected to pregnancy-induced volume overload, which alters valvular loading and boundary conditions. Collectively, our novel results suggest that valvular growth and remodelling can be understood as a process through which cells seek to restore a normal deformation pattern and thus tissue-level homeostasis. These findings point towards models that incorporate data from both mechanical and biochemical studies to draw a more detailed, biologically informed connection between MVIC deformation and growth and remodelling phenomena. The goal of these future studies should be to quantitatively predict the way in which the valve will return to homeostasis after an imposed alteration in leaflet loading in pathological and surgical repair conditions.
Authors' contributions
B.V.R. performed the MVIC measurements and parameter estimation, and wrote most of the text, S.M.W. provided all other experimental data and provided assistance with its interpretation, C.-H.L. performed the MVIC simulations and M.S.S. developed the original idea for the analysis approach, as well as edited the paper and provided major funding.
Competing interests
We have no competing interests.
Funding
This material is based upon work supported by the National Institutes of Health grant no. R01-HL119297 to M.S.S., the National Science Foundation grant no. DGE-1610403 to B.V.R., an American Heart Association Scientist Development Grant (16SDG27760143) to C.-H.L. and a Natural Sciences and Engineering Research Council of Canada Discovery Grant to S.M.W.
References
- 1.Butcher JT, Simmons CA, Warnock JN. 2008. Review—mechanobiology of the aortic heart valve. J. Heart Valve Dis. 17, 62–73. [PubMed] [Google Scholar]
- 2.Gorman JH, Jackson BM, Enomoto Y, Gorman RC. 2004. The effect of regional ischemia on mitral valve annular saddle shape. Ann. Thorac. Surg. 77, 544–548. ( 10.1016/S0003-4975(03)01354-7) [DOI] [PubMed] [Google Scholar]
- 3.Hinton RB, Lincoln J, Deutsch GH, Osinska H, Manning PB, Benson DW, Yutzey KE. 2006. Extracellular matrix remodeling and organization in developing and diseased aortic valves. Circ. Res. 98, 1431–1438. ( 10.1161/01.RES.0000224114.65109.4e) [DOI] [PubMed] [Google Scholar]
- 4.Hinton RB, Yutzey KE. 2011. Heart valve structure and function in development and disease. Annu. Rev. Physiol. 73, 29–46. ( 10.1146/annurev-physiol-012110-142145) [DOI] [PMC free article] [PubMed] [Google Scholar]
- 5.Pierlot CM, Moeller AD, Lee JM, Wells SM. 2015. Pregnancy-induced remodeling of heart valves. Am. J. Physiol. Heart Circ. Physiol. 309, H1565–H1578. ( 10.1152/ajpheart.00816.2014) [DOI] [PubMed] [Google Scholar]
- 6.Walker GA, Masters KS, Shah DN, Anseth KS, Leinwand LA. 2004. Valvular myofibroblast activation by transforming growth factor-β implications for pathological extracellular matrix remodeling in heart valve disease. Circ. Res. 95, 253–260. ( 10.1161/01.RES.0000136520.07995.aa) [DOI] [PubMed] [Google Scholar]
- 7.Lee CH, Zhang W, Liao J, Carruthers CA, Sacks JI, Sacks MS. 2015. On the presence of affine fibril and fiber kinematics in the mitral valve anterior leaflet. Biophys. J. 108, 2074–2087. ( 10.1016/j.bpj.2015.03.019) [DOI] [PMC free article] [PubMed] [Google Scholar]
- 8.Liao J, Yang L, Grashow J, Sacks MS. 2007. The relation between collagen fibril kinematics and mechanical properties in the mitral valve anterior leaflet. J. Biomech. Eng. 129, 78–87. ( 10.1115/1.2401186) [DOI] [PubMed] [Google Scholar]
- 9.Mone SM, Sanders SP, Colan SD. 1996. Control mechanisms for physiological hypertrophy of pregnancy. Circulation 94, 667–672. ( 10.1161/01.CIR.94.4.667) [DOI] [PubMed] [Google Scholar]
- 10.Robson SC, Hunter ST, Boys RJ, Dunlop WI. 1989. Serial study of factors influencing changes in cardiac output during human pregnancy. Am. J. Physiol. Heart Circ. Physiol. 256, H1060–5. [DOI] [PubMed] [Google Scholar]
- 11.Katz RI, Karliner JS, Resnik RO. 1978. Effects of a natural volume overload state (pregnancy) on left ventricular performance in normal human subjects. Circulation 58, 434–441. ( 10.1161/01.CIR.58.3.434) [DOI] [PubMed] [Google Scholar]
- 12.Wells SM, Pierlot CM, Moeller AD. 2012. Physiological remodeling of the mitral valve during pregnancy. Am. J. Physiol. Heart Circ. Physiol. 303, H878–H892. ( 10.1152/ajpheart.00845.2011) [DOI] [PubMed] [Google Scholar]
- 13.Pierlot CM, Lee JM, Amini R, Sacks MS, Wells SM. 2014. Pregnancy-induced remodeling of collagen architecture and content in the mitral valve. Ann. Biomed. Eng. 42, 2058–2071. ( 10.1007/s10439-014-1077-6) [DOI] [PubMed] [Google Scholar]
- 14.Pierlot CM, Moeller AD, Lee JM, Wells SM. 2015. Biaxial creep resistance and structural remodeling of the aortic and mitral valves in pregnancy. Ann. Biomed. Eng. 43, 1772–1785. ( 10.1007/s10439-014-1230-2) [DOI] [PubMed] [Google Scholar]
- 15.Hunley SC, Kwon S, Baek S. 2010 Influence of surrounding tissues on biomechanics of aortic wall: a feasibility study of mechanical homeostasis. In Proc. ASME 2010 Summer Bioengineering Conf., Naples, FL, 16 June 2010, pp. 713–714. New York, NY: American Society of Mechanical Engineers.
- 16.Zhang W, Ayoub S, Liao J, Sacks MS. 2016. A meso-scale layer-specific structural constitutive model of the mitral heart valve leaflets. Acta Biomater. 32, 238–255. ( 10.1016/j.actbio.2015.12.001) [DOI] [PMC free article] [PubMed] [Google Scholar]
- 17.Lee CH, Carruthers CA, Ayoub S, Gorman RC, Gorman JH, Sacks MS. 2015. Quantification and simulation of layer-specific mitral valve interstitial cells deformation under physiological loading. J. Theor. Biol. 373, 26–39. ( 10.1016/j.jtbi.2015.03.004) [DOI] [PMC free article] [PubMed] [Google Scholar]
- 18.Sacks MS, Zhang W, Wognum S. 2016. A novel fibre-ensemble level constitutive model for exogenous cross-linked collagenous tissues. Interface Focus 6, 20150090 ( 10.1098/rsfs.2015.0090) [DOI] [PMC free article] [PubMed] [Google Scholar]
- 19.Fan R, Sacks MS. 2014. Simulation of planar soft tissues using a structural constitutive model: finite element implementation and validation. J. Biomech. 47, 2043–2054. ( 10.1016/j.jbiomech.2014.03.014) [DOI] [PMC free article] [PubMed] [Google Scholar]
- 20.Fata B, Zhang W, Amini R, Sacks MS. 2014. Insights into regional adaptations in the growing pulmonary artery using a meso-scale structural model: effects of ascending aorta impingement. J. Biomech. Eng. 136, 021009 ( 10.1115/1.4026457) [DOI] [PMC free article] [PubMed] [Google Scholar]
- 21.Storn R, Price K. 1997. Differential evolution—a simple and efficient heuristic for global optimization over continuous spaces. J. Glob. Optim. 11, 341–359. ( 10.1023/A:1008202821328) [DOI] [Google Scholar]
- 22.Brossollet LJ, Vito RP. 1996. A new approach to mechanical testing and modeling of biological tissues, with application to blood vessels. J. Biomech. Eng. 118, 433–439. ( 10.1115/1.2796028) [DOI] [PubMed] [Google Scholar]
- 23.Ku CH, Johnson PH, Batten P, Sarathchandra P, Chambers RC, Taylor PM, Yacoub MH, Chester AH. 2006. Collagen synthesis by mesenchymal stem cells and aortic valve interstitial cells in response to mechanical stretch. Cardiovasc. Res. 71, 548–556. ( 10.1016/j.cardiores.2006.03.022) [DOI] [PubMed] [Google Scholar]
- 24.Balachandran K, Sucosky P, Jo H, Yoganathan AP. 2009. Elevated cyclic stretch alters matrix remodeling in aortic valve cusps: implications for degenerative aortic valve disease. Am. J. Physiol. Heart Circ. Physiol. 296, H756–H764. ( 10.1152/ajpheart.00900.2008) [DOI] [PubMed] [Google Scholar]
- 25.Chang SW, Buehler MJ. 2014. Molecular biomechanics of collagen molecules. Mater. Today. 17, 70–76. ( 10.1016/j.mattod.2014.01.019) [DOI] [Google Scholar]
- 26.Adhikari AS, Chai J, Dunn AR. 2011. Mechanical load induces a 100-fold increase in the rate of collagen proteolysis by MMP-1. J. Am. Chem. Soc. 133, 1686–1689. ( 10.1021/ja109972p) [DOI] [PMC free article] [PubMed] [Google Scholar]
- 27.Huang S, Huang HY. 2015. Biaxial stress relaxation of semilunar heart valve leaflets during simulated collagen catabolism: effects of collagenase concentration and equibiaxial strain state. Proc. Inst. Mech. Eng. H 229, 721–731. ( 10.1177/0954411915604336) [DOI] [PubMed] [Google Scholar]
- 28.Magnusson SP, Langberg H, Kjaer M. 2010. The pathogenesis of tendinopathy: balancing the response to loading. Nat. Rev. Rheumatol. 6, 262–268. ( 10.1038/nrrheum.2010.43) [DOI] [PubMed] [Google Scholar]
- 29.Heinemeier KM, Olesen JL, Haddad F, Langberg H, Kjær M, Baldwin KM, Schjerling P. 2007. Expression of collagen and related growth factors in rat tendon and skeletal muscle in response to specific contraction types. J. Physiol. 582, 1303–1316. ( 10.1113/jphysiol.2007.127639) [DOI] [PMC free article] [PubMed] [Google Scholar]
- 30.Miller BF, et al. 2005. Coordinated collagen and muscle protein synthesis in human patella tendon and quadriceps muscle after exercise. J. Physiol. 567, 1021–1033. ( 10.1113/jphysiol.2005.093690) [DOI] [PMC free article] [PubMed] [Google Scholar]
- 31.Koskinen SO, Heinemeier KM, Olesen JL, Langberg H, Kjaer M. 2004. Physical exercise can influence local levels of matrix metalloproteinases and their inhibitors in tendon-related connective tissue. J. Appl. Physiol. 96, 861–864. ( 10.1152/japplphysiol.00489.2003) [DOI] [PubMed] [Google Scholar]
- 32.Pfeffer MA, Braunwald E. 1990. Ventricular remodeling after myocardial infarction. Experimental observations and clinical implications. Circulation 81, 1161–1172. ( 10.1161/01.CIR.81.4.1161) [DOI] [PubMed] [Google Scholar]


