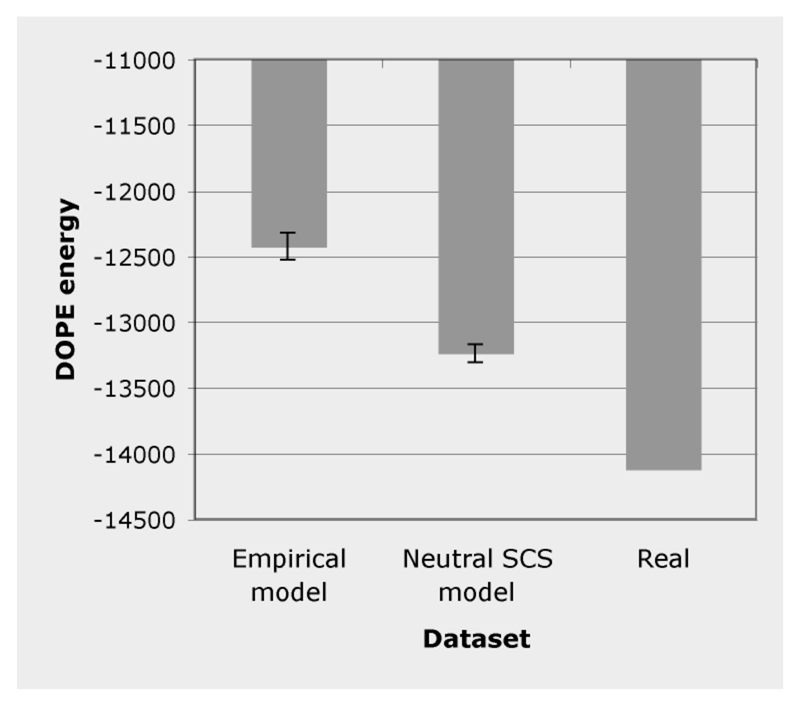
Figure 3.
DOPE energy computed in the simulated proteins under the empirical and the neutral SCS substitution models and in the native protein, for the protein family “Phototactive yellow proteins”. Note that the DOPE energy is unnormalized with respect to the protein size and therefore scores from different proteins cannot be compared directly.

