

Abstract
The eutH gene is part of an operon that allows Salmonella enterica to use ethanolamine as a sole source of nitrogen, carbon, and energy. Although the sequence of EutH suggests a role in transport, eutH mutants use ethanolamine normally under standard conditions (pH 7.0). These mutants fail to use ethanolamine at a low pH. Evidence is presented that protonated ethanolamine (Eth0) does not enter cells, while uncharged ethanolamine (Eth0) diffuses freely across the membrane. The external concentration of Eth0 varies with the pH (pK = 9.5). At pH 7.0, the standard ethanolamine concentration (41 mM) provides enough Eth0 for an influx rate that can support growth with or without EutH. When a lowered pH and/or ethanolamine concentration reduced the Eth0 concentration below 25 μM, EutH was needed to facilitate diffusion. EutH+ cells grew normally at Eth0 concentrations above 3 μM, close to the Km (9 μM) of the first degradative enzyme, ethanolamine ammonia lyase. It is suggested that EutH facilitates diffusion of Eth0. As predicted for a transporter, EutH contributed to the toxicity of ethanolamine seen under some conditions; furthermore, fusion of EutH to fluorescent Yfp protein provided evidence that EutH is a membrane protein.
Salmonella enterica can use ethanolamine as a sole source of carbon and nitrogen. Ethanolamine is degraded in two enzymatic steps. (i) The EutABC enzyme catalyzes cobalamin (B12)-dependent cleavage of ethanolamine to acetaldehyde (3, 17, 20), releasing ammonia. (ii) The EutE enzyme catalyzes NAD+-dependent oxidation of acetaldehyde to acetyl coenzyme A (reviewed in reference 19). Despite the simplicity of the pathway (Fig. 1), 17 proteins are encoded in the eut operon, which supports growth on ethanolamine (6). Ethanolamine use phenotypes have been reported for six genes (eutA, -B, -C, -D, -E, and -R) (4, 16, 18), and three more were recently identified (eutT, -G, and -J) (19, 21a; J. Penrod, unpublished results). The remaining eight genes (including eutH) have no mutant phenotype under standard conditions (Penrod, unpublished) but are likely to be required under some conditions. Evidence is presented here that the EutH protein facilitates diffusion of ethanolamine and is required only at a low pH or at very low external ethanolamine concentrations.
FIG. 1.

Ethanolamine catabolism. The diagram describes the current understanding of ethanolamine metabolism, including conclusions drawn here for the transport mediated by the EutH protein. The functions listed are those of the EutBC (ethanolamine ammonia lyase), EutE (acetaldehyde oxidoreductase) (17, 18), and EutD (4) proteins. The EutT protein is a cobalamin adenosyltransferase (21a). On the basis of extensive homology with AdhE, the EutG protein is inferred to be an ethanol dehydrogenase, and both EutG and EutE are protected from reactive oxygen by EutJ-mediated refolding. EtOH, ethanol; CoA, coenzyme A; TCA, tricarboxylic acid cycle.
Previous assays showed no evidence of an active ethanolamine transport system; significant amounts of isotope from ethanolamine accumulated only in cells with a functional degradative pathway (18). Deletion mutants lacking the whole eut operon were not more defective in uptake than simple lyase (EutBC) mutants. None of the mutations (inside or outside the eut operon) that impaired the use of ethanolamine owed their defect to lack of a transporter (6, 18; Penrod, unpublished). Mutants initially thought to lack an ethanolamine transporter (12) proved to be defective in transport of cobalamin, the cofactor required for growth on ethanolamine (23).
The eutH gene was first identified as an open reading frame in the eut operon sequence. Its 8 to 10 putative membrane-spanning segments (Fig. 2) suggested the possibility of a transport function (22). However, as shown here, a constructed in-frame deletion of the eutH gene caused no ethanolamine growth phenotype under standard conditions (pH 7). No EutH homologues were found in other bacteria, apart from those associated with genes for ethanolamine use. Here we report that EutH is needed for growth on ethanolamine at a low pH or whenever the external concentration of unprotonated ethanolamine (Eth0) drops below 25 μM and reduces the influx rate below that needed for growth.
FIG. 2.

Distribution of hydrophobic residues in the EutH protein. The amino acid sequence of the EutH protein (6) was analyzed for local hydrophobicity by the criteria of Kyte and Doolittle (7). The values plotted were obtained by analyzing the sequence with the ProtScale program on the SWISS-PROT website (http://us.expasy.org/tools/protscale.html).
MATERIALS AND METHODS
Strains and crosses.
All of the strains used in this study (Table 1) are derivatives of S. enterica serovar Typhimurium strain LT2. Transductional crosses were mediated by a high-frequency transducing mutant of phage P22 (HT105, int) (21). The procedures used for transduction crosses and phage lysate preparation were previously described (17).
TABLE 1.
Strains used in this study
| Strain | Genotype |
|---|---|
| TR10000 | Wild-type LT2 |
| TT10661 | eutH25::MudA |
| TT20038 | eutE181::MudJ eutA208::Tn10dTc-Pint |
| TT22236 | LT2/pTP223 |
| TT22815 | eutE356::FRT(Sw) |
| TT23230 | eutH360Δ |
| TT24608 | eutE356::FRT(Sw) eutA208::Tn10dTc-Pint |
| TT24609 | eutE356::FRT(Sw) eutA208::Tn10dTc-Pint DEL750[(cysA1585)*MudA*(eut-23)] |
| TT24610 | eutE356::FRT(Sw) eutH360Δ |
| TT24808 | eut-376::SacKan; between eutH and eutA |
| TT24809 | eutH377::yfp (protein fusion) |
Media and growth conditions.
The rich medium used was nutrient broth (Difco) with 0.1 mM NaCl. The standard minimal medium used was NCE (2) with the indicated carbon source or nitrogen-free NCE medium (NCN) with the indicated carbon and nitrogen sources. The minimal medium used for growth rate determinations contained 5 mM KH2PO4, 5 mM NaNH4HPO4, and 1 mM MgSO4 and was buffered at various pHs with 50 mM morpholineethanesulfonic acid (MES; pHs 5.5 and 6.0), morpholinepropanesulfonic acid (MOPS; pHs 6.5, 7.0, and 7.5), or HEPES (pH 8.0). Ethanolamine hydrochloride and sodium succinate (Sigma) served as carbon sources at the indicated concentrations. In the construction of a eutE mutation (below), glycerol (20 mM; Mallinckrodt) was used as a carbon source in NCN medium with ethanolamine as a nitrogen source (2). Cyanocobalamin (Sigma) was used as a supplement at 150 nM. All minimal liquid media contained biotin, Ca-d-pantothenic acid, nicotinamide, and pyridoxine HCl at 4 × 10⁻⁴% (wt/vol); thiamine and riboflavin at 2 × 10⁻⁵%; and trace metals as previously described (13). Rich medium was solidified by agar (1.5%; EM Science), and minimal medium was solidified by Noble agar (US Biological). Liquid cultures were lightly aerated by shaking standing culture tubes at 240 rpm. For measuring growth in liquid media, 3-ml nutrient broth cultures were started from single colonies and grown overnight. Cells were then pelleted, washed in pH 7.0 minimal medium, resuspended in the same medium, and used (35 μl) to inoculate 6 ml of growth medium. Growth was monitored in three parallel cultures by following the optical density at 650 nm (OD650) on a Spectronic 20D+ spectrophotometer (Spectronic Instruments).
Construction of eutE and eutH mutations.
Deletion mutations were constructed by linear transformation as described by Murphy et al. (11) and did not disturb the reading frame of the deleted eut gene. Final constructions were transduced by P22-mediated crosses into a wild-type LT2 background and verified by PCR and sequencing.
To make a eutE deletion, a chloramphenicol resistance (cat) cassette was amplified with primers P1 (5′ATGAATCAACAGGATATTGAACAGGTGGTGAAAGCGGTACTGAAGTTCCTATACTTTCTAGAGAATAGGAACTTCAAGCCACTGGAGCACCTCAA) and P2 (5′TTATACAATGCGAAACGCATCCACCAGCACGCATCGACGCAGGAAGTTCCTATTCTCTAGAAAGTATAGGAACTTCACGGGGAGAGCCTGAGCAAA).
The 5′ end of P1 (40 bp) has a sequence identical to the first 40 bp of eutE. This is followed by an Flp recombination target (FRT) site and a 3′ end identical to the promoter end of the cat gene. The 5′ end of P2 (42 bp) is the reverse complement of the last 42 bp of eutE and is followed by the reverse complement of an FRT site. The 3′ end is identical to the distal end of the cat cassette. The linear fragment produced by PCR amplification of cat was used to transform strain TT22236 to CamR. Plasmid pCP20, encoding FRT recombinase, was introduced. Recombination between FRT sites removed the Camr cassette, leaving a eutE deletion; the mutant gene produces a small peptide with the first 13 and the last 13 amino acids of the EutE sequence plus an intervening in-frame sequence including a single FRT site (TT22815).
A eutH deletion was constructed by replacing a eutH::Tn10 insertion with a short in-frame sequence unrelated to eutH. A short coding sequence unrelated to eut was amplified with primers P3 (5′ATGGGAATTAACGAAATCATCATGTACATCATGATGTTCTCACCAAACACCCCCCAAAACC) and P4 (5′TCACGATTGCGCCTCCGCTTCGGTTTTCACCTGGGCGCCGTCCACACAACCACACCACACCAC).
The 5′ end of P3 is identical to the first 40 bp of eutH, and the 3′ end is complementary to the 5′ end of the linker. The 5′ end of P4 is reverse complementary to the last 40 bp of eutH, and the 3′ end is a reverse complement of the 3′ end of the linker. The linker DNA has an open reading frame and therefore generates no in-frame translation stops. The DNA fragment made by amplification of the linker was used to transform a eutH::Tn10 insertion mutant (TT10661). The recipient strain is phenotypically Eut− because of polar effects of the eutH::MudA insertion on the distal genes for lyase (eutBC). Cells that acquire the eutH in-frame deletion mutation become Eut+ because they regain downstream expression and EutH function is not needed for growth on ethanolamine (at pH 7).
A double mutant carrying both the eutE and eutH in-frame deletions was constructed by a series of P22-mediated transductions. A phage lysate grown on a double-insertion [eutA::Tn10(Tc) eutE::MudJ(Kn)] mutant (TT20038) transduced Tcr into the eutE in-frame deletion mutant (TT22815), and a Tcr Kns recombinant was retained (TT24608) that carries the eutE deletion and eutA::Tn10. A eut-cysA deletion mutation with Ampr at its join point was introduced into this double mutant to form a triple mutant (TT24609). The eutH deletion was introduced with selection for Cys+ and loss of the eut-cysA deletion. Recombinants were screened to identify those that lost the recipient eutA::Tn10 insertion (and are thus likely to have acquired the adjacent eutH deletion). These were tested to identify those that could use ethanolamine as a source of nitrogen but not carbon (a eutE phenotype). The structure of the eutE eutH double-deletion mutant (TT24610) was verified by PCR.
The gene for yellow fluorescent protein (yfp from the Clontech pEYEP vector) was fused to the distal end of the eutH gene by two successive linear transformations that introduced the yfp coding region into the eut operon without causing a polar effect on transcription. The first transformation introduced a cassette that includes the sacB and kan genes between the chromosomal eutH and eutA genes (8, 10). The sacB gene confers sucrose sensitivity, and the kan gene provides resistance to kanamycin. The cassette was amplified with primers EutHsacF (CGGCGCCCAGGTGAAAACCGAAGCGGAGGCGCAATCGTGATGGCGGCCGCTCTAGAACTAGTG) and EutHsacR (GTGCCGATATCGATACCGACGCTCAGTAGCTGGCGAGTGTCGACGGTATCGATAAGCTTGATATCG).
The SacKan cassette was then replaced with the yfp coding region with selection for sucrose resistance. For this, we used a PCR fragment created by amplifying the yfp gene from the pEYFP vector with primers eutHeyfpF (GACGGCGCCCAGGTGAAAACCGAAGCGGAGGCGCAATCGGGTGGAGGTGGCGGAGGCGGTGGCGGAGGCATGGTGAGCAAGGGCGAGGAGC) and eutHeypF (CGATATCGATACCGACGCTCAGTAGCTGGCGAGTGTTCACGATTGCGCCTCCGCCTTGTACAGCTCGTCCATG).
Sucrose-resistant transformants had lost Knr and carried a eutH-yfp gene fusion that was verified by sequencing (TT24809).
Cell swelling assays.
The method of Heller et al. (5) monitors the shrinkage and reswelling of cells in response to a concentrated solution of a test compound. Efflux of water (shrinking), followed by influx of ethanolamine and water (reswelling), was followed over a 15-min time course. Cells were pregrown overnight in NCE medium with 0.2% ethanolamine hydrochloride, 200 nM cyanocobalamin (B12), and 1% sodium succinate. Overnight cultures were diluted 1:200 into 1 liter of the same culture medium and shaken in 2-liter Kimax flasks at 37°C until the culture reached an OD600 of approximately 1.0. Cells were pelleted by centrifugation, washed twice with 50 mM MOPS (pH 7), and resuspended in approximately 9 ml of the same buffer. Aliquots of this concentrated cell suspension (1.5 ml) were resuspended in 17 ml of baseline buffer to prepare the final cell suspensions used in the swelling assays. Baseline buffers, used to assay the preshrunken state of the cells, each contained 50 mM Good buffer (MOPS for pH 7.0; bicine for pHs 8.0, 8.5, and 9.0; CAPS [3-(cyclohexylamino)-1-propanesulfonic acid] for pHs 9.5, 10.0, and 10.5) and were all adjusted to the desired pH with NaOH. Ethanolamine solute buffers contained 375 mM ethanolamine hydrochloride but were otherwise identical to the baseline buffers. Swelling assays were initiated by mixing 1 ml of cell suspension with 2 ml of baseline or ethanolamine buffer and monitoring the OD600 every 6 s for 15 min with a Beckman Instruments DU series 600 spectrophotometer.
RESULTS
Ethanolamine crosses the cell membrane in a pH-dependent manner.
The cell swelling assay (5) measures solute entry into cells indirectly through changes in the turbidity of a cell suspension that result from plasmolysis (shrinkage) and deplasmolysis (reswelling) of cells after solute addition. Shrinkage results from water loss caused by exposure of cells to an external hypertonic solution, and reswelling results from entry of the solute accompanied by water (1). These assays (Fig. 3) show that, at pH 7, ethanolamine (250 mM) caused shrinkage but no reswelling, suggesting no entry of the solute. At a higher pH, the amount of shrinkage decreased (smaller ΔOD600 between the baseline and the ethanolamine curve at time zero), and the rate of reswelling increased (slope of OD600 curve returning to the baseline). The highest reswelling rate seen was at pH 10.5. At this pH, ethanolamine is mostly unprotonated since the pK for protonation is 9.5. A eutH mutation had no effect on this assay (data not shown), suggesting that the massive ethanolamine flux required to reswell cells is not dependent on this channel. These data indicate that the charged species, which predominates at low pH, does not enter cells at a rate that can be seen in this assay. These results suggested that EutH may not be needed at pH values sufficiently high to allow unaided diffusion. More detailed implications of these results are discussed later.
FIG. 3.

Cell shrinking and swelling caused by ethanolamine at various pH values. Wild-type cells were grown on succinate in the presence of ethanolamine and cobalamin (to induce the eut operon). Washed cells were added to buffered ethanolamine solutions at various pH values to give a final external ethanolamine concentration of 250 mM. Parallel suspensions were made in buffer set at the various pH values but with no ethanolamine (bottom traces). Shrinking and reswelling were monitored by following the OD600. Results identical to those presented were seen for uninduced eut+ cells and for eutH mutant cells whether induced or uninduced.
The ethanolamine growth phenotype of a eutH mutation is pH dependent.
The swelling assay suggested that uncharged ethanolamine enters cells by diffusion at a rate that might be sufficient to support growth at standard pH without a specific transporter. That is, a eutH mutant might show a growth defect only at a pH and ethanolamine concentration for which the influx rate is limited by a low external Eth0 concentration. This was tested initially by scoring growth on solid medium.
Table 2 shows the effects of pH and ethanolamine concentration on the growth of wild-type and eutH mutant cells with ethanolamine as the carbon source. For each set of conditions, the calculated concentration of Eth0 is indicated. While the concentration of the charged species is not significantly affected by changes in pH, the concentration of Eth0 varies widely. Mutants lacking EutH were impaired for growth at Eth0 concentrations below about 25 μM. The concentration required by a eutH mutant is about 10-fold higher than that of wild-type cells (Table 3). The concentration required by EutH+ cells—about 3 μM ethanolamine—is close to the Km (9 μM) of the first enzyme, ethanolamine ammonia lyase (24). The growth ability of both wild-type and eutH mutant strains correlates with the external Eth0 concentration.
TABLE 2.
Conditions under which a eutH mutant has a growth phenotype
| Strain | Genotype | Growtha on ethanolamine as a carbon source at the indicated pH and concns of total ethanolamineb and Eth0c
|
||||||||
|---|---|---|---|---|---|---|---|---|---|---|
| pH 5.5
|
pH 6.0
|
pH 7.0
|
||||||||
| 20 mM (2 μM) | 41 mM (4 μM) | 82 mM (8 μM) | 20 mM (6 μM) | 41 mM (13 μM) | 82 mM (26 μM) | 20 mM (63 μM) | 41 mM (0.13 mM) | 82 mM (0.26 mM) | ||
| TT22524 | eutHΔ | 0 | 0 | 2+ | 0 | 2+ | 4+ | 4+ | 4+ | 4+ |
| TR10000 | Wild-type LT2 | 4+ | 4+ | 4+ | 4+ | 4+ | 4+ | 4+ | 4+ | 4+ |
Growth was scored qualitatively on an increasing scale from no growth (0) to strong growth (4+).
Total concentration of ethanolamine in assay plates, regardless of charge.
The concentration of Eth0 (in parentheses) was calculated for the indicated pH by using the Henderson-Hasselbach equation.
TABLE 3.
Minimum ethanolamine for wild type
| pH | Growtha on ethanolamine as a carbon source at the indicated concn of total ethanolamine (mM)b
|
|||||
|---|---|---|---|---|---|---|
| 0.25 | 0.5 | 1 | 2.5 | 5 | 10 | |
| 5.5 | 0 (0.026) | 0 (0.05) | 0 (0.10) | 1+ (0.26) | 1+ (0.52) | 2+ (1.0) |
| 6.0 | 0 (0.10) | 0 (0.20) | 1+ (0.41) | 1+ (0.81) | 2+ (1.6) | 3+ (3.2) |
| 6.5 | 0 (0.26) | 1+ (0.51) | 1+ (1.0) | 2+ (2.6) | 3+ (5.2) | 4+ (10) |
Growth on ethanolamine as the carbon source was scored qualitatively on an increasing scale from no growth (0) to strong growth (4+).
Total concentration of ethanolamine in plates regardless of charge. The concentrations (in micromolar units) of Eth0 at the indicated pHs were calculated by using the Henderson-Hasselbach equation and are presented in parentheses.
These growth responses were also seen in liquid growth tests (Fig. 4). At pH 7.5, wild-type and eutH mutant cells grow similarly at a range of ethanolamine concentrations (Fig. 4A and B). A reduced pH (Fig. 4C and D) impaired the ability of a eutH mutant to grow on lower ethanolamine concentrations but had no effect on the growth of wild-type cells (data not shown). It should be noted that at pH 7.5, the growth ability of parallel eutH mutant cultures was rather variable. We suggest that this reflects the frequent appearance of suppressor mutants that allow faster entry of ethanolamine.
FIG. 4.

Effect of pH on growth on ethanolamine as the sole carbon source. Solid and open symbols represent growth of wild-type LT2 and the eutHΔ mutant, respectively. Individual curves indicate growth on different initial concentrations of added ethanolamine. Symbols: squares, 20 mM; circles, 10 mM; triangles, 8 mM; diamonds, 6 mM. Parts A and B describe the growth of wild-type and eutH mutant cells at pH 7.5. Parts C and D describe the growth of a eutH mutant at pHs 7 and 6.5. Wild-type cells show the same growth response at pHs 6.5 and 7 (not shown) as at pH 7.5 (above).
A second test of EutH as a facilitator of ethanolamine uptake.
It was previously suggested that ethanolamine catabolism releases sufficient acetaldehyde to inhibit the growth of cells that lack protective functions such as glutathione or the repair protein DNA polymerase I (14, 15). This suggested that conditions might be found under which added ethanolamine inhibits the growth of cells on an unrelated carbon source. If EutH contributes to ethanolamine influx, it should also contribute to this sensitivity under appropriate conditions.
Tests of this prediction were done with an in-frame eutE deletion mutant that lacks the second step of the ethanolamine pathway (Fig. 1) and should accumulate acetaldehyde produced from ethanolamine. This mutant grew as well as the wild type on succinate. Unlike the wild type, this mutant was inhibited for growth on succinate by added ethanolamine. The toxicity of ethanolamine required the first enzyme of the pathway. That is, toxicity was eliminated by lack of the lyase cofactor B12 and by mutations that inactivate lyase (eutBC), suggesting strongly that acetaldehyde is responsible. We have also demonstrated that acetaldehyde is released by strains growing on ethanolamine (Penrod, unpublished). This allowed a second test of the suggested role of EutH in transport.
If EutH is involved in ethanolamine transport, it should contribute to the toxic effect of ethanolamine (described above) on a eutE mutant. That is, under conditions that require EutH for transport, a eutH mutation should reduce the toxic effect of ethanolamine. Conversely, if EutH acts at some later step in ethanolamine metabolism or if it facilitates efflux of toxic acetaldehyde, one might expect a eutH mutation to increase the toxicity of ethanolamine.
Rates of growth in liquid support the idea that EutH contributes to ethanolamine influx (Fig. 5). A eutH mutation did not impair the growth of a eutE mutant on succinate. However, as shown in Fig. 5, a eutH mutation substantially relieved the toxic effect on an eutE mutant of 10 mM ethanolamine at pH 7.0. As predicted if only Eth0 enters cells, the same eutH mutation had no effect at pH 7.5 and completely corrected ethanolamine sensitivity at pH 6.5 (data not shown).
FIG. 5.

Ethanolamine inhibits the growth of eutH mutants on succinate. Wild-type LT2 is indicated by squares, the eutHΔ mutant is indicated by triangles pointing up, the eutEΔ mutant is indicated by diamonds, and the eutEHΔ double mutant is indicated by triangles pointing down. The results presented (for pH 7) are intermediate between the result seen at pH 6.5 (complete correction) and that seen at pH 7.5 (no correction). Both the wild type and the eutH single mutant grow normally on succinate at all three pH values.
EutH protein is localized in the cell membrane.
The EutH sequence included 8 to 10 putative transmembrane segments (Fig. 2), suggesting that the protein might be inserted in the membrane, as expected for a transporter. The predicted location of EutH was tested with a fusion of yellow fluorescent protein (Yfp) to EutH. The yfp coding sequence was fused to the eutH gene within the eut operon as described in Materials and Methods. This chimeric gene produces a hybrid protein with the Yfp sequence linked to the C-terminal end of the EutH protein with a linker of 10 glycine residues. The EutH-Yfp fusion strain grew like the wild type in the assay described in Table 2, indicating that the fusion protein supplied normal EutH function and the construction caused no polar effects on downstream genes in the operon. Fluorescence microscopy revealed the localization of the EutH-Yfp protein near the cell periphery (Fig. 6). The specificity of this labeling is clear since the same Yfp sequence showed uniform labeling across the cell when fused to other proteins and labeled only points within the cell (thought to be carboxysomes) when fused to carboxysome shell proteins.
FIG. 6.
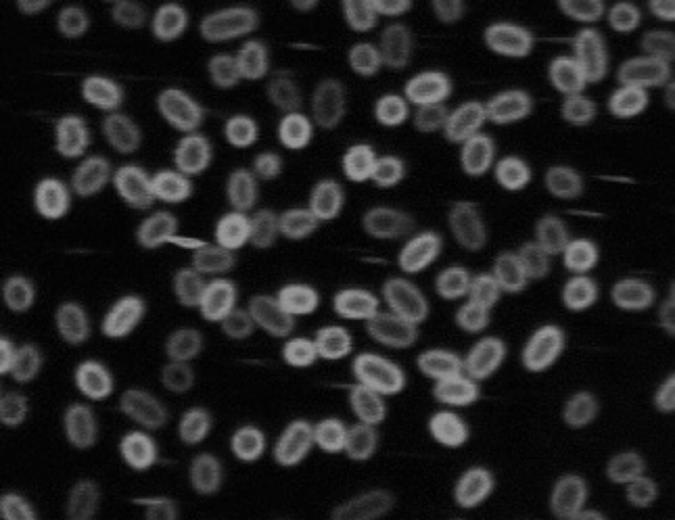
Distribution of fluorescence in cells expressing a EutH-Yfp fusion protein. The eutH-yfp fusion allele was constructed in the chromosomal eut operon by linear transformation as described in Materials and Methods. This allele does not disturb the transcription of downstream genes, and cells with the fusion allele show wild-type growth under conditions that impair the growth of eutH null mutants.
DISCUSSION
Cell swelling experiments showed a pH-dependent diffusion of ethanolamine into cells of S. enterica, indicating that the uncharged form Eth0 diffused freely across the membrane while the protonated form was excluded. This suggested that the putative ethanolamine transporter EutH might facilitate influx of the uncharged species and thus be needed only when the Eth0 concentration was reduced by a low pH and ethanolamine.
Evidence that EutH is a diffusion facilitator for uncharged ethanolamine.
(i) In previous experiments, isotopes from labeled ethanolamine did not accumulate in cells without an intact degradative pathway (18). (ii) Wild-type cells use ethanolamine only when the Eth0 concentration is above 3 μM, a concentration near the Km of ethanolamine ammonia lyase (9 μM). (iii) A eutH mutant failed to grow normally at Eth0 concentrations below 25 μM, suggesting that at lower concentrations the gradient provided insufficient flux for growth without facilitation. (iv) At physiological pH values, wild-type cells require an Eth0 concentration that approximates the Km of the first enzyme.
Selective maintenance of the eutH gene in natural populations suggests that S. enterica frequently encounters ethanolamine at concentrations or under pH conditions that limit the external Eth0 level to between 3 and 25 μM—the range over which EutH enhances the ability to utilize ethanolamine.
The lack of an active transport system for ethanolamine may have several explanations. (i) The small amount of energy obtained from a two-carbon compound may make the cost of active transport prohibitive. Much of the derived energy is needed to generate larger carbon-containing molecules. Because ethanolamine is metabolized via the tricarboxylic acid cycle and glyoxalate shunt, formation of large carbon-containing molecules requires formation of phosphoenolpyruvate either from oxaloacetate (at a cost of one ATP) or from malate through pyruvate (at a cost of two ATPs). (ii) Much of the transported ethanolamine is lost as the volatile intermediate acetaldehyde (Penrod, unpublished), and some is likely to be lost as ethanol (formed to balance redox). (iii) Perhaps most importantly, actively transported ethanolamine would be subject to immediate loss because the uncharged form can cross the membrane by nonspecific diffusion.
Interpretation of cell swelling assays.
The cell swelling assays in Fig. 3 have some curious features. While increased pH allowed more rapid swelling, the major effect is seen at pH values (pHs 9.5 to 10.5) that are above the pK for ethanolamine (pH 9.5), a range in which the external Eth0 concentration changes less than twofold; a much smaller effect is seen in the pH range of 7.5 to 9.5, over which the Eth0 concentration increases about 50-fold. Furthermore, even at the highest pH tested, the influx rate is slow compared to that seen for uncharged solutes such as glycerol (5, 9) and is not affected by the presence of EutH. Generally these assays have been used to study the influx of nonionic solutes while here an ionizable compound is used. We suggest that EutH is a low-capacity channel and at these high concentrations, Eth0 enters at a slow rate, primarily through general unfacilitated routes. After entry, ethanolamine is reprotonated within the small cell volume, causing an increase in the internal pH that limits protonation of ethanolamine and reswelling. Full swelling requires reduction of the internal pH to that of the outside, which may be easier to achieve when the external pH is higher. During growth, the pH problems may be solved in part by metabolism of ethanolamine and attendant release of excess ammonia from the cell.
Acknowledgments
This work was supported by a grant (GM34804) from the National Institutes of Health.
We thank Peter Anderson, Cyril Bussiere, Eric Kofoid, and David Sheppard for suggestions and criticism.
REFERENCES
- 1.Alemohammad, M. M., and C. J. Knowles. 1974. Osmotically induced volume and turbidity changes of Escherichia coli due to salts, sucrose and glycerol, with particular reference to the rapid permeation of glycerol into the cell. J. Gen. Microbiol. 82:125-142. [DOI] [PubMed] [Google Scholar]
- 2.Berkowitz, D., J. M. Hushon, H. J. Whitfield, Jr., J. R. Roth, and B. N. Ames. 1968. Procedure for identifying nonsense mutations. J. Bacteriol. 96:215-220. [DOI] [PMC free article] [PubMed] [Google Scholar]
- 3.Bradbeer, C. 1965. The clostridial fermentations of choline and ethanolamine. I. Preparation and properties of cell-free extracts. J. Biol. Chem. 240:4669-4674. [PubMed] [Google Scholar]
- 4.Brinsmade, S. R., and J. C. Escalante-Semerena. 2004. The eutD gene of Salmonella enterica encodes a protein with phosphotransacetylase enzyme activity. J. Bacteriol. 186:1890-1892. [DOI] [PMC free article] [PubMed] [Google Scholar]
- 5.Heller, K. B., E. C. Lin, and T. H. Wilson. 1980. Substrate specificity and transport properties of the glycerol facilitator of Escherichia coli. J. Bacteriol. 144:274-278. [DOI] [PMC free article] [PubMed] [Google Scholar]
- 6.Kofoid, E., C. Rappleye, I. Stojiljkovic, and J. Roth. 1999. The 17-gene ethanolamine (eut) operon of Salmonella typhimurium encodes five homologues of carboxysome shell proteins. J. Bacteriol. 181:5317-5329. [DOI] [PMC free article] [PubMed] [Google Scholar]
- 7.Kyte, J., and R. F. Doolittle. 1982. A simple method for displaying the hydropathic character of a protein. J. Mol. Biol. 157:105-132. [DOI] [PubMed] [Google Scholar]
- 8.Lawes, M., and S. Maloy. 1995. MudSacI, a transposon with strong selectable and counterselectable markers: use for rapid mapping of chromosomal mutations in Salmonella typhimurium. J. Bacteriol. 177:1383-1387. [DOI] [PMC free article] [PubMed] [Google Scholar]
- 9.Lin, E. C. 1986. Glycerol facilitator in Escherichia coli. Methods Enzymol. 125:467-473. [DOI] [PubMed] [Google Scholar]
- 10.Muro-Pastor, A. M., and S. Maloy. 1995. Direct cloning of mutant alleles from the bacterial chromosome into plasmid vectors in vivo. BioTechniques 18:386-388, 390. [PubMed] [Google Scholar]
- 11.Murphy, K. C., K. G. Campellone, and A. R. Poteete. 2000. PCR-mediated gene replacement in Escherichia coli. Gene 246:321-330. [DOI] [PubMed] [Google Scholar]
- 12.O'Toole, G. A., and J. C. Escalante-Semerena. 1991. Identification and initial characterization of the eutF locus of Salmonella typhimurium. J. Bacteriol. 173:5168-5172. [DOI] [PMC free article] [PubMed] [Google Scholar]
- 13.Price-Carter, M., J. Tingey, T. A. Bobik, and J. R. Roth. 2001. The alternative electron acceptor tetrathionate supports B12-dependent anaerobic growth of Salmonella enterica serovar Typhimurium on ethanolamine or 1,2-propanediol. J. Bacteriol. 183:2463-2475. [DOI] [PMC free article] [PubMed] [Google Scholar]
- 14.Rondon, M. R., A. R. Horswill, and J. C. Escalante-Semerena. 1995. DNA polymerase I function is required for the utilization of ethanolamine, 1,2-propanediol, and propionate by Salmonella typhimurium LT2. J. Bacteriol. 177:7119-7124. [DOI] [PMC free article] [PubMed] [Google Scholar]
- 15.Rondon, M. R., R. Kazmierczak, and J. C. Escalante-Semerena. 1995. Glutathione is required for maximal transcription of the cobalamin biosynthetic and 1,2-propanediol utilization (cob/pdu) regulon and for the catabolism of ethanolamine, 1,2-propanediol, and propionate in Salmonella typhimurium LT2. J. Bacteriol. 177:5434-5439. [DOI] [PMC free article] [PubMed] [Google Scholar]
- 16.Roof, D. M., and J. R. Roth. 1992. Autogenous regulation of ethanolamine utilization by a transcriptional activator of the eut operon in Salmonella typhimurium. J. Bacteriol. 174:6634-6643. [DOI] [PMC free article] [PubMed] [Google Scholar]
- 17.Roof, D. M., and J. R. Roth. 1988. Ethanolamine utilization in Salmonella typhimurium. J. Bacteriol. 170:3855-3863. [DOI] [PMC free article] [PubMed] [Google Scholar]
- 18.Roof, D. M., and J. R. Roth. 1989. Functions required for vitamin B12-dependent ethanolamine utilization in Salmonella typhimurium. J. Bacteriol. 171:3316-3323. [DOI] [PMC free article] [PubMed] [Google Scholar]
- 19.Roth, J. R., J. G. Lawrence, and T. A. Bobik. 1996. Cobalamin (coenzyme B12): synthesis and biological significance. Annu. Rev. Microbiol. 50:137-181. [DOI] [PubMed] [Google Scholar]
- 20.Scarlett, F. A., and J. M. Turner. 1976. Microbial metabolism of amino alcohols. Ethanolamine catabolism mediated by coenzyme B12-dependent ethanolamine ammonia-lyase in Escherichia coli and Klebsiella aerogenes. J. Gen. Microbiol. 95:173-176. [DOI] [PubMed] [Google Scholar]
- 21.Schmieger, H. 1971. A method for detection of phage mutants with altered transducing ability. Mol. Gen. Genet. 110:378-381. [DOI] [PubMed] [Google Scholar]
- 21a.Sheppard, D. E., J. T. Penrod, T. A. Bobik, E. Kofoid, and J. R. Roth. Evidence that a B12-adenosyl transferase is encoded within the ethanolamine operon of Salmonella enterica. J. Bacteriol., in press. [DOI] [PMC free article] [PubMed]
- 22.Stojiljkovic, I., A. J. Bäumler, and F. Heffron. 1995. Ethanolamine utilization in Salmonella typhimurium: nucleotide sequence, protein expression, and mutational analysis of the cchA cchB eutE eutJ eutG eutH gene cluster. J. Bacteriol. 177:1357-1366. [DOI] [PMC free article] [PubMed] [Google Scholar]
- 23.Thomas, M. G., G. A. O'Toole, and J. C. Escalante-Semerena. 1999. Molecular characterization of eutF mutants of Salmonella typhimurium LT2 identifies eutF lesions as partial-loss-of-function tonB alleles. J. Bacteriol 181:368-374. [DOI] [PMC free article] [PubMed] [Google Scholar]
- 24.Weisblat, D. A., and B. M. Babior. 1971. The mechanism of action of ethanolamine ammonia-lyase, a B 12-dependent enzyme. 8. Further studies with compounds labeled with isotopes of hydrogen: identification and some properties of the rate-limiting step. J. Biol. Chem. 246:6064-6071. [PubMed] [Google Scholar]