Abstract
We found that when a site-specific binding protein interacts with the “handle” region of the prorenin prosegment, the prorenin molecule undergoes a conformational change to its enzymatically active state. This nonproteolytic activation is completely blocked by a decoy peptide with the handle region structure, which competitively binds to such a binding protein. Given increased plasma prorenin in diabetes, we examined the hypothesis that the nonproteolytic activation of prorenin plays a significant role in diabetic organ damage. Streptozotocin-induced diabetic rats were treated with subcutaneous administration of handle region peptide. Metabolic and renal histological changes and the renin-Ang system components in the plasma and kidneys were determined at 8, 16, and 24 weeks following streptozotocin treatment. Kidneys of diabetic rats contained increased Ang I and II without any changes in renin, Ang-converting enzyme, or angiotensinogen synthesis. Treatment with the handle region peptide decreased the renal content of Ang I and II, however, and completely inhibited the development of diabetic nephropathy without affecting hyperglycemia. We propose that the nonproteolytic activation of prorenin may be a significant mechanism of diabetic nephropathy. The mechanism and substances causing nonproteolytic activation of prorenin may serve as important therapeutic targets for the prevention of diabetic organ damage.
Introduction
The most striking abnormalities of the renin-Ang system (RAS) in the blood of diabetic animals are the decreased renin level and the increased prorenin level (1). Indeed, increased blood prorenin levels in human diabetics have been reported to predict microvascular complications (2). Recent studies have demonstrated that transgenic rats expressing prorenin have severe renal histopathology mimicking diabetic nephrosclerosis without hypertension (3) and show evidence that circulating prorenin may enter organs (4). The mechanism whereby intracellular prorenin causes organ damage remained unclear, however.
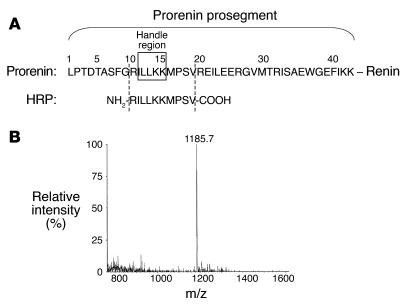
Prorenin has a prosegment of 43 amino acid residues attached to the N terminus of mature (active) renin, and the prosegment folds into an active site cleft of mature renin to prevent catalytically productive interaction with angiotensinogen. When a prorenin-binding protein interacts with the “handle” region of the prorenin prosegment, the prorenin molecule undergoes a conformational change to an enzymatically active state (5). This phenomenon is called nonproteolytic activation, and such binding proteins include a specific Ab to the prosegment (5), the N-acyl-D-glucosamine 2-epimerase (6), the mannose-6-phosphate receptor (7, 8), or the prorenin/renin receptor (9). These findings indicate the strong possibility that a peptide with the structure of this handle region (handle region peptide, or HRP; see Figure 1) must competitively bind to such a binding protein as a decoy peptide and inhibit the nonproteolytic activation of prorenin.
Figure 1.
Preparation of the decoy peptide corresponding to the HRP. (A) Amino acid sequences of the rat prorenin prosegment and HRP. (B) Mass of the HRP prepared.
In the present study, we used such a decoy peptide to demonstrate a novel mechanism whereby prorenin as such, without proteolytic activation, causes organ damage by comparing levels of the RAS components in the kidney and plasma during the development of diabetic nephropathy. HRP clearly prevented development of diabetic nephropathy and suppressed an increase of renal Angs while the total renal renin plus prorenin remained unaltered. To clarify the mechanism whereby prorenin causes organ damage, we investigated the alteration of the RAS component levels in the plasma and kidneys during the development of diabetic nephropathy and the in vitro and in vivo effects of HRP on their alteration levels.
Results
In vitro effects of HRP on binding of prorenin to prorenin Abs.
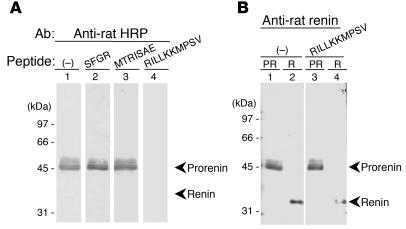
To examine the affinity, specificity, and dose of HRP in the inhibitory effects on the binding of rat prorenin to its Abs, immunoblot analysis of recombinant prorenin to the Ab for the anti-handle region was performed. The binding of recombinant prorenin to the Ab for the anti-handle region was completely inhibited by 1 μM HRP (RILLKKMPSV) but was not influenced by the peptides representing other regions of the prorenin prosegment (SFGR or MTRISAE) (Figure 2A). Similar results were also obtained at 10 and 100 nM HRP. In addition, HRP did not affect the binding of prorenin to Ab against proteolytically activated renin (Figure 2B). These results suggest that HRP can specifically bind to the anti–HRP Ab with a high affinity and inhibit the binding of prorenin to anti–HRP Ab in vitro.
Figure 2.
Interference of the prorenin binding to its Abs by the HRP. (A) Recombinant rat prorenin was analyzed by immunoblotting using 3 nM purified Ab to HRP in the absence (–; lane 1) or presence of 1 μM regional peptides of prorenin prosegment, SFGR (lane 2), MTRISAE (lane 3), or RILLKKMPSV (lane 4). The image shows that HRP binds to the anti–HRP Ab with a high affinity and inhibits the binding of recombinant prorenin to anti–HRP Ab. Similar results were also obtained at 10 and 100 nM RILLKKMPSV. (B) Recombinant rat prorenin (PR) (lanes 1 and 3) and renin (R) (lanes 2 and 4) were analyzed by immunoblotting using anti–rat renin Ab in the absence (lanes 1 and 2) or presence of 1 μM HRP, RILLKKMPSV (lanes 3 and 4). The image shows that HRP specifically binds to the anti–HRP Ab but not to the anti–renin Ab and does not inhibit the binding of prorenin to anti–renin Ab.
During in vitro preliminary experiments, we had expressed rat prorenin/renin receptor protein (accession number AB188298 in the DNA Databank of Japan) in COS-7 cells and showed binding and activation of recombinant rat prorenin by 20% ± 2.5% of the trypsin-activatable level (350 ng Ang I/ml/hr). This activation was practically abolished by rat HRP (10P–19P) used as a decoy at 1 μM, but not by another prosegment heptapeptide (30P–36P) outside the handle region, indicating specific inhibitory action of HRP against prorenin activation. We also found that prorenin activated by rat prorenin/renin receptor expressed on COS-7 cells could be bound to anti–rat HRP Abs on the cells, visualized by using intensifying second Ab conjugated with peroxidase. This result indicated that prorenin activated by the receptor protein still had a prosegment including the handle region and that activation of prorenin by the receptor protein was presumably not due to a proteolytic mechanism but was due to a conformational change. Analogous to the prorenin/renin-binding protein, polyclonal Abs to the rat HRP also activated rat prorenin by 20% ± 1.0% of the maximum activation attainable by trypsin, and the activation was practically abolished by 1 μM HRP used as a decoy. These results indicate that specific binding of prorenin either to the receptor protein or Ab to HRP results in a significant activation of prorenin. These observations provide in vitro evidence that HRP inhibits the activation by competing out the binding of the prorenin receptor or HRP Abs to prorenin.
Metabolic changes and urinary protein excretion.
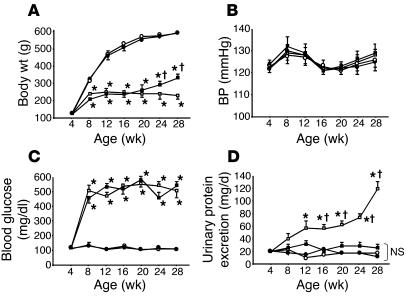
We determined metabolic changes and urinary protein excretion in nondiabetic control rats with saline minipumps (C rats), nondiabetic control rats with HRP-containing minipumps (C + HRP rats), diabetic rats with saline-containing minipumps (DM rats), and diabetic rats with HRP minipumps (DM + HRP rats) during the 24-week treatment period (Figure 3). The body weight of the DM rats averaged 231 ± 15 g at 28 weeks of age and was significantly smaller than that of the C rats (590 ± 10 g). The basal BP of the C and DM rats averaged 123 ± 2 and 122 ± 2 mmHg, respectively, and the BP had been similar in the C and DM rats during the 24-week treatment period. The blood glucose levels of the DM rats averaged 509 ± 34 mg/dl at 8 weeks of age (4 weeks of diabetes) and was significantly higher than those of the C rats (132 ± 14 mg/dl). Higher blood glucose levels of the DM rats versus the C rats were maintained during the 24-week treatment period. Continuous infusion of HRP by subcutaneous minipumps did not affect the body weight, BP, or blood glucose levels of either control or diabetic rats during the 24-week treatment period, although the body weight of diabetic rats increased at 24 and 28 weeks of age. In the DM rats, urinary protein excretion significantly increased from 20.0 ± 3.1 at 4 weeks of age (0 weeks of diabetes) to 118.8 ± 11.9 mg/day at 28 weeks of age (24 weeks of diabetes), and HRP practically normalized the increased urinary protein excretion in diabetic rats to levels similar to those of the control rats. The urinary protein excretion at 28 weeks of age (24 weeks of diabetes) in the DM + HRP rats averaged 33.0 ± 4.1 mg/day and was similar to that in the C and C + HRP rats.
Figure 3.
Metabolic changes and urinary protein excretion in C rats (open circles, n = 18), C + HRP rats (closed circles, n = 18), DM rats (open squares, n = 18), and DM + HRP rats (closed squares, n = 18). (A) Body weight. Graph shows attenuation of body weight gain in diabetic rats. Except for the increases at 24 and 28 weeks of age in diabetic rats, HRP did not affect body weight during the 24-week treatment period. *P < 0.05 versus C or C + HRP rats; P < 0.05 for DM + HRP versus DM rats. (B) Systolic BP. The graph shows similar systolic BP in all 4 groups of rats. (C) Blood glucose concentration. The graph shows increased blood glucose levels in the diabetic rats. HRP had no effect on blood glucose levels. *P < 0.05 versus C or C + HRP rats. (D) Urinary protein excretion. The graph shows a progressive increase in urinary protein excretion in DM rats. HRP treatment inhibited the development and progression of proteinuria in diabetic rats. *P < 0.05 versus 4 weeks of age; P < 0.05 for DM rats versus the other 3 groups. NS, no significant difference among the C, C + HRP, and DM + HRP rats.
Morphology and immunohistochemistry.
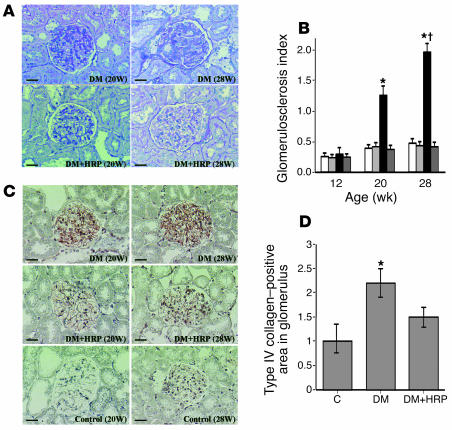
Figure 4A shows changes in renal morphology in the C, C + HRP, DM, and DM + HRP rats during the 24-week treatment period. We did not observe any histological changes in the kidney of the DM rats up to 12 weeks of age (8 weeks of diabetes), but glomerulosclerosis began to develop at 20 weeks of age (16 weeks of diabetes) and was exacerbated at 28 weeks of age (24 weeks of diabetes). As shown in Figure 4B, the glomerulosclerosis index of 20- and 28-week-old DM rats averaged 1.25 ± 0.16 and 1.96 ± 0.14, respectively, and was significantly greater than that of the C, C + HRP, or DM + HRP rats. In the 28-week-old DM rats, the glomerulosclerosis index was significantly greater than that at 20 weeks of age. Long-term administration of HRP completely inhibited the development of glomerulosclerosis in the diabetic rats, and we did not observe any histological changes during the 24-week treatment period in the DM + HRP rats. The glomerulosclerosis index was similar among the C, C + HRP, and DM + HRP rats during the 24-week treatment period. We also investigated ECM accumulation in the kidney of diabetic rats by type IV collagen immunostaining, as shown in Figure 4C. Kidneys of all groups of rats were negative for expression of type IV collagen in the glomerulus up to 12 weeks of age, but at 20 weeks of age type IV collagen was expressed in the glomerulosclerotic lesions of the kidneys of the DM rats. At 28 weeks of age, expression of type IV collagen increased in the DM rats, but it was markedly suppressed to a level slightly higher than the control level in the DM + HRP rats (n = 6), though the difference between C rats and DM + HRP rats was statistically insignificant (Figure 4D). Expression of type IV collagen during the 24-week treatment period was not observed in either the C or C + HRP rats.
Figure 4.
Inhibition of the development of diabetic nephropathy by the HRP of prorenin. (A) PAS-stained kidney sections. The photomicrographs show the development and progression of diabetic glomerulosclerosis at 20 weeks of age and later in DM rats. HRP inhibited the development of diabetic glomerulosclerosis in diabetic rats. Scale bars: 50 μm. (B) Glomerulosclerosis index of the kidneys in C rats (white bars, n = 6), C + HRP rats (light gray bars, n = 6), DM rats (black bars, n = 6), and DM + HRP rats (dark gray bars, n = 6). The graph shows an increase in glomerulosclerosis index at 20 weeks of age and later in DM rats and inhibition of the increase by HRP treatment. *P < 0.05 for DM rats versus the other 3 groups; P < 0.05 for 28 versus 20 weeks of age. (C) Immunohistochemistry of type IV collagen. The photomicrographs show increased glomerular type IV collagen at 20 weeks of age and later in DM rats. HRP inhibited the increase in glomerular type IV collagen in the diabetic rats. Scale bars: 50 μm. (D) Quantitative analysis (folds versus C rats) of type IV collagen–positive areas in glomeruli. The graph shows an increase in type IV collagen–positive area in the glomeruli of DM rats at 28 weeks of age and inhibition of the increase by HRP treatment. *P < 0.05 versus C rats.
Components of the circulating and kidney RAS.
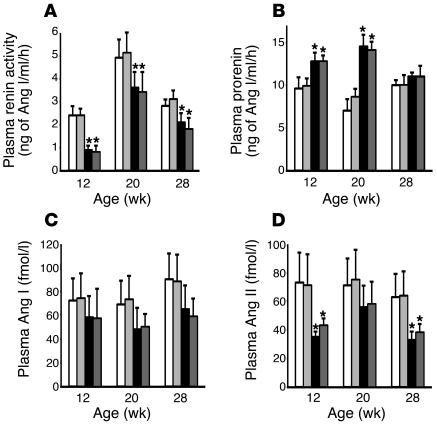
As shown in Figure 5, plasma renin activity was significantly lower in the DM rats than in the C rats during the 24-week treatment period, and administration of HRP did not affect plasma renin activity in either control or diabetic rats (Figure 5A). Plasma prorenin level was significantly higher in the DM rats than in the C rats up to 20 week of age (16 weeks of diabetes), and administration of HRP did not affect plasma prorenin level in either control or diabetic rats (Figure 5B). The plasma levels of Ang I and II were also lower in the DM rats than in the C rats during the 24-week treatment period, and HRP did not influence plasma Ang I or II levels of either control or diabetic rats (Figure 5, C and D).
Figure 5.
Changes in components of the circulating RAS in C rats (white bars, n = 6), C + HRP rats (light gray bars, n = 6), DM rats (black bars, n = 6), and DM + HRP (dark gray bars, n = 6). (A) Plasma renin activity. The graph shows decreased plasma renin activity in diabetic rats. HRP did not affect the plasma renin activity of either control or diabetic rats. (B) Plasma prorenin concentration. The graph shows increased plasma prorenin concentration in diabetic rats up to 20 weeks of age. HRP did not affect the plasma prorenin concentration of either control or diabetic rats. (C) Plasma Ang I concentration. The graph shows a tendency for the plasma Ang I concentration to decrease in diabetic rats. HRP did not affect the plasma Ang I concentration in either control or diabetic rats. (D) Plasma Ang II concentration. The graph shows a decreased plasma Ang II concentration in the diabetic rats. HRP did not affect the plasma Ang II concentration in either control or diabetic rats. *P < 0.05 for diabetic versus control rats.
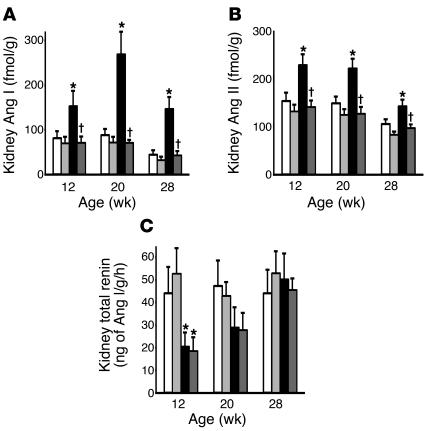
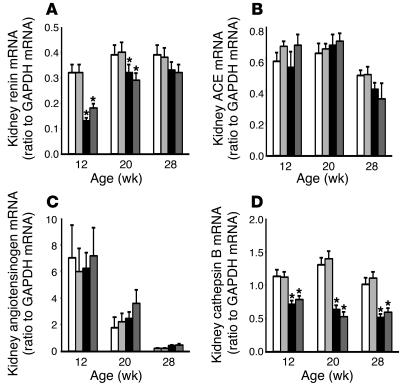
At 8 weeks of age (4 weeks of diabetes) when the diabetic nephropathy had not yet developed, the DM rats had a small but significant increase in the kidney Ang I and II content (109 ± 16 and 147 ± 12 fmol/g, respectively) compared with the C rats (58 ± 11 and 77 ± 8 fmol/g, respectively). At 12, 20, and 28 weeks of age, the kidney Ang I and II content was significantly higher in the DM rats than the similarly low levels in the C, C + HRP, and DM + HRP rats (Figure 6, A and B). The kidney Ang I content of the DM, DM + HRP, C, and C + HRP rats averaged 268 ± 51, 70 ± 8, 88 ± 14, and 71 ± 13 fmol/g, respectively, and the kidney Ang II content of the DM, DM + HRP, C, and C + HRP rats averaged 220 ± 21, 126 ± 15, 148 ± 14, and 124 ± 12 fmol/g, respectively, at 20 weeks of age (16 weeks of diabetes) when renal histological changes have developed. Thus, HRP administration completely inhibited the increased kidney Ang I and II content in the diabetic rats. The kidney total renin content and the kidney renin mRNA level were lower in the DM rats than in the C rats at 12 and 20 weeks of age, and they were similar at 28 weeks of age. HRP administration did not alter kidney total renin content or kidney renin mRNA levels in either control or diabetic rats at any week of age (Figures 6C and 7A). The kidney Ang-converting enzyme (ACE) and angiotensinogen mRNA levels were similar in the C, C + HRP, DM, and DM + HRP rats during the 24-week treatment period (Figure 7, B and C) but tended to decrease with age. The kidney cathepsin B mRNA level was significantly lower in the DM rats than in the C rats during the 24-week treatment period. HRP administration did not alter kidney cathepsin B mRNA level in either control or diabetic rats at any week of age (Figure 7D).
Figure 6.
Changes in protein components of the kidney RAS in C rats (white bars, n = 6), C + HRP rats (light gray bars, n = 6), DM rats (black bars, n = 6), and DM + HRP rats (dark gray bars, n = 6). (A) Kidney Ang I level. The graph shows an increased kidney Ang I level in the DM rats. HRP significantly inhibited the increase in kidney Ang I level in the diabetic rats. (B) Kidney Ang II level. The graph shows an increased kidney Ang II level in the DM rats. HRP significantly inhibited the increase in kidney Ang II level in the diabetic rats. (C) Kidney total renin level. The graph shows a decreased kidney total renin level in the DM rats at 12 weeks of age. HRP did not affect the kidney total renin level in either control or diabetic rats. *P < 0.05 for DM versus C rats; P < 0.05 for rats with HRP versus rats without HRP.
Figure 7.
Changes in mRNA components of the kidney RAS in C rats (white bars, n = 6), C + HRP rats (light gray bars, n = 6), DM rats (black bars, n = 6), and DM + HRP rats (dark gray bars, n = 6). (A) Kidney renin mRNA level. The graph shows a decreased kidney renin mRNA level in the DM rats up to 20 weeks of age. HRP did not affect the kidney renin mRNA level in either control or diabetic rats. (B) Kidney ACE mRNA level. The graph shows a decrease in kidney ACE mRNA level at 28 weeks of age in both the control and diabetic rats. HRP did not affect the kidney ACE mRNA level in either control or diabetic rats. (C) Kidney angiotensinogen mRNA level. The graph shows a decrease in kidney angiotensinogen mRNA level with age. HRP did not affect the kidney angiotensinogen mRNA level in either control or diabetic rats. (D) Kidney cathepsin B mRNA level. The graph shows a decreased kidney cathepsin B mRNA level in the DM rats. HRP did not affect the kidney cathepsin B mRNA level in either control or diabetic rats. *P < 0.05 for diabetic versus control rats.
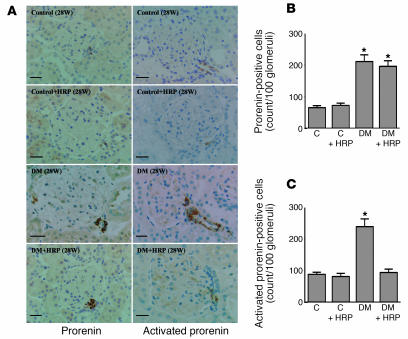
To estimate the kidney levels of prorenin and renin, we performed immunohistochemical analysis of the kidneys collected from rats diabetic for 24 weeks. The anti–rat HRP Ab and anti–rat renin Ab used in the present study bind to total prorenin and activated prorenin, respectively. Because the activated prorenin represents both proteolytically activated prorenin (i.e., renin) and nonproteolytically activated prorenin, the results of immunostaining can provide a hint regarding an activation of prorenin. The prorenin-positive cells were significantly greater in number in the juxtaglomerular area of DM rats compared with C rats. The increased prorenin immunoreactivity was not affected by the HRP treatment (Figure 8, A and B). The immunoreactivity of activated prorenin was also increased in the juxtaglomerular area of DM rats, but it was significantly decreased by the HRP treatment. The level of activated prorenin in the kidneys of DM + HRP rats was similar to that in the kidneys of C and C + HRP rats (Figure 8, A and C). Because HRP inhibited a nonproteolytic activation of prorenin but did not affect a renin that is proteolytically activated prorenin (Figure 2B), these results suggested that the kidneys of DM rats may have an increased level of nonproteolytically activated prorenin. Although localization of renin in the distal nephron has been reported, we were not able to detect a significant staining by anti–HRP or anti–renin in the tubulointerstitial area in the present study, presumably due to very low level of these nephron segments compared with the juxtaglomerular area that can be seen in the sections.
Figure 8.
Kidney levels of total prorenin and activated prorenin in C rats (n = 6), C + HRP rats (n = 6), DM rats (n = 6), and DM + HRP rats (n = 6) at 28 weeks of age. (A) Immunohistochemistry of prorenin and active center of renin that indicates total prorenin and activated prorenin, respectively. The photomicrographs show increases in both total prorenin and activated prorenin at the juxtaglomerular area of diabetic rat kidneys. HRP treatment did not alter the increased staining of total prorenin but inhibited the enhanced staining of activated prorenin. Scale bars: 25 μm. (B) Quantitative analysis of prorenin-positive cells in a juxtaglomerular area. The graph shows an increase in prorenin-positive cells in DM and DM + HRP rats. (C) Quantitative analysis of activated prorenin in a juxtaglomerular area. The graph shows an increase in activated prorenin in DM and its inhibition by HRP treatment. *P < 0.05 versus C rats.
Discussion
We found that the rat HRP binds to the Abs to the handle region of the prorenin prosegment and inhibits the binding of prorenin to Abs for the anti-handle region (Figure 2A). Moreover, from the studies using Abs to HRP and COS-7 cells expressing rat prorenin receptor protein, we obtained in vitro evidence of prorenin activation by prorenin receptor or Ab to HRP and inhibition of the activation by HRP. In this mechanism of prorenin activation, we did not see evidence for proteolytic cleavage of prorenin to active renin, suggesting a conformational change as the mechanism. These results support the view that the prorenin elevation in diabetes results in its activation by a nonproteolytic mechanism that is preventable by HRP working as a decoy, which effectively competes for prorenin binding to its receptor inhibiting the proenzyme in activation. Chronic in vivo continuous infusion of HRP by subcutaneous minipumps prevented the increased urinary protein excretion in diabetic rats to levels similar to those of the control rats. HRP did not affect the body weight or blood glucose levels of either control or diabetic rats during 24-week infusion, however, suggesting that HRP did not improve the impaired pancreatic function by the streptozotocin treatment (Figure 3). Also, HRP completely prevented streptozotocin-induced glomerulosclerosis. Also, chronic administration of HRP completely prevented streptozotocin-induced histologically recognizable glomerulosclerosis (Figure 4). These results indicate that the inhibition of nonproteolytic activation of prorenin by HRP completely inhibited the development of nephropathy in rats with streptozotocin-induced diabetes without affecting the hyperglycemic condition.
The ACE inhibitors and Ang II type 1 receptor blockers have significantly attenuated the urinary protein excretion in streptozotocin-induced diabetic rats (10, 11). Prevention of proteinuria and development of glomerulosclerosis in diabetic rats by HRP, however, suggests that HRP may have superior beneficial effects compared with ACE inhibitors or Ang II type 1 receptor blockers. Nguyen et al. recently found that the prorenin/renin receptor(s) is present in the heart, brain, placenta, liver, pancreas, and kidney and activates prorenin by binding proteolysis (9). If HRP competes for prorenin binding to its receptor resulting in the inhibition of the nonproteolytic activation of prorenin, the complex formation of the prorenin receptor and prorenin may be the major factor in the development of diabetic organ damages. If the complex is also able to activate the ERK1/ERK2 pathways independently of the RAS activation as proposed by Nguyen et al. (9), it is possible that an inhibitor of complex formation between the receptor and prorenin, such as HRP, can completely prevent the development of diabetic organ damages through the inhibition of not only the RAS activation but also the RAS-independent ERK activation.
We measured the RAS components in the plasma of control and diabetic rats (Figure 5). Consistent with previous studies (1, 12), plasma renin activity was significantly lower and plasma prorenin concentration was significantly higher in the DM rats than in the C rats for up to the week 16 of diabetes. The administration of HRP did not affect plasma renin activity or plasma prorenin concentration in either control or the diabetic rats. Although HRP inhibits the interaction between prorenin and its nonproteolytic activators, HRP did not affect the ability of plasma to generate Ang I. The plasma levels of Ang I and II were also lower in the DM rats than in the C rats, and HRP did not influence plasma Ang I or II levels of either control or diabetic rats. In addition, HRP did not affect the BP levels of either control or diabetic rats throughout the 24-week period of HRP infusion. These results suggest that HRP inhibits development of diabetic nephropathy without affecting the circulating RAS or affecting systemic hemodynamics. Since a renin/prorenin receptor, a nonproteolytic activator of prorenin, is exclusively present in tissues but not in circulation (9), HRP may affect tissue RAS but not circulating renin activity or Angs.
There have been conflicting studies showing increased (13), decreased (14), or unchanged (15, 16) kidney Ang II levels in experimental diabetic animals. In these studies, however, kidney Ang II levels were determined at the onset (8 or less weeks) of diabetes without a nephropathy, and to our knowledge, no study had assessed the alterations in the kidney RAS components associated with the development of diabetic nephropathy. In the present study, at 12, 20, and 28 weeks of age (8, 16, and 24 weeks of diabetes), when the diabetic nephropathy developed and progressed, the kidney Ang I and II content of the DM rats markedly increased and was significantly higher than that of the C, C + HRP, and DM + HRP rats (Figure 6, A and B). The kidney Ang I and II content was similar among the C, C + HRP, and DM + HRP rats. The kidney ACE and angiotensinogen mRNA levels were similar in the C, C + HRP, DM, and DM + HRP rats during the 24-week treatment period, consistent with previous studies (17–19) (Figure 7, B and C). However, since high extracellular glucose stimulates the synthesis of angiotensinogen in a concentration-dependent manner in rat proximal tubular cells (20), the present study cannot exclude the possibility that angiotensinogen synthesis regionally increases in the proximal tubule (13, 21) or even in the glomerulus. Previous studies showed that kidney renin mRNA levels increased at the early onset of diabetes in spontaneously or streptozotocin-induced diabetic rats (13, 17, 19, 21) and decreased markedly thereafter (17). The present study demonstrated that both the total kidney renin (proteolytically activated and prorenin) content and kidney renin mRNA level were lower in the DM rats than in the C rats at 12 and 20 weeks of age (8 and 16 weeks of diabetes) when the nephropathy develops, and they were similar at 28 weeks of age (24 weeks of diabetes) when the nephropathy progresses. HRP administration did not alter total kidney renin content or kidney renin mRNA levels in either control or diabetic rats at any age or length of diabetes (Figure 6C and 7A). Thus, the total amount of intrarenal renin and prorenin generated in the kidneys may be decreased during the development of diabetic nephropathy. The total activity of renin and prorenin did increase in the kidneys of diabetic rats, however, because the result of the present study showed the increased staining of the exposed active center of renin/prorenin in the kidneys of diabetic rats and its inhibition by HRP. Previous studies also demonstrated increased ability of the kidney to generate Ang I in diabetic rats, which was called “renal renin concentration” (21). Taken together, during the development of diabetic nephropathy, the kidneys of diabetic rats increased levels of Ang I and II without any changes in renin, ACE, or angiotensinogen synthesis, and continuous infusion of HRP completely inhibited the increased kidney levels of Ang I and II without affecting the kidney levels of renin, ACE, or angiotensinogen mRNA. These results suggest that intrarenal renin activity increases during the development of diabetic nephropathy and that nonproteolytic activation of prorenin significantly contributes to the increased intrarenal renin activity.
The reason why the nonproteolytic activation of prorenin occurs in diabetic organ remains unclear. We believe, however, that the present studies provide a credible explanation. Consistent with previous in vitro and in vivo studies (22, 23), the kidney cathepsin B mRNA levels significantly decreased during the development of diabetic nephropathy (Figure 7D). This result suggests that the decreased prorenin processing can increase the ratio of prorenin to renin in diabetic rat kidneys. In fact, the immunohistochemical staining of prorenin significantly increased in diabetic rat kidneys compared with control rat kidneys (Figure 8, A and B), although total renin content of diabetic rat kidneys was similar to or lower than that of control rat kidneys (Figure 6C). Since both renin and prorenin competitively bind to a renin/prorenin receptor (9), the relative increase in prorenin versus renin could cause more binding of prorenin to its receptor, leading to the nonproteolytic activation of prorenin. This idea was supported by the result of the present study showing that the inhibition of nonproteolytic activation of prorenin by HRP significantly suppresses the increased immunohistochemical staining of exposed active center of renin/prorenin in the kidneys of diabetic rats (Figure 8, A and C). Alternatively, nonproteolytic prorenin-activators, such as a renin/prorenin receptor (9), or their affinity to prorenin might be increased in diabetic organ. Further studies will be needed to determine the reason why the nonproteolytic activation of prorenin occurs in the diabetic organ.
In conclusion, even though diabetic animals have high plasma prorenin levels and low plasma renin levels, suggesting a suppressed circulating RAS (1), Ang II type 1 receptor blockers have a beneficial effect in preventing the development and progression of diabetic organ damage (24, 25). This study clearly demonstrated that the development of diabetic nephropathy is associated with the activated kidney RAS and suggested that nonproteolytic activation of prorenin significantly contributes to the activation of the kidney RAS and the development of diabetic nephropathy. Therefore, we propose that substances that inhibit nonproteolytic activation of prorenin, such as HRP, is useful in drug therapy strategies to prevent diabetic organ damage.
Methods
Preparation of rat prorenin handle peptide and its Ab.
Figure 1 shows the prosegment of rat prorenin. To cover the handle region (position 11–15) (5), we designed a decapeptide, NH2-RILLKKMPSV-COOH, as an HRP of rat prorenin and purified it by HPLC on a C-18 reverse-phase column. The purity and retention time of HPLC were 97.6% and 26.2 minutes, respectively. The mass of the product was 1,185.7, similar to the theoretical mass value (1,186.0). Anti–rat HRP Ab was raised against a peptide, RILLKKMPSVC, conjugated with keyhole limpet hemocyanin in rabbits. HRP was used for determining the titer of the antiserum using a Vectastatin ABC-AP rabbit IgG kit (Vector Laboratories) and as the ligand of an affinity column for purification of the Ab. High-titer antisera were obtained 6 weeks after the first immunization. The affinity gel was prepared by conjugation of Biogel 102 (amine-coupled gel; Bio-Rad Laboratories) through a cysteine residue of antigen peptide as a ligand. The Ab was purified with the affinity column, and the concentration of the purified Ab (3.90 mg/ml) was calculated using an extinction coefficient of 1.35 at 1 mg/ml IgG and 280 nm.
Immunoblot analysis.
The recombinant rat prorenin and renin was subjected to 12% SDS-PAGE and electrophoretically transferred to the polyvinylidene difluoride membrane. Renin was prepared by the trypsin treatment of prorenin; that is, prorenin was incubated with 200 μg/ml of trypsin for 20 minutes at pH 7.4 and 25°C, and then the trypsin action was arrested with 1 mM PMSF. The membrane was incubated separately with rabbit anti-rat renin antiserum (1:1,000) (26) and 3 nM purified rabbit anti–handle region peptide Ab for 1 hour at room temperature in the absence or presence of 10, 100, and 1,000 nM regional peptides of prorenin prosegment. After being washed, the immunocomplex on these sheets was visualized using horseradish peroxidase–conjugated secondary anti–rabbit IgG and diaminobenzidine.
Animals.
We maintained male Sprague-Dawley rats (Charles River Laboratories Inc.) in a temperature-controlled room that was maintained at 23°C and a 12-hour light/12-hour dark cycle, with free access to water and a normal-salt diet rat chow (0.4% NaCl) (CE-2; Nihon Clea). The Keio University Animal Care and Use Committee approved all experimental protocols. At 3 weeks of age, under sodium pentobarbital (50 mg/kg i.p.) anesthesia, we removed the left kidney of 100- to 150-g rats and divided the heminephrectomized rats into four groups: the C, C + HRP, DM, and DM + HRP groups. Diabetic rats received i.p. 10 mM citrate buffer with 65 mg/kg of streptozotocin (Wako Pure Chemical), and nondiabetic control rats received 10 mM citrate buffer alone, at 4 weeks of age. Every 28 days we changed the subcutaneously implanted osmotic minipump (model 2004, for 28-day use; Alzet Osmotic Pumps) containing saline or a HRP (0.1 mg/kg), and we decapitated six rats at 12, 20, and 28 weeks of age to obtain the blood and right kidney of each animal. In our preliminary study, an osmotic minipump with a NH2-SFGR-COOH (0.1 mg/kg, n = 3) or NH2-MTRISAE-COOH (0.1 mg/kg, n = 3) was also implanted in diabetic rats. These peptides, however, did not inhibit the development of glomerulosclerosis or increase in the levels of Ang I and II in the kidneys of diabetic rats.
Experiments.
We measured the systolic arterial BP of the rats at 4, 8, 12, 16, 20, 24, and 28 weeks of age by tail-cuff plethysmography. The 24-hour urine was collected in a metabolic cage, and urinary protein excretion and creatinine were determined with a Micro TP test kit (Wako Pure Chemical) and a creatinine HA test kit (Wako Pure Chemical), respectively. Blood was obtained from the tail vein, and glucose was analyzed with a glucose C test kit (Wako Pure Chemical).
Morphological and immunohistochemical evaluation.
A part of the kidney removed from each animal was fixed in 10% formalin in phosphate buffer (pH 7.4). Paraffin-embedded sections were stained by the PAS method. We quantitatively determined the total area of sclerosis within the glomerular tuft, adopting the semiquantitative scoring system proposed by El-Nahas, et al. (27). A glomerulosclerosis index was derived for each animal by examining 100 glomeruli at ×400 magnification. The severity of glomerulosclerosis was expressed on an arbitrary scale from 0 to 4: grade 0, normal glomeruli; grade 1, presence of mesangial expansion/thickening of the basement membrane; grade 2, mild to moderate segmental hyalinosis/sclerosis involving less than 50% of the glomerular tuft; grade 3, diffuse glomerular hyalinosis/sclerosis involving more than 50% of the tuft; grade 4, diffuse glomerulosclerosis with total tuft obliteration and collapse. The resulting index in each animal was expressed as a mean of all scores obtained.
For immunohistochemical staining, deparaffinized sections were pretreated with proteinase K, the sections were then boiled in citrate buffer with microwaves to unmask antigenic sites, and endogenous biotin was blocked with a biotin-blocking system (X0590; DAKO Corp.). Next, the sections were immersed in 3% H2O2 in methanol to inhibit endogenous peroxidase and then precoated with 1% nonfat milk in PBS to block nonspecific binding. For immunohistochemical staining of type IV collagen and prorenin, a cocktail of rabbit polyclonal Abs to the anti–a2(IV), -a4(IV), and -a5(IV) chains of type IV collagen (1:400; a generous gift of R. Kalluri, Center for Matrix Biology, Beth Israel Deaconess Medical Center) (28) and the rabbit anti–rat HRP Ab were applied, respectively, to the sections as the primary Ab. The sections were incubated with a biotin-conjugated anti–rabbit IgG as the secondary Ab. For immunohistochemical staining of the exposed active center of renin, a goat polyclonal Ab to rat renin that crossreacts with nonproteolytically activated prorenin but not with natural prorenin (1:1,000) (26, 29, 30) was applied to the sections as the primary Ab. The sections were incubated with a biotin-conjugated anti–goat IgG as the secondary Ab. The Ab reactions were visualized by using a VectaStain ABC Standard Kit (Vector Laboratories) and an AEC standard kit (DAKO Corp.) according to the manufacturers’ instructions. We quantitatively determined the immunoreactive type IV collagen-positive area in each glomerulus at ×200 magnification with a Mac SCOPE (version 2.5; Mitani Corp.) and expressed it as a percentage of the whole cross-sectional area of the glomerulus. The levels of prorenin and the exposed active center of renin were evaluated by counting the number of juxtaglomerular cells where the signal intensity of the reaction products was above the visible level. The final overall score was calculated as the means of the values for 100 glomeruli per group of rats.
Measurements of renin and Ang peptides.
Immediately after decapitation, a 3-ml blood specimen was collected into a tube containing 30 μl of EDTA (500 mM), 15 μl of enalaprilat (1 mM), and 30 μl of o-phenanthroline (24.8 mg/ml) and pepstatin (0.2 mM), and plasma samples were obtained by centrifugation. Plasma renin activity was determined with a RIA coated bead kit (Dinabott Radioisotope Institute). Plasma prorenin level was calculated by subtracting plasma renin activity from plasma total (inactive plus active) renin activity, as described previously (31). For the measurement of kidney total renin content, a part of the removed kidney was weighed, placed in 5 ml of buffer containing 2.6 mM EDTA, 1.6 mM dimercaprol, 3.4 mM 8-hydroxyquinoline sulfate, 0.2 mM PMSF, and 5 mM ammonium acetate, homogenized with a chilled glass homogenizer, and then centrifuged. The renin activity of the supernatant was determined as described previously (32). For the determination of kidney Ang I and II content, half of the removed kidney was weighed, placed in ice-cold methanol (10% wt/vol), homogenized with a chilled glass homogenizer, and then centrifuged. The supernatant was then dried and reconstituted in 4 ml of 50 mM sodium phosphate buffer containing 1% albumin. Plasma and reconstituted samples from the kidneys were extracted with a Bond-Elut column (Analytichem Co.), and the eluents were evaporated to dryness and reconstituted in Ang peptide assay diluent. The Ang I and II content was quantitatively determined by RIA using rabbit anti-Ang I antiserum and rabbit anti-Ang II antiserum (Arnel Inc.) as previously reported (33).
Real-time quantitative RT-PCR analysis.
We extracted total RNA from part of the kidney removed from each animal by using an RNeasy Mini Kit (QIAGEN KK) and performed a real-time quantitative RT-PCR by using the TaqMan One-Step RT-PCR Master Mix Reagents Kit with an ABI Prism 7700 HT Detection System (Applied Biosystems Inc.) and probes and primers for the rat genes encoding the following: renin (forward, 5′-GCTACATGGAGAATGGGACTGAA-3′; reverse, 5′-ACCACATCTTGGCTGAGGAAAC-3′; probe, 5′-FAM-CCATCCACTATGGATCAGGGAAGGTCAA-TAMRA-3′); ACE (forward, 5′-CTGCCTCCCAACGAGTTAGAA-3′; reverse, 5′-CGGGACGTGGCCATTATATT-3′; probe, 5′-FAM-AAATGGCACTTGTCTGTCACTGGAGCC-TAMRA-3′); angiotensinogen (forward, 5′-AGCACGGACAGCACCCTATT-3′; reverse, 5′-AGAACTCATGGAGCCCAGTCA-3′; probe, 5′-FAM-TCAACACCTACGTTCACTTCCAAGGGAAGA-TAMRA-3′); cathepsin B (forward, 5′-AAATCAGGCGTATACAAGCATGA-3′; reverse, 5′-GCCCAGAATGCGGATGG-3′; probe, 5′-FAM-CCGGTGATGTGATGGGAGGCCA-TAMRA-3′); and GAPDH (forward, 5′-TGACAACTCCCTCAAGATTGTCA-3′; reverse, 5′-GGCATGGACTGTGGTCATGA-3′; probe, 5′-FAM-TGCATCCTGCACCACCAACTGCTTAG-TAMRA-3′); as described previously (34, 35).
Statistical analyses.
Within-group statistical comparisons were made by one-way ANOVA for repeated measures followed by the Newman-Keuls post hoc test. Differences between two groups were evaluated by two-way ANOVA for repeated measures combined with the Newman-Keuls post-hoc test. A P value of less than 0.05 was considered significant. Data are reported as means ± SEM.
Acknowledgments
This work was supported in part by grants 14571073, 1503340, and 16613002 from the Ministry of Education, Science, and Culture of Japan; a grant from the Takeda Science Foundation (to A. Ichihara); NIH research grant HL-58205; and Health and Labour Sciences Research Grants, Research on Measures for Intractable Diseases, from the Ministry of Health, Labour, and Welfare of Japan. We thank Rika Wakita for her dedicated attention to the many details involved in the preparation of this paper.
Footnotes
Nonstandard abbreviations used: ACE, Ang-converting enzyme; C rat, nondiabetic control rat with saline minipump; C + HRP rat, nondiabetic control rat with HRP-containing minipump; DM + HRP rat, diabetic rat with HRP minipump; DM rat, diabetic rat with saline-containing minipump; HRP, handle region peptide; RAS, renin-Ang system.Conflict of interest: The authors have declared that no conflict of interest exists.
References
- 1.Luetscher JA, Kraemer FB, Wilson DM, Schwartz HC, Bryer-Ash M. Increased plasma inactive renin in diabetes mellitus: a marker of microvascular complications. N. Engl. J. Med. 1985;312:1412–1417. doi: 10.1056/NEJM198505303122202. [DOI] [PubMed] [Google Scholar]
- 2.Deinum J, et al. Increase in serum prorenin precedes onset of microalbuminuria in patients with insulin-dependent diabetes mellitus. Diabetologia. 1999;42:1006–1010. doi: 10.1007/s001250051260. [DOI] [PubMed] [Google Scholar]
- 3.Véniant M, et al. Vascular damage without hypertension in transgenic rats expressing prorenin exclusively in the liver. J. Clin. Invest. 1996;98:1966–1970. doi: 10.1172/JCI119000. [DOI] [PMC free article] [PubMed] [Google Scholar]
- 4.Peters J, et al. Functional significance of prorenin internalization in the rat heart. Circ. Res. 2002;90:1135–1141. doi: 10.1161/01.res.0000019242.51541.99. [DOI] [PubMed] [Google Scholar]
- 5.Suzuki F, et al. Human prorenin has “gate and handle” regions for its non-proteolytic activation. J. Biol. Chem. 2003;278:22217–22222. doi: 10.1074/jbc.M302579200. [DOI] [PubMed] [Google Scholar]
- 6.Maru I, Ohta Y, Murata K, Tsukada Y. Molecular cloning and identification of N-acyl-D-glucosamine 2-epimerase from porcine kidney as a renin-binding protein. J. Biol. Chem. 1996;271:16294–16299. doi: 10.1074/jbc.271.27.16294. [DOI] [PubMed] [Google Scholar]
- 7.Van-Kesteren CAM, et al. Mannose 6-phosphate receptor-mediated internalization and activation of prorenin by cardiac cells. Hypertension. 1997;30:1389–1396. doi: 10.1161/01.hyp.30.6.1389. [DOI] [PubMed] [Google Scholar]
- 8.Admiraal PJJ, et al. Uptake and proteolytic activation of prorenin by cultured human endothelial cells. J. Hypertens. 1999;17:621–629. doi: 10.1097/00004872-199917050-00005. [DOI] [PubMed] [Google Scholar]
- 9.Nguyen G, et al. Pivotal role of the renin/prorenin receptor in angiotensin II production and cellular responses to renin. J. Clin. Invest. 2002;109:1417–1427. doi:10.1172/JCI200214276. doi: 10.1172/JCI14276. [DOI] [PMC free article] [PubMed] [Google Scholar]
- 10.deCavanagh EMV, et al. Enalapril attenuates oxidative stress in diabetic rats. Hypertension. 2001;38:1130–1136. doi: 10.1161/hy1101.092845. [DOI] [PubMed] [Google Scholar]
- 11.Onozato ML, Tojo A, Goto A, Fujita T, Wilcox CS. Oxidative stress and nitric oxide synthase in rat diabetic nephropathy: effects of ACEI and ARB. Kidney Int. 2002;61:186–194. doi: 10.1046/j.1523-1755.2002.00123.x. [DOI] [PubMed] [Google Scholar]
- 12.Hayashi M, Senba S, Saito I, Kitajima W, Saruta T. Changes in blood pressure, urinary kallikrein, and urinary prostaglandin E2 in rats with streptozotocin-induced diabetes. Naunyn Schmiedebergs Arch. Pharmacol. 1983;322:290–294. doi: 10.1007/BF00508345. [DOI] [PubMed] [Google Scholar]
- 13.Zimpelmann J, et al. Early diabetes mellitus stimulates proximal tubule renin mRNA expression in the rat. Kidney Int. 2000;58:2320–2330. doi: 10.1046/j.1523-1755.2000.00416.x. [DOI] [PubMed] [Google Scholar]
- 14.Vallon V, Wead LM, Blantz RC. Renal hemodynamics and plasma and kidney angiotensin II in established diabetes mellitus in rats: effect of sodium and salt restriction. J. Am. Soc. Nephrol. 1995;5:1761–1767. doi: 10.1681/ASN.V5101761. [DOI] [PubMed] [Google Scholar]
- 15.Kennefick TM, Oyama TT, Thompson MM, Vora JP, Anderson S. Enhanced renal sensitivity to angiotensin actionc in diabetes mellitus in the rat. Am. J. Physiol. 1996;271:F595–F602. doi: 10.1152/ajprenal.1996.271.3.F595. [DOI] [PubMed] [Google Scholar]
- 16.Campbell DJ, Kelly DJ, Wilkinson-Berka JL, Cooper ME, Skinner SL. Increased bradykinin and “normal” angiotensin peptide levels in diabetic Sprague-Dawley and transgenic (mRen-2)27 rats. Kidney Int. 1999;56:211–221. doi: 10.1046/j.1523-1755.1999.00519.x. [DOI] [PubMed] [Google Scholar]
- 17.Everett AD, et al. Renin and angiotensinogen expression during the evolution of diabetes. Hypertension. 1992;19:70–78. doi: 10.1161/01.hyp.19.1.70. [DOI] [PubMed] [Google Scholar]
- 18.Kalinyak JE, et al. The renin-angiotensin system in streptozotocin-induced diabetes mellitus in the rat. J. Am. Soc. Nephrol. 1993;4:1337–1345. doi: 10.1681/ASN.V461337. [DOI] [PubMed] [Google Scholar]
- 19.Choi KC, et al. Alterations of intrarenal renin-angiotensin and nitric oxide systems in streptozotocin-induced diabetic rats. Kidney Int. 1997;52(Suppl.):S23–S27. [PubMed] [Google Scholar]
- 20.Zhang S-L, et al. Molecular mechanisms of glucose action on angiotensinogen gene expression in rat proximal tubular cells. Kidney Int. 1999;55:454–464. doi: 10.1046/j.1523-1755.1999.00271.x. [DOI] [PubMed] [Google Scholar]
- 21.Anderson S, Jung FF, Ingelfinger JR. Renal renin-angiotensin system in diabetes: functional, immunohistochemical, and molecular biological correlations. Am. J. Physiol. 1993;265:F477–F486. doi: 10.1152/ajprenal.1993.265.4.F477. [DOI] [PubMed] [Google Scholar]
- 22.Leehey DJ, Song RH, Alavi N, Singh AK. Decreased degradative enzymes in mesangial cells cultured in high glucose media. Diabetes. 1995;44:929–935. doi: 10.2337/diab.44.8.929. [DOI] [PubMed] [Google Scholar]
- 23.Song RH, Singh AK, Leehey DJ. Decreased glomerular proteinase activity in the streptozotocin diabetic rat. Am. J. Nephrol. 1999;19:441–446. doi: 10.1159/000013492. [DOI] [PubMed] [Google Scholar]
- 24.Lewis EJ, et al. Renoprotective effect of the angiotensin-receptor antagonist irbesartan in patients with nephropathy due to type 2 diabetes. N. Engl. J. Med. 2001;345:851–860. doi: 10.1056/NEJMoa011303. [DOI] [PubMed] [Google Scholar]
- 25.Brenner BM, et al. Effects of losartan on renal and cardiovascular outcomes in patients with type 2 diabetes and nephropathy. N. Engl. J. Med. 2001;345:861–869. doi: 10.1056/NEJMoa011161. [DOI] [PubMed] [Google Scholar]
- 26.Takii Y, Figueiredo AFS, Inagami T. Application of immunochemical methods to the identification and characterization of rat kidney inactive renin. Hypertension. 1985;7:236–243. doi: 10.1161/01.hyp.7.2.236. [DOI] [PubMed] [Google Scholar]
- 27.El-Nahas AM, Bassett AH, Cope GH, Carpentier JE. Role of growth hormone in the development of experimental renal scarring. Kidney Int. 1991;40:29–34. doi: 10.1038/ki.1991.175. [DOI] [PubMed] [Google Scholar]
- 28.Kalluri R, Shield CF, Todd P, Hudson BG, Neilson EG. Isoform switching of type IV collagen is developmentally arrested in X-linked Alport syndrome leading to increased susceptibility of renal basement membranes to endoproteolysis. J. Clin. Invest. 1997;99:2470–2478. doi: 10.1172/JCI119431. [DOI] [PMC free article] [PubMed] [Google Scholar]
- 29.Inagami T, Murakami T, Higuchi K, Nakajo S. Roles of renal and vascular renin in spontaneous hypertension and switching of the mechanism upon nephrectomy. Am. J. Hypertens. 1991;4:15S–22S. doi: 10.1093/ajh/4.1.15s. [DOI] [PubMed] [Google Scholar]
- 30.Iwai N, Inagami T, Ohmichi N, Kinoshita M. Renin is expressed in rat macrophage/monocyte cells. Hypertension. 1996;27:399–403. doi: 10.1161/01.hyp.27.3.399. [DOI] [PubMed] [Google Scholar]
- 31.Hirota N, Ichihara A, Koura Y, Hayashi M, Saruta T. Phospholipase D contributes to transmural pressure control of prorenin processing in juxtaglomerular cell. Hypertension. 2002;39:363–367. doi: 10.1161/hy02t2.102807. [DOI] [PubMed] [Google Scholar]
- 32.Kobori H, et al. Thyroid hormone stimulates renin synthesis in rats without involving the sympathetic nervous system. Am. J. Physiol. 1997;272:E227–E232. doi: 10.1152/ajpendo.1997.272.2.E227. [DOI] [PMC free article] [PubMed] [Google Scholar]
- 33.Nishiyama A, Seth DM, Navar LG. Renal interstitial fluid angiotensin I and angiotensin II concentrations during local angiotensin-converting enzyme inhibition. J. Am. Soc. Nephrol. 2002;13:2207–2212. doi: 10.1097/01.asn.0000026610.48842.cb. [DOI] [PubMed] [Google Scholar]
- 34.Naito Y, Tsujino T, Fujioka Y, Ohyanagi M, Iwasaki T. Augmented diurnal variations of the cardiac renin-angiotensin system in hypertensive rats. Hypertension. 2002;40:827–833. doi: 10.1161/01.hyp.0000039960.66987.89. [DOI] [PubMed] [Google Scholar]
- 35.Wasselius J, Wallin H, Abrahamson M, Ehinger B. Cathepsin B in the rat eye. Graefe’s Arch. Clin. Exp. Ophthalmol. 2003;241:934–942. doi: 10.1007/s00417-003-0782-x. [DOI] [PubMed] [Google Scholar]


