Abstract
Objectives
To assess the effect of image registration and averaging on the visualization and quantification of the radial peripapillary capillary (RPC) network on optical coherence tomography angiography (OCTA).
Methods
Twenty-two healthy controls were imaged with a commercial OCTA system (AngioVue, Optovue, Inc.). Ten 10x10° scans of the optic disc were obtained, and the most superficial layer (50-μm slab extending from the inner limiting membrane) was extracted for analysis. Rigid registration was achieved using ImageJ, and averaging of each 2 to 10 frames was performed in five ~2x2° regions of interest (ROI) located 1° from the optic disc margin. The ROI were automatically skeletonized. Signal-to-noise ratio (SNR), number of endpoints and mean capillary length from the skeleton, capillary density, and mean intercapillary distance (ICD) were measured for the reference and each averaged ROI. Repeated measures analysis of variance was used to assess statistical significance. Three patients with primary open angle glaucoma were also imaged to compare RPC density to controls.
Results
Qualitatively, vessels appeared smoother and closer to histologic descriptions with increasing number of averaged frames. Quantitatively, number of endpoints decreased by 51%, and SNR, mean capillary length, capillary density, and ICD increased by 44%, 91%, 11%, and 4.5% from single frame to 10-frame averaged, respectively. The 10-frame averaged images from the glaucomatous eyes revealed decreased density correlating to visual field defects and retinal nerve fiber layer thinning.
Conclusions
OCTA image registration and averaging is a viable and accessible method to enhance the visualization of RPCs, with significant improvements in image quality and RPC quantitative parameters. With this technique, we will be able to non-invasively and reliably study RPC involvement in diseases such as glaucoma.
Introduction
The radial peripapillary capillaries (RPCs) make up a distinctive vascular network within the retinal nerve fiber layer (RNFL) around the optic disc. Their presence appears to be intimately tied to the highly metabolically active retinal ganglion cell axons that compose the RNFL [1–5]. Because of their parallel structure and paucity of anastomoses, RPCs are thought to be especially vulnerable to retinal pathologies such as glaucoma and retinal vascular occlusion [6, 7]. Though correlations between RNFL thickness and RPC volume have been found in previous studies, this neurovascular relationship remains poorly understood in disease. Studying this relationship in vivo has remained challenging due to the limitations of conventional clinical imaging tools, such as intravenous fluorescein angiography (IV FA). Adaptive optics scanning light ophthalmoscopy (AOSLO) equipped with fluorescein angiography or a nonconfocal detection scheme has had the most success with imaging RPCs in vivo [8–11]. However, the technique can be time-consuming and as such is not yet clinically optimized. The need for a clinically accessible and reliable method of visualizing this microvascular network is critical to help advance our understanding of ocular pathology and identify novel biomarkers for diagnosing these diseases.
Optical coherence tomography angiography (OCTA) is a novel technology that allows for non-invasive microvascular imaging through the use of motion contrast image processing techniques [12–20]. It has been validated against both histology and other in vivo vascular imaging including IV FA and AOSLO [21–26]. Several groups have proposed methods to quantify these angiographic images, including vessel area density [27–30], vessel skeleton density [27, 31], intercapillary distance [26], and non-perfused area [29].
However, limitations introduced by the optics of the eye, the optics of the imaging system, and eye movement during image acquisition challenge our ability to image small-caliber, dense capillary beds such as the RPCs [32]. One method to compensate for these issues may be through en face image averaging, echoing the technique used to improve OCT image quality [33–36]. Unlike previous applications of registration and averaging in OCTA which were largely focused on correcting for eye motion artifacts [34, 37–39], our proposed method would require that a patient undergo multiple scans in a single session for offline image registration and averaging. While scan times are short (6–8 seconds per OCTA) and the light exposure is limited, subjecting patients to multiple scans can be difficult and tiring. In order to obtain more reliable quantification of RPCs while maximizing patient comfort and minimizing duration of imaging sessions, we used image registration and averaging to enhance the quality of OCTA images and used quantitative methods to determine the optimal number of images needed for vascular analysis.
Materials and Methods
Subjects
This study was conducted in accordance with the tenets of the Declaration of Helsinki and was approved by the Institutional Review Boards at both the New York Eye and Ear Infirmary of Mount Sinai and the Medical College of Wisconsin. Written informed consent was obtained from all study participants. Twenty-two subjects with no history of ocular disease were recruited for this study. In addition, 3 patients with primary open angle glaucoma with defects on Humphrey visual fields (SITA Standard 24–2) were recruited. Diagnoses were determined through chart review. Inclusion criteria were as follows: normal anterior segment, clear natural lens, clear media, best corrected visual acuity of 20/80 or better in the eye imaged, and excellent fixation. Exclusion criteria included nuclear sclerosis greater than 2+ and presence of any systemic disease with ocular manifestations, such as diabetes. For subjects with pupils smaller than 5 mm in dim lighting, one drop of 2.5% phenylephrine hydrochloride ophthalmic solution (Paragon BioTeck, Inc., Portland, OR) and two drops of 1% tropicamide ophthalmic solution (Akorn, Inc., Lake Forest, IL) were administered to the eye imaged. In order to correct for individual retinal magnification, axial lengths were obtained using an IOL Master (Carl Zeiss Meditec, Inc., Dublin, CA) [40].
OCTA and OCT image acquisition
All subjects were imaged using a commercial spectral domain OCT (RTVue XR Avanti, Optovue, Inc., Fremont, CA) with a scan rate of 70,000 A-scans/second, scan beam wavelength of 840 ± 10 nm, and bandwidth of 45 nm. The maximum exposure power at the pupil is 750 μW. OCTA images were generated using a standard commercial software (AngioVue version 2015.100.0.35, Optovue, Inc., Fremont, CA), which employs the split-spectrum amplitude decorrelation angiography algorithm [12]. Ten 10x10° (304x304 pixels) scans were obtained of the optic disc. The scanning raster was positioned to place the nasal disc margin adjacent to the edge of the image in order to expose more retinal area temporal to the disc. There were 304 A-scans per B-scan and 608 total B-scans per volumetric raster scan with 2 consecutive B-scans taken at each location. Each OCTA was composed of two volumetric raster scans (X-fast and Y-fast), each requiring 3–4 seconds. Subjects were encouraged to take breaks every 2–3 OCTAs or as needed. Circular OCT scans, 12° in diameter centered at the optic nerve head (Spectralis HRA+OCT, Heidelberg Engineering, Inc., Heidelberg, Germany), were obtained in order to measure peripapillary RNFL thickness in the three glaucomatous eyes. Central 24–2 Swedish Interactive Thresholding Algorithm (SITA) Standard Humphrey Visual Fields completed within 6 months of OCTA imaging were obtained from the three patients’ medical records.
Image registration
The most superficial OCTA slab (50 μm deep from the inner limiting membrane [ILM]) (Fig 1B) from AngioVue was used for image analysis in order to isolate only the most superficial layer of RPCs. For each of the eyes imaged, the OCTA with the highest contrast and the least motion artifact (i.e. fewest vertical and horizontal artifactual lines) was selected as the reference image; the other nine OCTAs were registered to this reference image using the Register Virtual Stack Slices plug-in on Image J; we employed a rigid extraction model with elastic bUnwarpJ splines registration [41]. For sets of images in which registration failed using the superficial OCTA slab due to low contrast, a deeper layer with larger blood vessels (vitreous to 150 μm below the ILM) was registered, and the transformations from this set of deep layer images was then applied to the superficial OCTAs using the Transform Virtual Stack Slices plug-in on ImageJ.
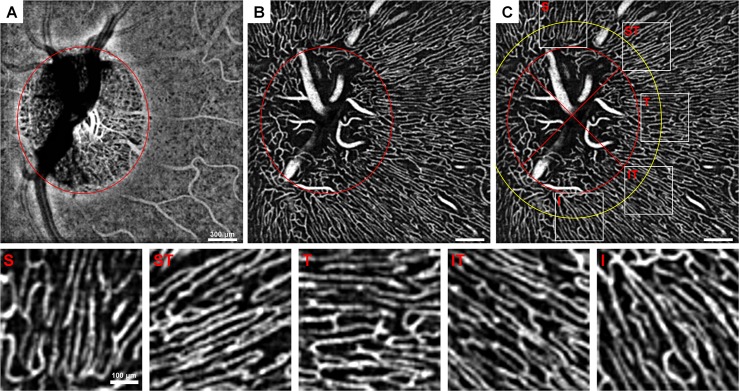
Fig 1. Peripapillary ROI selection demonstrated on 10-frame averaged OCTAs.
(A) Choroidal OCTA and (B) superficial OCTA layers displaying the optic disc margin approximation (red ellipse). (C) Superficial layer with optic disc margin (red ellipse), 1° away from the optic disc margin (yellow ellipse), demarcation of the quadrants (cross in inner ellipse), and the five ~2x2° ROIs from each region. S = superior, ST = superotemporal, T = temporal, IT = inferotemporal, I = inferior. Images were contrast-stretched for display purposes only.
Defining regions of interest and averaging
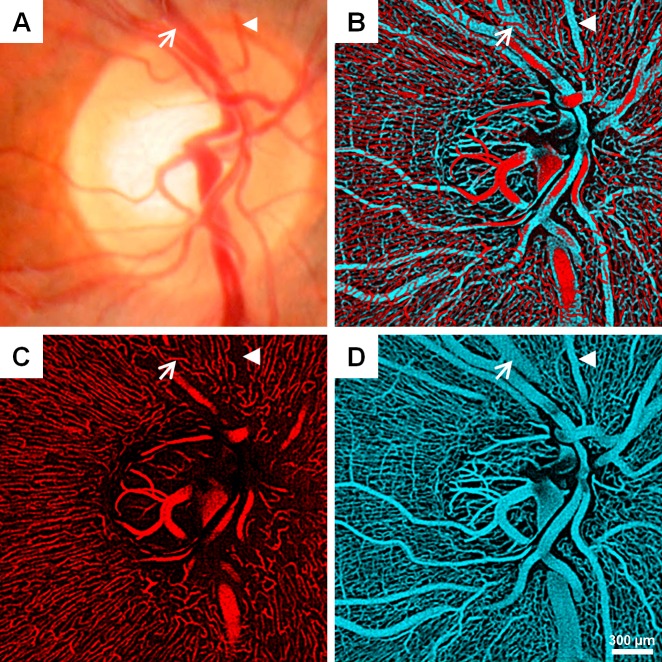
First, the optic disc margin was manually approximated into an ellipse based on the choroidal OCTA layer (75 μm above the retinal pigment epithelium to the end of the OCT image) using a custom MATLAB program (The MathWorks Inc., Natick, MA) (Fig 1A and 1B). The regions of interest (ROIs) were defined as ~2x2° (60x60 pixel) boxes centered ~1° from the optic disc margin located in areas superior, superotemporal, temporal, inferotemporal, and inferior to the disc (Fig 1C). The ROIs were adjusted manually within these areas in order to include only capillaries and avoid major vessels. Capillary-free zones around arterial vessels may appear as artifactual areas of capillary dropout on this superficial slab if there is a deeper artery (Fig 2). Therefore, deeper OCTA layers were also checked when placing ROIs in order to avoid these zones. Within each ROI, the OCTAs were averaged to create 2- to 10-frame averaged images. If the ROI contained one or more frames of poor quality (e.g. excessive eye motion) or frames with areas missing within the ROI (usually in superior or inferior regions), the entire ROI was excluded from analysis. Of the 110 possible ROIs imaged, 11 ROIs were excluded due to poor image quality or partial coverage.
Fig 2. Qualitative features of the RPC network in a healthy control.
(A) Fundus photograph. (B) Overlay of superficial (red; ILM to 50-μm-deep slab) and deep (cyan; ILM to 150-μm-deep slab) vasculature around the optic disc displayed separately in (C) and (D), respectively. Arterial and venous vessels (arrowhead and arrow, respectively) are identified on each image. Note what looks like an area of non-perfusion on the superficial layer actually overlies a deeper artery seen in (D) (arrowhead) and the capillaries course over a large vein in (D) (arrow).
Computation of signal-to-noise ratio
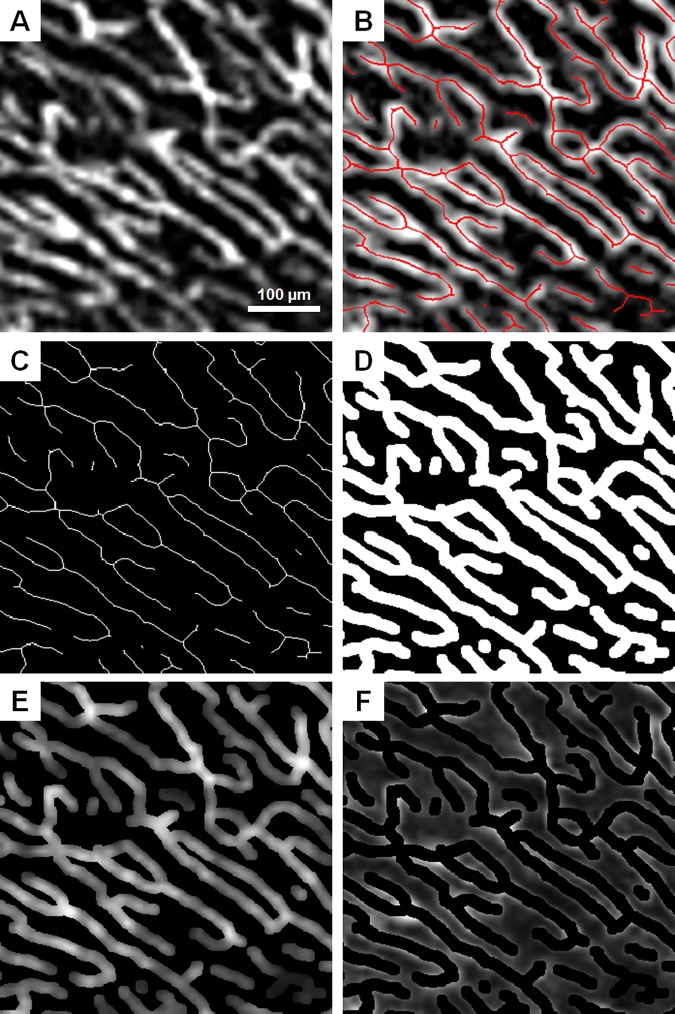
Signal and background regions were defined on the 10-frame averaged for each ROI using a mask-based segmentation (Fig 3) [42]. First, the 10-frame averaged ROI was resized by a factor of 6 to 360x360 pixels using bicubic interpolation. The 10-frame averaged ROI was then contrast stretched, and adaptive thresholding over 50x50 pixels was performed (Fig 3A). Next, the thresholded image was skeletonized (Fig 3B and 3C). The skeleton was dilated to approximately 15 μm in diameter in order to create a mask (Fig 3D). This 15-μm diameter capillary mask was chosen based on previous histological studies that have sized RPCs at about 9 μm in diameter [2, 26] and our previous work that OCTA overestimates the diameter of vessels by approximately 6 μm [23]. Signal was defined as the region within the dilated skeleton mask, whereas background was defined as the inverse of the mask (Fig 3E and 3F). This mask generated from the 10-frame averaged ROI was applied on the +corresponding reference and each averaged ROI.
Fig 3. Signal and background intensity extraction using mask-based segmentation on the 10-frame averaged ROI.
(A) 10-frame averaged ROI. (B) ROI with skeletonization superimposed in red. (C) Skeleton only. (D) Skeleton dilated to 15 μm in diameter. (E) Signal mask from dilated skeleton superimposed with the ROI. (F) Background mask from inverse of dilated skeleton superimposed with the ROI. Images were contrast-stretched for display purposes only.
Mean and standard deviation of the pixel intensity within the signal and background regions were obtained for the single-frame and each of the averaged images. Signal-to-noise ratio (SNR) was then calculated using the following formula:
Where μI is the mean intensity and σI is the standard deviation of the intensity.
Capillary endpoints and mean capillary segment length
Skeletonizations were generated for the reference and each averaged (2- to 10-frame averaged) ROI in the same manner as the 10-frame averaged skeleton generated for the mask used to define signal and background regions. The skeletons were then used to automatically generate the number of endpoints (Fig 4) using the MATLAB function bwmorph. The mean length of segments was calculated as the total length of the skeleton divided by the number of segments with each segment defined as continuous pixels between endpoints and/or branch points generated from the bwmorph function.
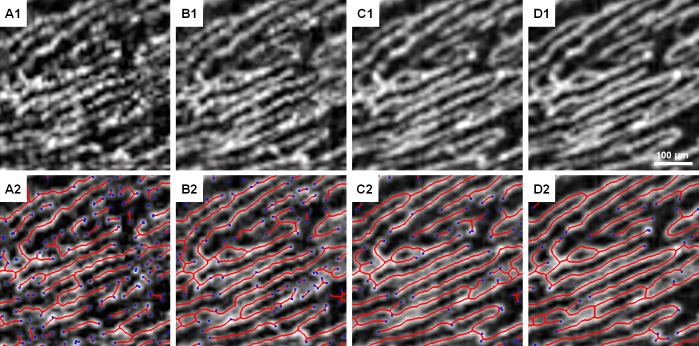
Fig 4. Skeletonization and endpoint identification on different numbers of averaged frames from the same ROI.
(A1 & A2) Reference frame. (B1 & B2) 2-frame averaged. (C1 & C2) 5-frame averaged. (D1 & D2) 10-frame averaged. Blue dots denote endpoints of the skeleton in red. Images were contrast-stretched for display purposes only.
Capillary density and intercapillary distance
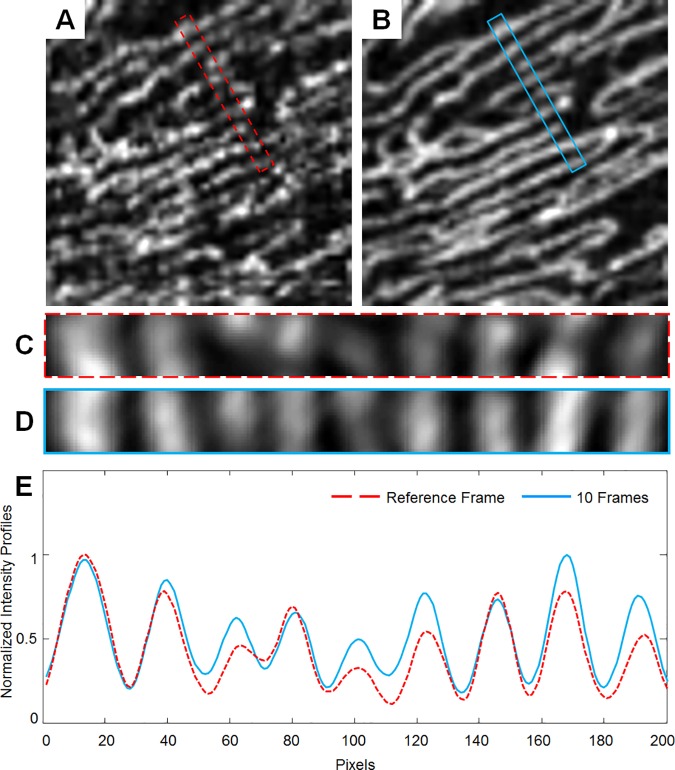
Using the automatically generated skeletons, RPC density was calculated as the length of the pixels in the skeleton divided by the ROI area for the reference and each averaged ROI. For intercapillary distance (ICD), a 0.1x1° sampling box was placed within each ROI, positioning the longest dimension of the box perpendicular to the direction of the vessels. An averaged intensity profile was then generated from this sampling box, and ICD was defined as the mean peak-to-peak distance (Fig 5). The height of the sampling box is about twice the average diameter of capillaries. This ensures that if there were capillaries perpendicular to the RPCs, they would have reduced contribution to the averaged intensity profile and thus minimizing their impact on the peak-to-peak measurement and ICD calculation.
Fig 5. Intercapillary distance measurement.
(A) Reference frame and (B) 10-frame averaged ROI with 0.1x1° sampling box outlined in red dashed and blue lines, respectively. (C & D) Sampling box from (A & B) enlarged. (E) Normalized intensity profiles generated from the sampling box. ICD is calculated as the peak-to-peak distance. Images were contrast-stretched for display purposes only.
Statistics
Statistical analysis was performed using SPSS 20.0 Statistical Software (IBM Corporation, Chicago, IL). One-way repeated measures analysis of variance (RM-ANOVA) with a Greenhouse-Geisser correction and post hoc testing using the Bonferroni correction were performed. Significance level was set at 0.05.
Capillary density in glaucoma patients
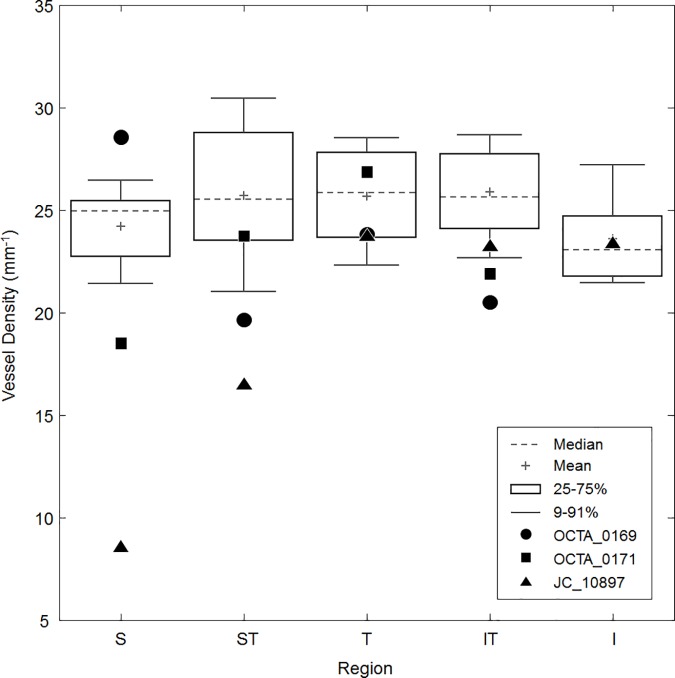
Using the 10-frame averaged images, healthy control density data from each peripapillary region were used to generate a box plot, and the density data from each glaucoma patient was plotted in the corresponding regions.
Results
Subject characteristics
The mean ± SD age of the 22 healthy controls was 44 ± 15 years (range: 21 to 71 years). Mean ± SD age for the 3 patients with glaucoma was 60 ± 3 years.
General RPC appearance on single-frame and averaged images
As expected, the vessels appeared smoother and more continuous with increasing number of frames. Signal that appeared to be noise on the single-frame image became clearly vessels or background after averaging (Fig 4). Motion artifacts from single-frame images became less prominent. On the averaged ROIs, the parallel organization and sparse anastomoses characteristic of the RPCs were better appreciated.
Signal-to-noise ratio
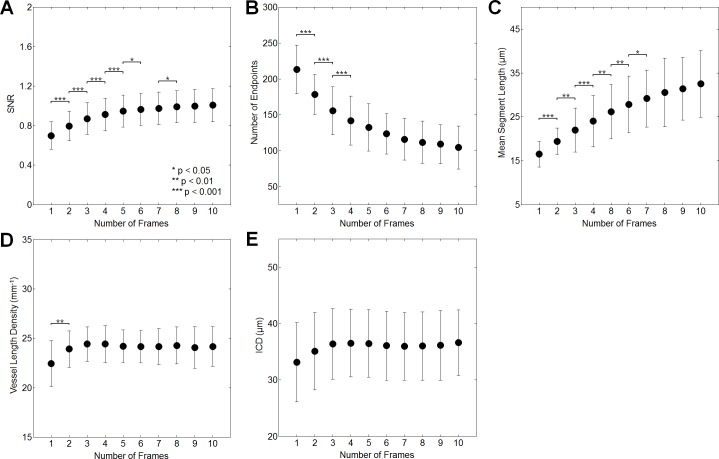
When comparing the reference frame to the 10-frame averaged ROI, SNR increased by 44.1% superiorly, 46.1% superotemporally, 45.8% temporally, 42.8% inferotemporally, and 43.3% inferiorly (Table 1). This represents an average increase of 44.4% in SNR for all 5 ROIs. RM-ANOVA post hoc testing revealed that no further improvement in SNR was seen beyond averaging 6 frames superiorly, 9 frames superotemporally, 5 frames temporally, 8 frames inferotemporally, and 5 frames inferiorly (Fig 6; S1 Fig; Table 2).
Table 1. Percent difference from the reference to 5-frame and 10-frame averaged ROI in quantitative metrics for each region.
| Superior | Superotemporal | Temporal | Inferotemporal | Inferior | ||||||
|---|---|---|---|---|---|---|---|---|---|---|
| Number of Frames | 5 | 10 | 5 | 10 | 5 | 10 | 5 | 10 | 5 | 10 |
| SNR | 35.7 | 44.1 | 36.1 | 46.1 | 37.0 | 45.8 | 33.9 | 42.8 | 34.4 | 43.3 |
| Number of Endpoints | -37.8 | -50.9 | -39.1 | -52.2 | -38.9 | -51.2 | -41.1 | -54.0 | -35.0 | -47.6 |
| Mean Segment Length | 58.9 | 97.5 | 54.6 | 87.5 | 65.5 | 106.7 | 53.4 | 88.2 | 42.2 | 75.3 |
| Capillary Density | 7.8 | 7.8 | 10.5 | 10.5 | 13.5 | 13.8 | 12.1 | 13.2 | 8.2 | 7.7 |
| ICD | 10.0 | 10.5 | 4.1 | 6.5 | -5.5 | -4.4 | 1.1 | 1.5 | 8.2 | 8.6 |
SNR, signal-to-noise ratio; ICD, intercapillary distance.
Fig 6. Comparison of quantitative measures among reference and averaged images in the superior region (for other regions, please see S1 Fig).
Improvements in SNR (A) remain significant up to 6 frames averaged. Decreases in the number of skeleton endpoints (B) remain significant up to 4 frames averaged. Increases in the mean length of skeleton segments (C) remain significant up to 7 frames averaged. Increases in vessel density (D) remain significant up to 2 frames averaged. ICD (E) does not change significantly among frames.
Table 2. Optimum number of averaged frames for each quantitative metric.
| Superior | Superotemporal | Temporal | Inferotemporal | Inferior | |
|---|---|---|---|---|---|
| SNR | 6 | 9 | 5 | 8 | 5 |
| Number of Endpoints | 4 | 4 | 6 | 5 | 4 |
| Mean Segment Length | 7 | 6 | 5 | 5 | 5 |
| Capillary Density | 2 | 2 | 3 | 2 | 2 |
| ICD | 1 | 1 | 1 | 1 | 1 |
SNR, signal-to-noise ratio; ICD, intercapillary distance.
Skeletonization metrics
When comparing the reference to the 10-frame averaged ROI, the number of skeleton endpoints decreased by 50.9% superiorly, 52.2% superotemporally, 51.2% temporally, 54.0% inferotemporally, and 47.6% inferiorly (Table 1). This represents an average decrease of 51.2% for all ROIs. RM-ANOVA post hoc testing revealed that no further reduction in the number of skeleton endpoints was seen beyond averaging 4 frames superiorly, 4 frames superotemporally, 6 frames temporally, 5 frames inferotemporally, and 4 frames inferiorly (Fig 6; S1 Fig; Table 2).
The mean length of the skeleton segments increased by 97.5% superiorly, 87.5% superotemporally, 106.7% temporally, 88.2% inferotemporally, and 75.3% inferiorly in comparing the reference to the 10-frame averaged ROI (Table 1). This represents an average increase of 91.0% across all ROI. RM-ANOVA post hoc testing revealed that no further increase in the mean skeleton segment length was seen beyond averaging 7 frames superiorly, 6 frames superotemporally, 5 frames temporally, 5 frames inferotemporally, and 5 frames inferiorly (Fig 6; S1 Fig; Table 2).
Density and ICD
When comparing the reference frame to the 10-frame averaged ROI, capillary density increased by 7.8% superiorly, 10.5% superotemporally, 13.8% temporally, 13.2% inferotemporally, and 7.7% inferiorly (Table 1). This represents an average increase of 10.6% over all ROI. RM-ANOVA post hoc testing revealed that no further increase in capillary density was seen beyond averaging 2 frames superiorly, 2 frames superotemporally, 3 frames temporally, 2 frames inferotemporally, and 2 frames inferiorly (Fig 6; S1 Fig; Table 2).
When comparing the reference frame to the 10-frame averaged images, ICD changed by 10.5% superiorly, 6.5% superotemporally, -4.4% temporally, 1.5% inferotemporally, and 8.6% inferiorly (Table 1). This represents an average change of 4.5% across all ROI. Mean ICD data from the superior and superotemporal regions were significant on RM-ANOVA, but post hoc testing in these regions revealed no significant pair-wise differences in comparing sequential numbers of frames averaged. The other three regions showed no significant differences on RM-ANOVA (Fig 6; S1 Fig; Table 2).
Capillary density in glaucomatous eyes
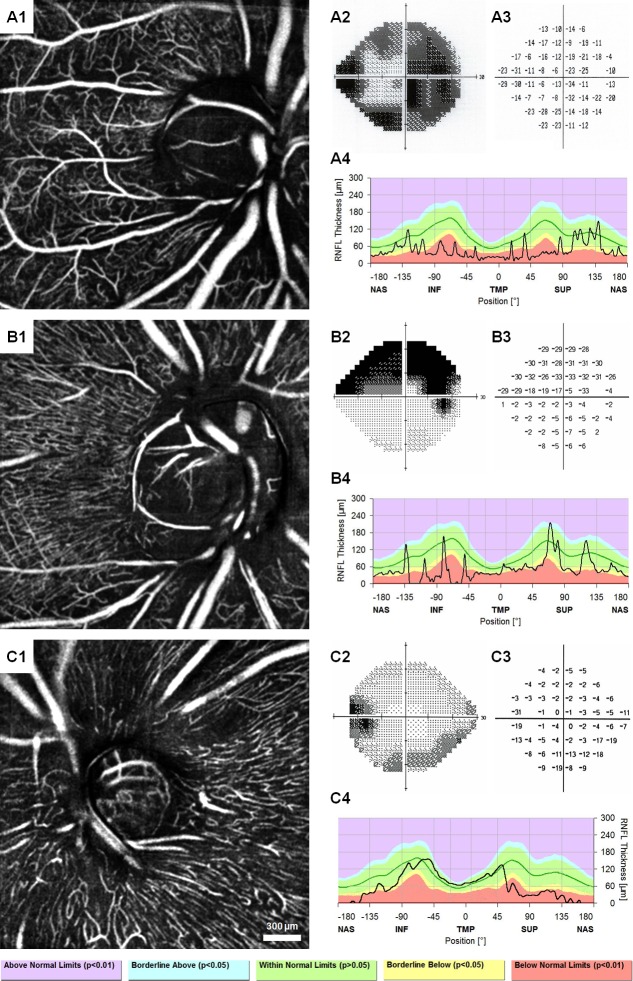
Fig 7 shows the 10-frame averaged OCTA images of each subject with POAG in addition to their Humphrey visual fields and RNFL thickness plots. Compared to controls, there was lower density in regions corresponding to visual field defects and RNFL thinning in the POAG patients (Fig 8). Of note, the parallel structure of the RPCs seen in the healthy controls was replaced by a mesh-like network of vessels and there were more large caliber vessels visible in the glaucomatous eyes compared to controls.
Fig 7. Ten-frame averaged OCTA, Humphrey visual fields with total deviation, and peripapillary RNFL thickness profiles of three patients with POAG.
OCTA_0169 shows the loss of the superficial RPC layer and revealing of the deeper vascular network due to severe RNFL thinning (A1), corresponding with diffuse visual field defects (A2 & A3) and RNFL thinning (A4). OCTA_0171 shows loss of RPC layer superiorly, inferotemporally, and inferiorly on OCTA (B1), somewhat corresponding to a superior hemifield defect (B2 & B3) and prominent RNFL thinning in the inferior region with borderline values in the other regions (B4). JC_10897 shows loss of the RPC layer superficial and superotemporal to the disc (C1), corresponding to the inferior arcuate defect (C2 & C3) and RNFL thinning superiorly and superotemporally (C4). Images were contrast-stretched for display purposes only.
Fig 8. Box plot of healthy control vessel density data generated from 10-frame averaged images overlaid with data from three patients with POAG.
OCTA_0169 (circle) has low density in all regions except superiorly, roughly corresponding the diffuse visual field defects and RNFL thinning from Fig 6. OCTA_0171 (square) has low density in all regions except temporally; this pattern is well-correlated with the RNFL thickness plot, though the visual field does show some minor defects in the superior and superotemporal regions. JC_10897 (triangle) shows densities well below normal in the superior and superotemporal regions, corresponding to the inferior visual field defect and superior RNFL thinning. Density was not measured in the inferior region for OCTA_0169 and OCTA_0171 due to constraints of the image size and presence of many large vessels.
Discussion
In this study, we showed that OCTA image registration and averaging 1) increased SNR significantly up to 5–9 frames averaged, 2) improved skeletonization metrics up to 4–7 frames averaged, 3) increased density up to 2–3 frames averaged, and 4) had no significant effect on ICD. This work is a novel application of a well-established approach to improve image quality, and we were able to use quantitative parameters to evaluate this improvement and its impact on vascular measures such as capillary density.
Histologically, the RPCs form a two dimensional network within the superficial portion of the RNFL and have a characteristic appearance: long, straight capillaries with few anastomoses running parallel to the nerve fiber bundles [1, 2, 8, 24, 43, 44]. The vessels imaged in the superficial 50-μm slab for this study are morphologically consistent with this description, and we did not observe the net-like configuration of the deeper vessels in the healthy controls. Moreover, they course over large venous vessels but exhibit capillary-free zones around arterial vessels as previously observed (Fig 2). Using our technique, we were also able to remove some of the image artifacts, such as discontinuous vessel segments, non-uniform appearance, and eye motion artifacts. Quantitatively, we found that mean ICD of the RPCs ranged from 30 to 40 μm, which is in agreement with prior histological studies [2, 26]. Our regional ICD patterns were similar to findings from Yu et al. in that ICD was lowest in the superotemporal, temporal, and inferotemporal areas on OCTA [26]. Prior reports on peripapillary vessel density using histology and OCTA have utilized area coverage density in contrast to our vessel length density method. In order to compare our data from earlier findings, we can estimate area coverage density by assuming that RPC diameter is uniformly 9 μm (based on previous histologic reports) and mathematically converting vessel length density. This calculation yields mean values between 21 and 24% for our study. These values are within the 10–30% range seen on histology [2, 43, 44].
Our results suggest that the number of frames needed for averaging varies depending on the measurement of interest. For higher quality images and accurate vascular segmentation, at least 4–5 frames are necessary. These factors may be important in investigating vascular branching patterns through fractal analysis, for example, especially if automated methods are used to model the vasculature. On the other hand, density and ICD require only 1–3 frames to generate consistent data. A possible explanation for the ICD findings may be that our use of an averaged intensity profile within a 2-dimensional sampling box instead of along a line was in effect similar to averaging the image itself. Moreover, the larger the height of the sampling box, the more averaged the results would be. This effect may explain why there was no significant effect of our technique on ICD measurements. Capillary density and ICD can be used to study vascular changes in pathology involving the RPC network, such as glaucoma or ischemic retinal diseases. Our method of measuring ICD in particular has the advantage of not requiring image averaging to produce reliable data, and thus can be used on single scans as a local indication of capillary density in images with relatively poorer quality.
Furthermore, we observed differences in the number of averaged frames needed to optimize our parameters among the peripapillary regions, especially in SNR. The increased number of frames needed to optimize SNR in the ROIs with diagonally-oriented vessels (i.e. superotemporal and inferotemporal) may be due to the slight differences in mask dilation between these regions and the horizontally- or vertically-oriented regions. Since the width of the mask is rounded to the nearest single pixel, it is slightly wider in the superotemporal and inferotemporal ROIs, leading to inclusion of the edges of the vessels which have more variations in intensity than the center. This slight difference in segmentation may be the reason for the higher number of frames needed to optimize SNR. The variations in the optimization of the other parameters are relatively small. It is possible that with a larger sample size, this difference may become negligible.
The limitations to this study are as follows. 1) The mask-based segmentation with a uniform capillary mask diameter does not perfectly segment background and signal. There may be residual signal in the background and vice versa (Fig 3E and 3F). 2) The OCTA instrument used in this study currently requires that the subject have excellent fixation. This issue may be resolved with eye motion tracking. 3) Our method of setting the lower limit of the OCTA slab as 50 μm below the ILM results in the inclusion of deeper, non-RPC vessels in patients with RNFL thinning, as seen in the POAG subjects in this study (Fig 7). This phenomenon may lead to falsely normal vessel density in some patients despite obvious RPC loss and limits our ability to use ICD as a quantitative measure. 4) In peripapillary regions with thicker RNFL, such as superiorly and inferiorly, we may be missing some deeper RPCs by using the uniform 50-μm slab from the ILM. 5) The manual sampling placement for ICD may have not reflected the ICD in the whole region. A possible solution to this limitation is perhaps utilizing a sliding sampling window moving perpendicularly to the RPCs to sample all possible ICDs at the peripapillary region.
Conclusions
Image registration and averaging is a simple method to enhance the overall appearance and quantitative outputs of RPCs from OCTA. This technique allows clinicians and researchers to use an existing instrument to produce reliable, meaningful angiographic data. Moreover, by finding minimal numbers of frames needed for various quantitative parameters, we can maximize patient comfort without compromising the quality of our data. With improvements in eye motion tracking and signal detection, perhaps even fewer frames will be necessary. Using this technique, future studies will be able to extract more reliable data from OCTA in order to elucidate the role of peripapillary microvascular changes in diseases such as glaucoma.
Supporting Information
Improvements in SNR (1st column) remain significant up to 5 to 9 frames averaged. Decreases in the number of skeleton endpoints (2nd column) remain significant up to 4 to 6 frames averaged. Increases in the mean length of skeleton segments (3rd column) remain significant up to 5 to 6 frames averaged. Increases in vessel density (4th column) remain significant up to 2–3 frames averaged. ICD (5th column) does not change significantly among frames.
(TIF)
Each spreadsheet A-E contains data from its corresponding parameter for each subject, ROI, and number of averaged frames. Spreadsheet F contains the 10-frame averaged capillary density data for the patients with POAG. Mean segment length and intercapillary distance (ICD) are measured in μm; capillary density is measured in mm-1.
(XLSX)
Acknowledgments
This study was presented in part at the Association for Research in Vision and Ophthalmology Imaging in the Eye Conference in April 2016: Mo S, Krawitz B, Phillips E, Garg R, Geyman L, Efstathiadis E, Chui TYP, Carroll J, Rosen RB. Visualization of radial peripapillary capillaries in optical coherence tomography angiography: The effect of image averaging.
Data Availability
All relevant data are within the paper and its Supporting Information files.
Funding Statement
This work was funded by the Marrus Family Foundation (RBR), Bendheim-Lowenstein Family Foundation (RBR), Wise Family Foundation (RBR), New York Eye and Ear Chairman’s Research Fund (RBR), Violett Fund (RBR), and Milbank Foundation (RBR). Research reported in this publication was supported by the Eye Institute of the National Institutes of Health under award numbers P30EY001931 (JC) and R01EY024969 (JC). The content is solely the responsibility of the authors and does not necessarily represent the official views of the National Institutes of Health. The funders had no role in study design, data collection and analysis, decision to publish, or preparation of the manuscript.
References
- 1.Henkind P. Radial peripapillary capillaries of the retina. I. Anatomy: human and comparative. Br J Ophthalmol. 1967;51(2):115–23. [DOI] [PMC free article] [PubMed] [Google Scholar]
- 2.Yu PK, Cringle SJ, Yu DY. Correlation between the radial peripapillary capillaries and the retinal nerve fibre layer in the normal human retina. Exp Eye Res. 2014;129:83–92. 10.1016/j.exer.2014.10.020 [DOI] [PubMed] [Google Scholar]
- 3.Paques M, Tadayoni R, Sercombe R, Laurent P, Genevois O, Gaudric A, et al. Structural and hemodynamic analysis of the mouse retinal microcirculation. Invest Ophthalmol Vis Sci. 2003;44(11):4960–7. [DOI] [PubMed] [Google Scholar]
- 4.Snodderly DM, Weinhaus RS, Choi JC. Neural-vascular relationships in central retina of macaque monkeys (Macaca fascicularis). J Neurosci. 1992;12(4):1169–93. Epub 1992/04/01. [DOI] [PMC free article] [PubMed] [Google Scholar]
- 5.Bonini Filho MA, Adhi M, de Carlo TE, Ferrara D, Baumal CR, Witkin AJ, et al. Optical Coherence Tomography Angiography in Retinal Artery Occlusion. Retina. 2015;35(11):2339–46. 10.1097/IAE.0000000000000850 [DOI] [PubMed] [Google Scholar]
- 6.Alterman M, Henkind P. Radial peripapillary capillaries of the retina. II. Possible role in Bjerrum scotoma. Br J Ophthalmol. 1968;52(1):26–31. [DOI] [PMC free article] [PubMed] [Google Scholar]
- 7.Kornzweig AL, Eliasoph I, Feldstein M. Selective atrophy of the radial peripapillary capillaries in chronic glaucoma. Arch Ophthalmol. 1968;80(6):696–702. [DOI] [PubMed] [Google Scholar]
- 8.Scoles D, Gray DC, Hunter JJ, Wolfe R, Gee BP, Geng Y, et al. In-vivo imaging of retinal nerve fiber layer vasculature: imaging histology comparison. BMC Ophthalmol. 2009;9:9 10.1186/1471-2415-9-9 [DOI] [PMC free article] [PubMed] [Google Scholar]
- 9.Pinhas A, Dubow M, Shah N, Chui TY, Scoles D, Sulai YN, et al. In vivo imaging of human retinal microvasculature using adaptive optics scanning light ophthalmoscope fluorescein angiography. Biomedical optics express. 2013;4(8):1305–17. Epub 2013/09/07. 10.1364/BOE.4.001305 [DOI] [PMC free article] [PubMed] [Google Scholar]
- 10.Chui TY, Dubow M, Pinhas A, Shah N, Gan A, Weitz R. Comparison of adaptive optics scanning light ophthalmoscopic fluorescein angiography and offset pinhole imaging. Biomedical optics express. 2014;5. [DOI] [PMC free article] [PubMed] [Google Scholar]
- 11.Chui TY, Gast TJ, Burns SA. Imaging of vascular wall fine structure in the human retina using adaptive optics scanning laser ophthalmoscopy. Invest Ophthalmol Vis Sci. 2013;54. [DOI] [PMC free article] [PubMed] [Google Scholar]
- 12.Jia Y, Tan O, Tokayer J, Potsaid B, Wang Y, Liu JJ, et al. Split-spectrum amplitude-decorrelation angiography with optical coherence tomography. Opt Express. 2012;20(4):4710–25. 10.1364/OE.20.004710 [DOI] [PMC free article] [PubMed] [Google Scholar]
- 13.Mariampillai A, Standish BA, Moriyama EH, Khurana M, Munce NR, Leung MK, et al. Speckle variance detection of microvasculature using swept-source optical coherence tomography. Optics letters. 2008;33(13):1530–2. Epub 2008/07/03. [DOI] [PubMed] [Google Scholar]
- 14.Kim DY, Fingler J, Werner JS, Schwartz DM, Fraser SE, Zawadzki RJ. In vivo volumetric imaging of human retinal circulation with phase-variance optical coherence tomography. Biomedical optics express. 2011;2. [DOI] [PMC free article] [PubMed] [Google Scholar]
- 15.Fingler J, Zawadzki RJ, Werner JS, Schwartz D, Fraser SE. Volumetric microvascular imaging of human retina using optical coherence tomography with a novel motion contrast technique. Opt Express. 2009;17(24):22190–200. Epub 2009/12/10. 10.1364/OE.17.022190 [DOI] [PMC free article] [PubMed] [Google Scholar]
- 16.Makita S, Hong Y, Yamanari M, Yatagai T, Yasuno Y. Optical coherence angiography. Opt Express. 2006;14(17):7821–40. [DOI] [PubMed] [Google Scholar]
- 17.Wang RK, Jacques SL, Ma Z, Hurst S, Hanson SR, Gruber A. Three dimensional optical angiography. Opt Express. 2007;15(7):4083–97. [DOI] [PubMed] [Google Scholar]
- 18.Zhang A, Zhang Q, Chen CL, Wang RK. Methods and algorithms for optical coherence tomography-based angiography: a review and comparison. Journal of biomedical optics. 2015;20(10):100901 10.1117/1.JBO.20.10.100901 [DOI] [PMC free article] [PubMed] [Google Scholar]
- 19.Makita S, Kurokawa K, Hong YJ, Miura M, Yasuno Y. Noise-immune complex correlation for optical coherence angiography based on standard and Jones matrix optical coherence tomography. Biomedical optics express. 2016;7(4):1525–48. 10.1364/BOE.7.001525 [DOI] [PMC free article] [PubMed] [Google Scholar]
- 20.An L, Wang RK. In vivo volumetric imaging of vascular perfusion within human retina and choroids with optical micro-angiography. Opt Express. 2008;16. [DOI] [PubMed] [Google Scholar]
- 21.Spaide RF, Klancnik JM Jr., Cooney MJ. Retinal vascular layers imaged by fluorescein angiography and optical coherence tomography angiography. JAMA ophthalmology. 2015;133(1):45–50. Epub 2014/10/16. 10.1001/jamaophthalmol.2014.3616 [DOI] [PubMed] [Google Scholar]
- 22.Spaide RF, Klancnik JM Jr., Cooney MJ. Retinal vascular layers in macular telangiectasia type 2 imaged by optical coherence tomographic angiography. JAMA ophthalmology. 2015;133(1):66–73. Epub 2014/10/16. 10.1001/jamaophthalmol.2014.3950 [DOI] [PubMed] [Google Scholar]
- 23.Mo S, Krawitz B, Efstathiadis E, Geyman L, Weitz R, Chui TYP, et al. Imaging foveal microvasculature: optical coherence tomography angiography versus adaptive optics scanning light ophthalmoscope fluorescein angiography. Invest Ophthalmol Vis Sci. 2016;57(9):OCT130–40. 10.1167/iovs.15-18932 [DOI] [PMC free article] [PubMed] [Google Scholar]
- 24.Tan PE, Balaratnasingam C, Xu J, Mammo Z, Han SX, Mackenzie P, et al. Quantitative Comparison of Retinal Capillary Images Derived By Speckle Variance Optical Coherence Tomography With Histology. Invest Ophthalmol Vis Sci. 2015;56(6):3989–96. Epub 2015/06/23. 10.1167/iovs.14-15879 [DOI] [PubMed] [Google Scholar]
- 25.Chan G, Balaratnasingam C, Xu J, Mammo Z, Han S, Mackenzie P, et al. In vivo optical imaging of human retinal capillary networks using speckle variance optical coherence tomography with quantitative clinico-histological correlation. Microvasc Res. 2015;100:32–9. Epub 2015/04/29. 10.1016/j.mvr.2015.04.006 [DOI] [PubMed] [Google Scholar]
- 26.Yu PK, Balaratnasingam C, Xu J, Morgan WH, Mammo Z, Han S, et al. Label-Free Density Measurements of Radial Peripapillary Capillaries in the Human Retina. PloS one. 2015;10(8):e0135151 Epub 2015/08/08. 10.1371/journal.pone.0135151 [DOI] [PMC free article] [PubMed] [Google Scholar]
- 27.Chu Z, Lin J, Gao C, Xin C, Zhang Q, Chen CL, et al. Quantitative assessment of the retinal microvasculature using optical coherence tomography angiography. Journal of biomedical optics. 2016;21(6):66008 10.1117/1.JBO.21.6.066008 [DOI] [PMC free article] [PubMed] [Google Scholar]
- 28.Reif R, Qin J, An L, Zhi Z, Dziennis S, Wang R. Quantifying optical microangiography images obtained from a spectral domain optical coherence tomography system. International journal of biomedical imaging. 2012;2012:509783 10.1155/2012/509783 [DOI] [PMC free article] [PubMed] [Google Scholar]
- 29.Jia Y, Bailey ST, Hwang TS, McClintic SM, Gao SS, Pennesi ME, et al. Quantitative optical coherence tomography angiography of vascular abnormalities in the living human eye. Proc Natl Acad Sci U S A. 2015;112(18):E2395–402. Epub 2015/04/22. 10.1073/pnas.1500185112 [DOI] [PMC free article] [PubMed] [Google Scholar]
- 30.Scripsema NK, Garcia PM, Bavier RD, Chui TY, Krawitz BD, Mo S, et al. Optical Coherence Tomography Angiography Analysis of Perfused Peripapillary Capillaries in Primary Open-Angle Glaucoma and Normal-Tension Glaucoma. Invest Ophthalmol Vis Sci. 2016;57(9):OCT611–OCT20. 10.1167/iovs.15-18945 [DOI] [PubMed] [Google Scholar]
- 31.Agemy SA, Scripsema NK, Shah CM, Chui T, Garcia PM, Lee JG, et al. Retinal Vascular Perfusion Density Mapping Using Optical Coherence Tomography Angiography in Normals and Diabetic Retinopathy Patients. Retina. 2015;35(11):2353–63. Epub 2015/10/16. 10.1097/IAE.0000000000000862 [DOI] [PubMed] [Google Scholar]
- 32.Spaide RF, Fujimoto JG, Waheed NK. Image Artifacts in Optical Coherence Tomography Angiography. Retina. 2015;35(11):2163–80. 10.1097/IAE.0000000000000765 [DOI] [PMC free article] [PubMed] [Google Scholar]
- 33.Shirasawa M, Sakamoto T, Terasaki H, Yamashita T, Uchino E, Sonoda S. Objective determination of optimal number of spectral-domain optical coherence tomographic images of retina to average. PLoS One. 2014;9(10):e110550 10.1371/journal.pone.0110550 [DOI] [PMC free article] [PubMed] [Google Scholar]
- 34.Kraus MF, Potsaid B, Mayer MA, Bock R, Baumann B, Liu JJ, et al. Motion correction in optical coherence tomography volumes on a per A-scan basis using orthogonal scan patterns. Biomedical optics express. 2012;3(6):1182–99. 10.1364/BOE.3.001182 [DOI] [PMC free article] [PubMed] [Google Scholar]
- 35.Sakamoto A, Hangai M, Yoshimura N. Spectral-domain optical coherence tomography with multiple B-scan averaging for enhanced imaging of retinal diseases. Ophthalmology. 2008;115(6):1071–8 e7. 10.1016/j.ophtha.2007.09.001 [DOI] [PubMed] [Google Scholar]
- 36.Sander B, Larsen M, Thrane L, Hougaard JL, Jorgensen TM. Enhanced optical coherence tomography imaging by multiple scan averaging. Br J Ophthalmol. 2005;89(2):207–12. 10.1136/bjo.2004.045989 [DOI] [PMC free article] [PubMed] [Google Scholar]
- 37.Zang P, Liu G, Zhang M, Dongye C, Wang J, Pechauer AD, et al. Automated motion correction using parallel-strip registration for wide-field en face OCT angiogram. Biomedical optics express. 2016;7(7):2823–36. 10.1364/BOE.7.002823 [DOI] [PMC free article] [PubMed] [Google Scholar]
- 38.Gorczynska I, Migacz JV, Zawadzki RJ, Capps AG, Werner JS. Comparison of amplitude-decorrelation, speckle-variance and phase-variance OCT angiography methods for imaging the human retina and choroid. Biomedical optics express. 2016;7(3):911–42. 10.1364/BOE.7.000911 [DOI] [PMC free article] [PubMed] [Google Scholar]
- 39.Hendargo HC, Estrada R, Chiu SJ, Tomasi C, Farsiu S, Izatt JA. Automated non-rigid registration and mosaicing for robust imaging of distinct retinal capillary beds using speckle variance optical coherence tomography. Biomedical optics express. 2013;4(6):803–21. 10.1364/BOE.4.000803 [DOI] [PMC free article] [PubMed] [Google Scholar]
- 40.Bennett AG, Rudnicka AR, Edgar DF. Improvements on Littmann's method of determining the size of retinal features by fundus photography. Graefe's archive for clinical and experimental ophthalmology = Albrecht von Graefes Archiv fur klinische und experimentelle Ophthalmologie. 1994;232(6):361–7. Epub 1994/06/01. [DOI] [PubMed] [Google Scholar]
- 41.Arganda-Carreras I, Sorzano COS, Marabini R, Carazo JM, Ortiz-De-Solorzano C, Kybic J. Consistent and elastic registration of histological sections using vector-spline regularization. Lect Notes Comput Sc. 2006;4241:85–95. [Google Scholar]
- 42.Lozzi A, Agrawal A, Boretsky A, Welle CG, Hammer DX. Image quality metrics for optical coherence angiography. Biomedical optics express. 2015;6(7):2435–47. 10.1364/BOE.6.002435 [DOI] [PMC free article] [PubMed] [Google Scholar]
- 43.Tan PE, Yu PK, Cringle SJ, Yu DY. Quantitative assessment of the human retinal microvasculature with or without vascular comorbidity. Invest Ophthalmol Vis Sci. 2014;55(12):8439–52. 10.1167/iovs.14-15056 [DOI] [PubMed] [Google Scholar]
- 44.Tan PE, Yu PK, Balaratnasingam C, Cringle SJ, Morgan WH, McAllister IL, et al. Quantitative confocal imaging of the retinal microvasculature in the human retina. Invest Ophthalmol Vis Sci. 2012;53(9):5728–36. 10.1167/iovs.12-10017 [DOI] [PubMed] [Google Scholar]
Associated Data
This section collects any data citations, data availability statements, or supplementary materials included in this article.
Supplementary Materials
Improvements in SNR (1st column) remain significant up to 5 to 9 frames averaged. Decreases in the number of skeleton endpoints (2nd column) remain significant up to 4 to 6 frames averaged. Increases in the mean length of skeleton segments (3rd column) remain significant up to 5 to 6 frames averaged. Increases in vessel density (4th column) remain significant up to 2–3 frames averaged. ICD (5th column) does not change significantly among frames.
(TIF)
Each spreadsheet A-E contains data from its corresponding parameter for each subject, ROI, and number of averaged frames. Spreadsheet F contains the 10-frame averaged capillary density data for the patients with POAG. Mean segment length and intercapillary distance (ICD) are measured in μm; capillary density is measured in mm-1.
(XLSX)
Data Availability Statement
All relevant data are within the paper and its Supporting Information files.


