Abstract
Understanding how disease foci arise from single source lesions has not been well studied. Here, single wheat leaves were inoculated with Puccinia striiformis f. sp. tritici urediniospores, and all wheat leaves within two intersecting 0.3 × 3.0 m transects were sampled in eight replicates over three years. The lesions observed on each of the top three leaves on plants within 1.5 m from the source lesion were three-dimensionally mapped. The total number of lesions within a 1.5 m radius was estimated by dividing the number of lesions observed within each 0.025 m-wide annulus by the fraction of the annulus sampled. The estimated total number of lesions produced within 1.5 m of a single source lesion ranged from 27 to 776, with a mean of 288 lesions. Eighty percent of the lesions were recorded within 0.69 m of the source infection. The proportion of total lesions observed at a given distance from the source was fitted well by the Lomax and Weibull distributions, reflecting the large proportion of lesions arising close to the source, and when fitted to an inverse-power distribution had a slope (b) of 2.5. There were more lesions produced on leaves higher in the canopy than on lower leaves, with more lesions being detected above than below the point of inoculation. Simultaneous measurement of lesion gradients and spore dispersal in the final year of the study suggests that this pattern is due to greater susceptibility of upper leaves, rather than increased dispersal to upper leaves.
Keywords: dispersal, epidemiology, Puccinia striiformis, Triticum aestivum
Introduction
Aerially dispersed plant pathogens include causal agents of some of the most devastating and economically important diseases, such as rusts and mildews (Brown & Hovmøller, 2002). The spread of lesions reflects a synthesis of the physical dispersal of propagules with the biological interaction of successful infection, growth, and reproduction by a pathogen on a susceptible host. Understanding the spread of aerially dispersed pathogens in space and time can aid in efforts to control epidemics (Fitt et al., 2006). An initial disease outbreak can be referred to as a focus, and can be initially formed by an isolated lesion resulting from a single infection (Zadoks & Van den Bosch, 1994). Pathogens aerially dispersed by relatively small propagules, such as powdery mildews or rusts, have been shown to closely follow inverse power distributions within relatively uniform landscapes such as agricultural fields of annual crops. Inverse power distributions have very steep dispersal gradients, but with ‘fat tails’, in which a small but consequential number of propagules are dispersed at great distances from the source (Kot et al., 1996). The degree to which inoculum is dispersed short versus long distances has implications for several important epidemiological evolutionary processes due to the number of founder events, including overcoming host resistance and maintaining pathogen genetic polymorphisms in gene-for-gene systems (Lannou et al., 2008; Mundt, 2009; Wingen et al., 2013), as well as selecting for reduced pathogen latent periods (van den Berg et al., 2012).
Several studies examining rust dispersal in crop canopies have been undertaken. However, sources of inoculum for these studies have most often contained enough propagules to form several, in some cases several thousand, initial infections on individual plants (Willocquet et al., 2008), on several plants within a focal area (Asea et al., 2002; Sackett & Mundt, 2005), or on entire fields (Gitaitis et al., 1998). More recently, it was demonstrated that the highly local dissemination of wheat leaf rust requires the study of individual lesions if the full epidemiological impacts of dispersal gradients are to be understood (Lannou et al., 2008). Collecting such data presents a number of challenges. To accurately describe dispersal from such a single source requires lesion counts in areas of high lesion density. It also relies on the presence of isolated initial lesions, requiring both successful germination of the source spores, and absence of background infections from outside sources of inoculum (Lannou et al., 2008; Mundt, 2009). Assessing the dispersal gradient from a single lesion can help address how aerially dispersed pathogens spread at the disease front, as well as how diseases progress throughout a growing season (Mundt et al., 2009b). Lesion counts per leaf, the sampling unit used in this study, can be used to determine if propagules are randomly distributed or over-dispersed (Waggoner & Rich, 1981). This information can be useful in predicting when and where disease is likely to occur, and can give insights into the effectiveness of methods field managers may employ to slow the spread of disease (Severns et al., 2014).
Wheat stripe rust (WSR) is a plant disease capable of causing significant crop losses and reductions in grain quality (Wellings, 2011). Many pathogens disperse via multiple mechanisms. Puccinia striiformis f. sp. tritici, the causal agent of WSR, spreads by direct contact of a lesion and healthy uninfected wheat leaf tissue, by water dispersal, and through the air (Van der Plank, 1963; Geagea et al., 1997, 1999). Of these methods, aerial dispersal appears to play the largest role, especially in long-distance dispersal, although humidity appears to have a significant role in urediniospore dissemination, especially in regards to urediniospores being dispersed individually or in clusters (Rapilly, 1979). Urediniospores of P. striiformis have been shown to travel over 500 km (Brown & Hovmøller, 2002), and to be able to cause disease upon deposition. This long-distance dispersal of urediniospores can cause entry of isolated lesions to a field or region (Hovmøller et al., 2002).
Although dispersal gradients of plant pathogens have been studied empirically using field experiments, as well as simulated using computer models (Mundt & Leonard, 1985), there have been few attempts to describe the dispersal emanating from single isolated lesions. To accurately describe dispersal from such a single source requires lesion counts rather than an estimate of disease severity, which is an average over a unit area. This study examined the local pattern of P. striiformis in wheat that originated from artificially inoculated, isolated lesions over the course of single generations of dispersal. These data were used to describe the horizontal and vertical distribution of progeny lesions within the wheat canopy and to estimate the reproductive potential of individual lesions. As P. striiformis urediniospores are able to disperse over several hundred kilometres, capturing the entirety of the dispersal gradient was not feasible. However, this study should help elucidate the creation of foci and dispersal within a field, particularly at the disease front.
Materials and methods
Measuring disease gradients
The study site was chosen to minimize contamination from naturally occurring inoculum of WSR and other wheat pathogens. Field experiments were conducted in commercial wheat fields within a 6 km radius of Culver, OR, USA. This is an irrigated agricultural region of approximately 25 000 ha in the high desert of central Oregon and geographically isolated from major regions of wheat production in the state. Its climate is not conducive to WSR overwintering due to low winter temperatures.
All plots were 6 m radius circles located within fields used to study effects of conditions at disease outbreak sites on subsequent disease spread (Severns et al., 2014). The fields were 13.7 × 73.2 m in 2012 and 7.6 × 42.7 m in 2013 and 2014, with the long dimensions oriented east–west. Predominant winds in the region are from the west-northwest (Van de Water et al., 2007). All eight plots containing a single source lesion were comprised of monoculture plots of the soft white winter wheat cv. Jacmar, a cultivar no longer commercially planted (Table 1). An additional plot contained three source lesions, and was therefore excluded from the two-dimensional dispersal study, but was used to examine the vertical distribution of lesions and urediniospores (see ‘Spore trapping’). Jacmar is susceptible to the races of P. striiformis used in this study, but resistant to the races that predominated in Oregon during the course of the study. The plots were surrounded by at least an 18.3 m buffer of soft white winter wheat cv. Stephens, which is resistant to races of P. striiformis used here. The field was subject to standard agronomic practices for wheat production in the area, including overhead irrigation approximately every 7–10 days beginning in March (Mundt & Sackett, 2012), which provided soil moisture to encourage dew formation and successful infection events within the plant canopy.
Table 1. Locations and timings of inoculations and disease assessments used to measure the spatial distribution of stripe rust lesions around initial single-lesion leaves.
| Plot | Source leaf | Inoculation date | Sampling date | Growing degree daysa |
|---|---|---|---|---|
| 1 | 4 | 04/05/2012 | 19/06/2012 | 683 |
| 2 | 4 | 04/05/2012 | 18/06/2012 | 670 |
| 3 | 4 | 15/05/2012 | 18/06/2012 | 670 |
| 4 | 2 | 16/05/2013 | 26/06/2013 | 648 |
| 5 | 1 | 16/05/2013 | 24/06/2013 | 613 |
| 6 | 1 | 16/05/2013 | 24/06/2013 | 613 |
| 7 | 5 | 18/04/2014 | 07/06/2014 | 658 |
| 8 | 4 | 29/04/2014 | 15/06/2014 | 688 |
Growing degree days are cumulative above 2 °C between inoculation and sampling dates.
Inoculations were performed in early spring, after temperatures became conducive to P. striiformis germination, but as early as possible to minimize the chance of interference from other sources of inoculum. Inoculations were performed with WSR race PST 5 in 2012 and 2013, but it began to exhibit reduced viability under field conditions after being grown over many generations in the controlled environment of the growth chamber, so race PST 29 was used in 2014. The two races have highly similar virulence patterns on known wheat genotypes (Chen, 2005). The method of Lannou et al. (2008) was used to inoculate single leaves. Inoculated plants were selected for proximity to the centre of the plot from north to south and 6.1 m apart from east to west within plots, while ensuring approximately uniform coverage of wheat plants within 5 m of the plant to be inoculated. Leaves were inoculated with a mixture of 0.25 g urediniospores: 3.75 g talc. The inoculum was transferred from a vial via a pencil-top eraser to Scotch tape labels, which were placed on the adaxial surface of the leaf at least as wide as the eraser. The tape labels trapped transpiration water from the wheat leaves, ensuring optimal leaf moisture for germination of the urediniospores. The inoculated leaf was marked with a Sharpie felt pen above the inoculation point in years 2012 and 2013. In 2014, the inoculated tiller was marked with a plastic zip-tie at its base, as it was easier to identify. About 30 mL water was poured into a white plastic bag, which was shaken and then placed over two wooden dowels taller than the inoculated wheat plant and staked down, acting as a moist chamber. Inoculations were performed close to sunset and on cloudier days, as it was found that prolonged exposure to radiant light greatly reduced the rate of successful germination in greenhouse tests. The plastic bag and the tape were removed the following morning.
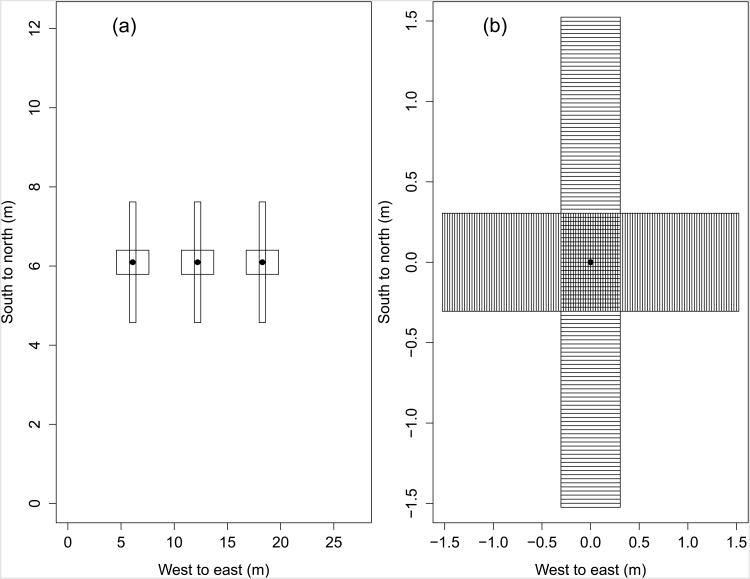
The plots were searched for lesions after approximately 1.75–1.90 generations of disease spread (Table 1), as calculated by the Shrum (1975) degree-day model. This time period allowed for nearly all lesions of the second generation to be visibly sporulating, but without the possibility of third generation lesion expression. All tillers within two overlapping, perpendicular 3.0 × 0.30 m transects centred on the original lesion were inspected (Fig. 1a). The transect quadrant and distance from the source of the 0.025 m-wide distance interval (Fig. 1b) containing each tiller and the leaf position of each lesion were recorded, with the uppermost leaf, often referred to as the flag leaf, being considered leaf 1 and leaf number increasing sequentially going down the wheat stem. Due to senescence of lower leaves, leaves below leaf 3 were not considered in 2012 and 2013, and leaves below leaf 4 were not considered in 2014. When individual lesions were not distinct due to age and/or multiple overlapping lesions, a severity estimate was taken for the leaf and each 5% severity was considered to be one lesion. The rationale for this conversion was that the maximum number of lesions on a leaf was approximately 20.
Figure 1.
Plot design. (a) Example of crossing 3.0 × 0.30 m sampling transects used to measure the distribution of wheat stripe rust lesions around initially inoculated leaves (●). (b) All tillers within the crossing rectangles were destructively sampled, with the number of lesions on each leaf recorded. In the crossing region within 0.15 m of the source lesion across or along rows, the coordinates of the tillers were recorded to the nearest 0.025 m. Outside of the crossing region, the quadrant and distance from the source to the midpoint of the bin containing the tiller was recorded.
Spore trapping
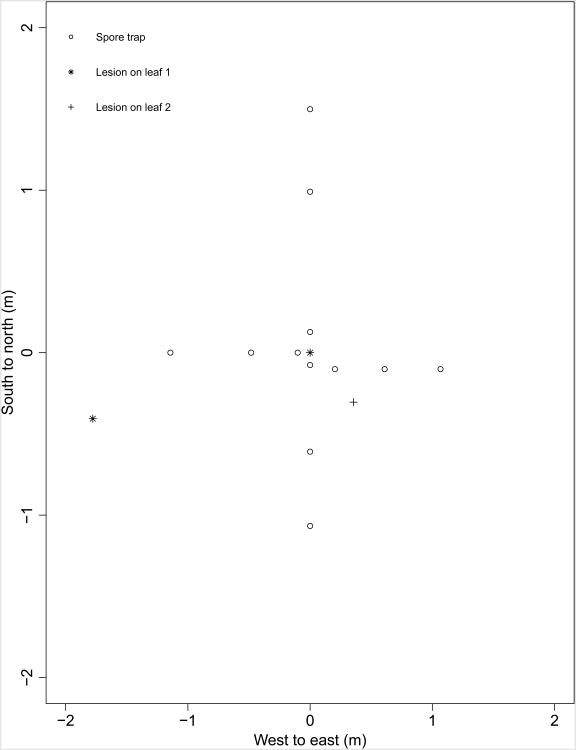
In 2014, spore traps were placed in a single plot, at three distances from an inoculated leaf along the four cardinal directions, in order to compare the dispersal of spores to the dispersal of lesions (Fig. 2). Each spore trap comprised a 0.91 m tall wooden dowel with three identical, artificial wheat leaves made of sections of laser-printer overhead projector slides, cut to the size of a scanned representative wheat leaf, and containing an approximately 0.01 m long by 0.0025 m wide tab at the base to be taped on to the dowel with duct tape. Each artificial wheat leaf had a 1 mm grid pattern printed on it to aid in counting spores under a compound microscope. The artificial wheat leaves were placed grid-side down on a piece of varnished cardboard containing a small quantity of vacuum grease. The grease was spread thin by holding a razor on the top of the artificial leaves and pulling the leaves by the tab three times, or until the grease was spread evenly across the entire grid-side, excluding the tab. The artificial leaves were taped grease-side down at 0.13, 0.38 and 0.64 m from the top of the dowels.
Figure 2.
Location of spore traps and source Puccinia striiformis lesions present one generation prior to sampling.
Three spore traps were placed in each cardinal direction, approximately 0.15, 0.6 and 1.5 m from a tiller inoculated as described above, at locations where they would come into direct contact with as few wheat leaves as possible, such as between tractor passes. Exact locations of spore traps were recorded, along with the locations of all lesions (Fig. 2). Because of the late date of inoculation for this plot, the environment was extremely conducive to infection by P. striiformis, resulting in three lesions within the width of the eraser used to transfer the inoculum to the tape, approximately 0.007 m on leaf 1, which was first observed 15 June 2014, as well as a stray source lesion 0.47 m from the source to the southeast at azimuth 319.4° on leaf 2, and a stray source lesion 1.82 m from the source to the southwest at azimuth 192.9° on leaf 1 (Fig. 2). Eleven days after initial placement, the spore traps were removed from the dowels and taped greased-side down on a blank laser printer overhead transparency in a three-ring binder, using one sheet per dowel, labelling each spore trap by leaf position.
Puccinia striiformis urediniospores were identified visually by size and shape using a Leica DM750 microscope under × 100 magnification, a Leica DFC 295 camera, and the Leica application suite to store and edit images.
Data analysis
All analyses were performed using R v. 2.14.0 (R Development Core Team, 2015). Three-dimensional maps of lesion distributions were produced using the scatterplot3d package (Ligges & Mächler, 2003). The modified inverse power distribution (Mundt & Leonard, 1985),
| Eqn 1 |
in which y is the mean number of lesions present on all leaves per tiller per 0.025 m, and x is the distance from the inoculum source, was fitted to the dispersal gradient of progeny lesions from single source lesions. The modified inverse power regression was linearized by taking the log base 10 of both sides, giving
| Eqn 2 |
where a is the intercept and b is the slope. The parameter c is an offset approximating the amount of space occupied by the initial inoculum. The incorporation of the c parameter also has the benefit of allowing Eqn 2 to be defined at x = 0. The value of c was estimated by iteratively fitting Eqn 2 with ordinary least-squares linear regression in increments of 0.001 m, and choosing the value of c that returned the highest R2 value and lowest P-value.
Because several distance intervals contained zero lesions in individual plots, data from all plots of 2012–2014 were aggregated to enable the log-log transformed inverse power distribution to be fitted to them. While two different races of inoculum were used, the physical properties of the urediniospores are uniform, therefore the dispersal gradient should not differ between them. This minimized the amount of binning necessary to ensure at least one lesion per distance interval, allowing for log-transformation. When zero lesions were recorded at a single distance interval, it was binned by taking the mean number of lesions between the zero-lesion distance interval and an adjacent lesion-containing distance interval, which occurred in nine instances, all of which were greater than 1.04 m from the source, resulting in a bin size of 0.051 m in those instances.
In addition to binned log-log transformed linear regression, the Weibull and modified Pareto (also known as the Lomax) probability density functions (PDFs) and associated cumulative density functions (CDFs) were used to examine the probability of a given proportion of the total number of progeny lesions at a given distance. This was accomplished by multiplying the observed number of lesions per 0.025 × 0.30 m distance interval by the fraction of the total 0.025 m-wide annulus sampled. As fitting these PDFs did not require log-transformation, no binning of lesions across distance-intervals was necessary. The Weibull CDF,
| Eqn 3 |
was fitted by maximum likelihood estimation (MLE) to the cumulative number of lesions as a proportion of total lesions observed as a function of the distance from the source lesion. The derivative was taken to obtain the PDF:
| Eqn 4 |
The modified Pareto distribution, a modified form of the Pareto distribution with the CDF:
| Eqn 5 |
was fitted in the same method as above, and the derivate was taken to get the PDF:
| Eqn 6 |
The distributions were fitted by the simulated annealing algorithm (SANN), an algorithm that is particularly robust in its ability to find the global minimum in the presence of local minima (Bélisle, 1992), as built into the ‘Optim’ function in R (R Development Core Team, 2015). The initial parameters and temperature of the SANN algorithm were fitted iteratively by the lowest maximum log likelihood. These continuous distributions were made into discrete probability mass functions, as the data set was discretely organized by plant. These analyses were used to compare plots to each other by: leaf containing the mother infection, year of study, and replicate. This was accomplished by creating a flexible model with a varying number of parameters: in analysing the PDFs and CDFs of lesions as a function of distance plus a single blocking factor, a v parameter and a k parameter for each level of the given blocking factor was fitted as above. In fitting the PDFs and CDFs with two or more blocking factors, the first level of each blocking factor after the first was treated as the reference, with each successive level of the blocking factor adding an additional v- and k-parameter. The fitted modified Pareto and Weibull distributions were compared to each other by Akaike information criteria (AIC). The R script used to analyse and plot the PMFs and CMFs as a function of distance and as a function of distance and source have been included (Fig. S1).
Results
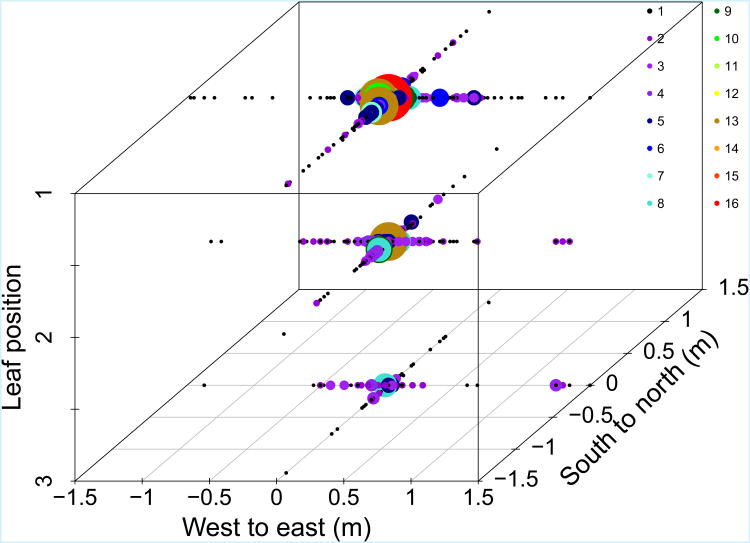
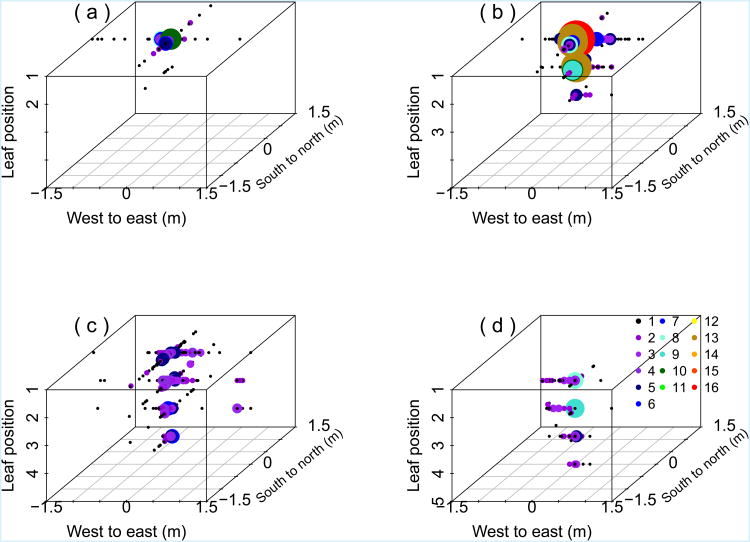
The three uppermost T. aestivum leaves were healthy enough to visually count WSR lesions in all plots (Fig. 3). Additionally, leaf 4 was readable in 2014 (Fig. 4c,d). There was an overall mean of 0.27 lesions observed per T. aestivum tiller. The distribution of lesions across leaves varied significantly, with 0.12 lesions on leaf 1, 0.097 lesions on leaf 2, and 0.037 lesions on leaf 3. The number of lesions observed on a given leaf layer, as well as the relative proportions of lesions on each leaf layer, varied according to the leaf layer containing the source lesion (Fig. 4).
Figure 3.
All observed lesions on the uppermost three leaves of all tillers sampled in all plots 2012 through 2014. Size and colours of points reflect the number of lesions at each leaf position within a sampling bin.
Figure 4.
Three-dimensional maps of lesions, aggregated by leaf position of source lesion. Size and colours of points reflect the number of lesions at each leaf position within a sampling bin. The source lesion was on (a) leaf 1 in plots 5 and 6; (b) leaf 2 in plot 4; (c) leaf 4 in plots 1, 2, 3, 8; (d) leaf 5 in plot 7.
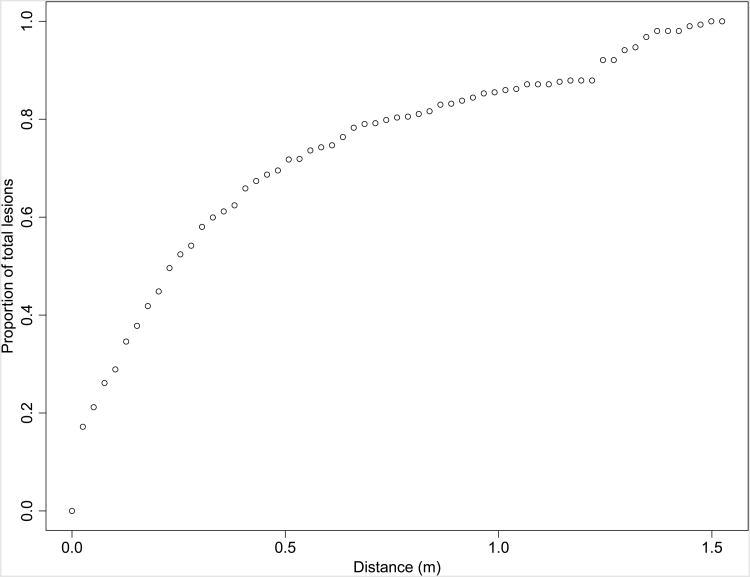
The mean number of lesions observed within the 3 × 0.3 m transects of all plots was 144.9. Extrapolated based on the fraction of each concentric 0.025 m-wide annulus covered by the sampling transects, there was a mean of 275.77 lesions within a 1.52 m radius of the source. The sum of all lesions at a given distance across all plots two-dimensionally extrapolated is presented in Figure 5. Of two-dimensional extrapolated lesions, 50% occurred within 0.23 m and 80% occurred within a mean of 0.69 m of the source lesion.
Figure 5.
Cumulative proportion of lesions across all plots by distance from source lesions, extrapolated two-dimensionally.
The mean number of lesions observed within 0.025 m of the source, approximately the radius of an average T. aestivum ‘Jacmar’ plant, was 7.058. This represents an autoinfection rate per plant of 2.56% of the two-dimensional extrapolated lesions within 1.52 m of the source lesion.
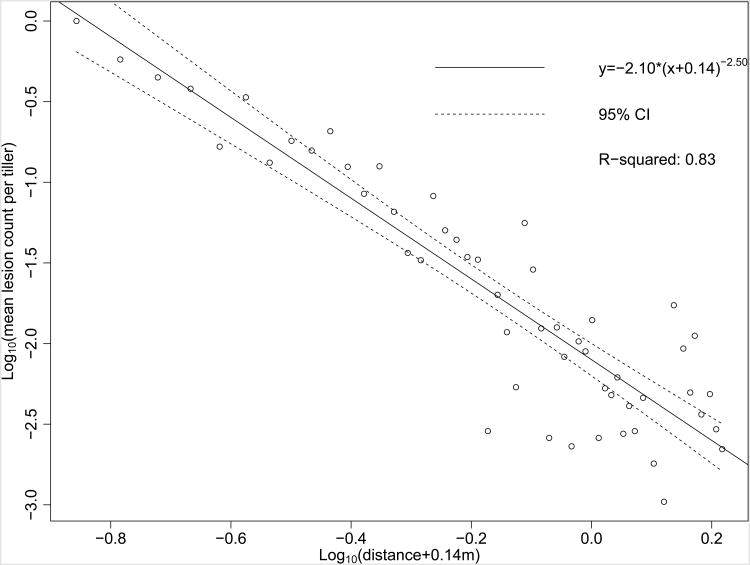
By aggregating lesion observations from all uncontaminated dispersal study replicates, a nonzero lesion count was observed in 53 out of 60 0.025 m-width intervals, with no interval greater than 0.051 m-width lacking one or more lesions. Binning only zero-count distance intervals with lesion counts from adjacent distance intervals minimized the total number of bins and minimized their effect on the regression. In aggregate, the dispersal gradient of lesions from a single source lesion within 1.5 m was described by the equation fitted by least-squares of the log-log transformed data (Fig. 6). The dispersal gradient, when the amount of disease at distance = 0 m was normalized to 1 by dividing the observed lesion count within each 0.025 m-width interval by the number of lesions observed within the distance interval of 0 to 0.025 m from the source lesion, resulted in the equation fitted by least-squares of the log-log transformed data (Fig. S2). In examining the aggregated data from all plots from 2012 to 2014, variance in mean observed lesions per 0.025 m-wide increased with distance from the source (Fig. 6).
Figure 6.
Linear regression of log-transformed lesions as a function of log-transformed distance with best-fit c offset, aggregated from all plots 2012–2014 to maximize non-zero lesion count coverage of distance intervals, with 95% confidence interval (CI).
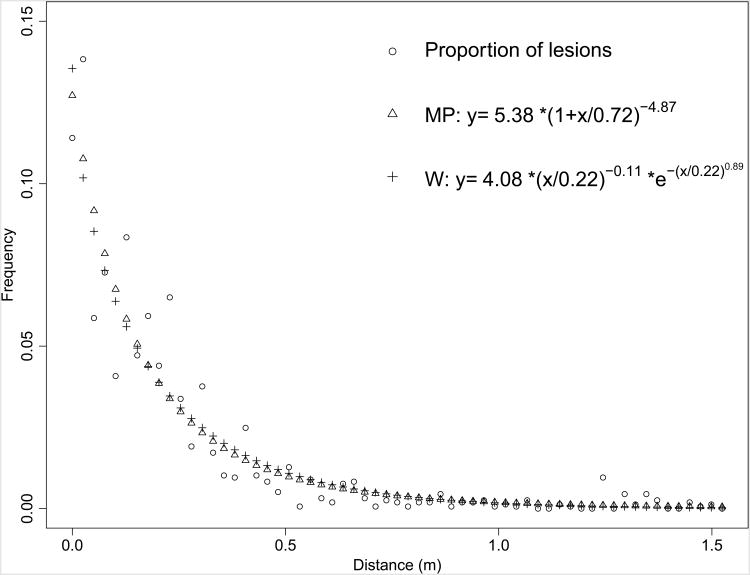
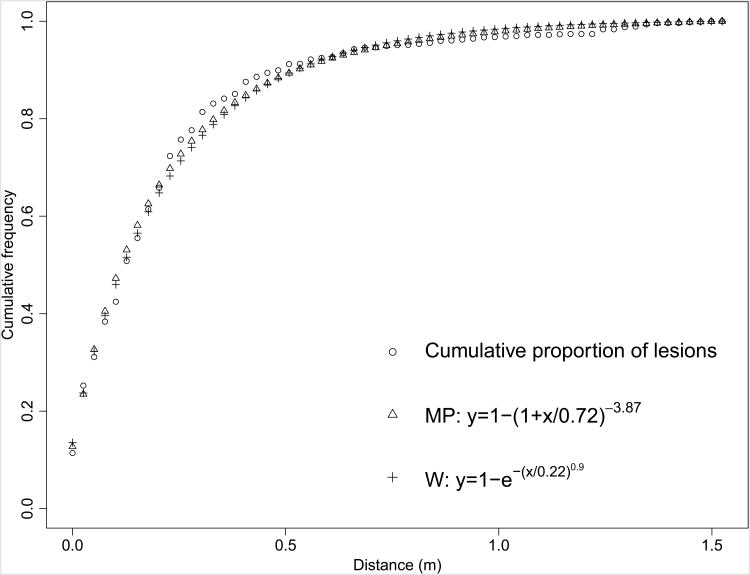
Non-linear PDFs and CDFs were converted to discrete probability mass functions (PMFs) and cumulative mass functions (CMFs) using each 0.025 m as a distance interval, and fit to the proportion of total lesions observed within each 0.025 × 0.30 m bin, as distance from the source increased (Figs 7 & 8, respectively). The PMFs and CMFs separated by individual source leaf were also plotted (Figs S3 & S4, respectively). Of the non-linear distributions, the modified Pareto distribution better fitted the data than the Weibull, and each additional blocking factor, source leaf, year, and replicate, lowered the AIC as well (Table 2). However, when the data was two-dimensionally extrapolated to estimate the number of lesions in the entirety of each annulus, the Weibull fitted better than the modified Pareto (data not shown).
Figure 7.
Proportion of total progeny lesions observed as a function of distance from source lesion with best-fit modified Pareto (MP) and Weibull (W) probability mass functions.
Figure 8.
Cumulative proportion of total progeny lesions observed as a function of distance from source lesions with best-fit modified Pareto (MP) and Weibull (W) cumulative mass functions.
Table 2. Akaike information criterion (AIC) and maximum likelihood estimate (MLE) for each model and distribution.
| Model | Distribution | Parameters | MLE | AIC |
|---|---|---|---|---|
| Lesions ∼ distance | Modified Pareto | 2 | 4975.73 | 9955.46 |
| Lesions ∼ distance | Weibull | 2 | 4990.48 | 9984.96 |
| Lesions ∼ distance + source | Modified Pareto | 8 | 4979.31 | 9974.62 |
| Lesions ∼ distance + source | Weibull | 8 | 4960.00 | 9936.00 |
| Lesions ∼ distance + source + year | Modified Pareto | 13 | 4932.17 | 9890.34 |
| Lesions ∼ distance + source + year | Weibull | 13 | 4948.21 | 9922.42 |
| Lesions ∼ distance + source + year + replicate | Modified Pareto | 26 | 4912.46 | 9876.92 |
| Lesions ∼ distance + source + year + replicate | Weibull | 26 | 4931.77 | 9915.54 |
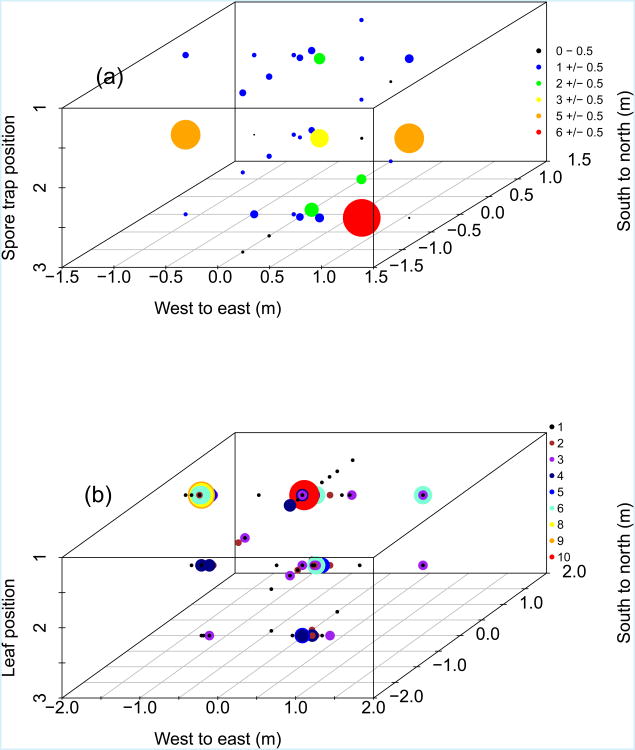
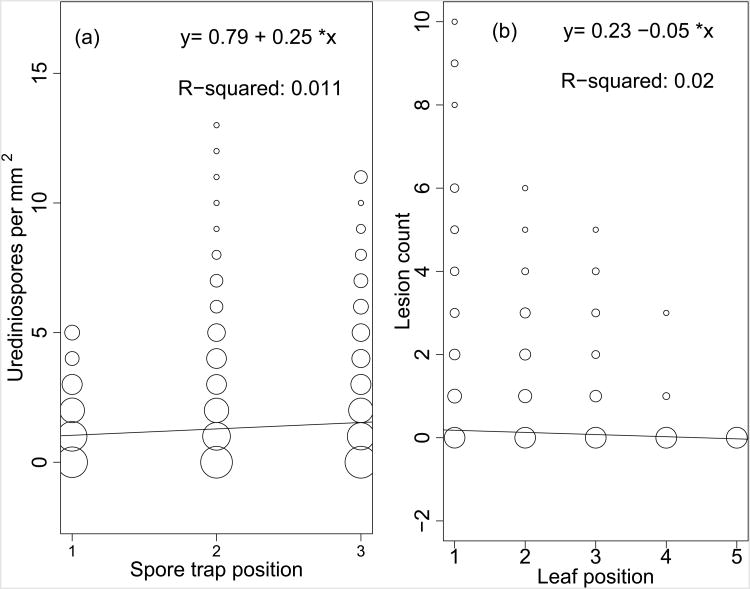
Upon resampling the plot containing the spore traps after approximately 1.8 generations, there was no significant difference between the number of urediniospores observed on the basal and the apical half of the spore traps (Fig. 9). Due to the presence of additional source lesions, there was no significant correlation between horizontal distance from the inoculated lesion and number of spores observed after a generation of dispersal. However, lesion counts significantly decreased as leaf position increased going down the stem (P < 2e−16), while mean urediniospores per mm2 significantly increased as spore trap position increased going down the dowel (P = 0.013; Fig. 10).
Figure 9.
Three-dimensional maps of (a) the mean number of urediniospores per mm2 per leaf trap, and (b) the total number of lesions in the plot containing the spore traps. Size and colours of points reflect the number of urediniospores or lesions, respectively, at each leaf position within a sampling bin.
Figure 10.
Vertical distribution of Puccinia striiformis in the plot containing spore traps. (a) The number of urediniospores as a function of spore trap position (1 = 0.75 m, 2 = 0.5 m, 3 = 0.25 m aboveground). (b) The number of lesions as a function of leaf position, which decreases in height sequentially. Point size is equal to 1 + log10 (frequency of observation).
Discussion
The dispersal gradient of P. striiformis lesions from a single point source aggregated across all plots was best fitted by the inverse-power model, as was the case in several previous field-wide studies (Mundt, 1989; Sackett & Mundt, 2005). The dispersal gradient had an exponent (b) well within the range found in previous studies on continental-scale dispersal (Mundt et al., 2009a). As in the study by Lannou et al. (2008) on P. triticina, autoinfection was measured by direct counts, while alloinfection could not be completely measured due to long-distance dispersal. The observed dispersal gradient within 1.5 m of the source was substantially steeper than observed in a previous study on P. triticana (Frezal et al., 2009). However, this leaf rust study was conducted using individual source leaves that were nearly saturated with infections, and contained spurious lesions within the plots in addition to the inoculated source lesions, which could result in much shallower infection gradients. The dispersal gradient was also over-dispersed, as in Lannou et al. (2008). While the count of progeny autoinfection lesions observed was considerably lower than in wheat leaf rust, this could be expected due to the much larger lesion size of WSR, and the more suitable environment for leaf rust infection in Lannou et al. (2008). The autoinfection rate per plant observed in the present study was more closely in agreement with previous studies on P. graminis f. sp. avenae (Leonard, 1969) and P. coronata (Mundt & Leonard, 1985, 1986). When examining individual plots or plots aggregated by year or leaf position or source lesion, the dispersal gradient, often referred to as a dispersal kernel when describing the set of random draws from a given PDF (Holland, 2010), was well fitted by the Weibull distribution, which has previously been used to model the distribution of wind speed in the boundary layer (Kelly et al., 2014), as well as biological dispersal data (Brøseth et al., 2005).
A consequence of the dispersal gradient from a single source lesion being very steep near the source while also having a fat-tail in which the exponent is unbounded, is that polycyclic epidemics have a high probability of invading new hosts at very low disease severities, but in succeeding generations can very quickly increase severity locally to near-saturation, resulting in accelerating rather than travelling waves of disease (Kot et al., 1996). This can help explain why observed aerial dispersal in the field has been up to 20 times as fast as predicted by simple diffusion models (Andow et al., 1990). The steepness of the dispersal gradient correlates with a reduction of importance of the dilution effect (Schmidt & Ostfeld, 2001), which has been postulated as a primary mechanism in slowing epidemics (Mundt, 2002). This is due to a greater proportion of urediniospores being deposited on the susceptible host tissue of the plant containing the source lesion relative to a shallower dispersal gradient in which a greater proportion of the spores would be deposited on a surface other than the plant containing the source lesion. This is due to the fact that, given the fat-tail of the dispersal, it is likely that the pathogen could spread from one plant to others within fields at low frequency (Hastings et al., 2005) thereby creating new foci, but that a very large proportion of spores would be deposited on the same plant as the source lesion, causing reinfection, or autoinfection, rather than deposition on a surface in which the spores could not cause infection (Mundt et al., 2010).
The number of progeny lesions observed at or above the leaf containing the source lesion was greater than would be expected if urediniospore dispersal via sedimentation was the primary driver of vertical lesion distribution, and was greater than found in wheat leaf spread (Frezal et al., 2009). The number of urediniospores decreased as spore trap height increased, contrary to the observed distribution pattern of lesions, but in agreement with the expectation of a greater proportion of spores being present in the middle or lower portion of the canopy early in an epidemic (Aylor, 1999). This result indicates that the observed vertical distribution of lesions was due to forces other than urediniospore dispersal. One potential explanation for this discrepancy in location of urediniospores versus lesions is a vertical gradient in environmental conditions and host physiology necessary for urediniospores to germinate, successfully infect a host, survive latently, and form sporulating lesions. There are vertical environmental gradients within the canopy of a wheat field, as UV radiation, temperature, leaf moisture, wind speed and wind direction are all inter-related and affected by the position in the canopy. Each of these environmental factors can affect the fitness of a given urediniospore (Eversmeyer et al., 1988). Another potential factor driving the discrepancy between uredinial lesion spread and urediniospore spread is the decreasing age of wheat leaves with increasing leaf position. Younger leaves have fewer hairs, thinner cuticles, and have been shown in other systems to correlate with increased disease severity (MacHardy, 1996). Recent experiments with controlled inoculations (D. H. Farber and C. C. Mundt, unpublished data) showed that a substantially higher proportion of urediniospores form sporulating lesions on younger leaves as compared to older leaves.
Environmental heterogeneity can be a primary determinant of spatial and temporal patterns of dispersal (Wright, 2002; Heino, 2013). However, non-uniform patterns of dispersal can arise even in relatively homogenous environments, including conventional single-crop agricultural fields (Neubert et al., 1995). Conventionally, dispersal gradients have been fitted by exponential or inverse-power distribution (Sackett & Mundt, 2005). Alternatively, the Weibull PDF has been fitted to biological dispersal data (Brøseth et al., 2005; Quinn et al., 2011). Use of PDFs has advantages over the inverse power law distribution, as they do not require taking the log, thereby enabling inclusion of zeroes, a large component of count data sets.
CDFs, the integrals of PDFs, are useful in examining the distances at which given proportions of the total number of new lesions arise from a single source lesion. It has been shown that there is a point at which the graph of the CDF rapidly flattens as it approaches its asymptote, often stated as approximately the distance at which 80% of cumulative lesions are observed, which is referred to here as the n80. This can be thought of as the division between two separate dispersal processes. Within the n80, the pathogen is locally dispersed, with urediniospores being deposited without being transported by the wind current, while the other 20% make it into the wind current, and therefore have a relatively high probability of long-distance dispersal. This 80/20 division of dispersal methods has been found to maximize overall disease spread (Zawolek & Zadoks, 1992). These findings could also support previous ecological work on ‘the 80/20 rule’, which states that 20% of individuals account for 80% of the disease spread (Woolhouse et al., 1997).
Another challenge of modelling dispersal lies in accurately assessing the quantity of disease. Many studies of polycyclic diseases in agricultural settings have utilized disease severity estimates, largely due to feasibility restrictions of counting the enormous number of lesions present when inoculating large focal areas with many propagules. Estimating disease severity can be imprecise, especially at low levels of disease, such as the case at the disease front. A relatively small inaccuracy in estimation of disease severity, for example, estimating 0.2% severity when the actual severity is 0.1% in a 1 m2 area, could translate to an additional 372 lesions, assuming four healthy, susceptible leaves per tiller, three tillers per wheat plant, and 1550 wheat plants per 1 m2.
While this study was performed in a relatively uniform, conventionally managed agricultural field, there were still a number of variables that could not be held constant. One such factor was the leaf position of the source infection. Due to the low success rate of inoculation by P. striiformis, especially early in the season when overnight temperatures were often at or below freezing, many plots had to be inoculated after a generation had passed and no sporulation was observed on the inoculated leaf. This temporal shift in the start of the successful inoculation caused several corresponding environmental factors to change as well. Later in the season the wheat was at a later stage of development, so in order to maintain consistent methods of inoculating the highest position leaf that was at least as wide as the eraser used, a higher position leaf had to be inoculated. Additionally, the weather was generally warmer later in the season, and the wind patterns different. The generation time of the rust was also shorter later in the season.
Because of the environmental heterogeneity present even in a conventionally managed agricultural system, more replicates of the local dispersal study would be ideal. However, given the time and space constraints present, and the relative consistency of the dispersal gradients, it is felt that this study should further the understanding of the spread of diseases caused by the aerial dispersal of small spores, by examining the local dispersal from a single source lesion over a representative set of environmental variables within a wheat field.
This study represents one of the only studies to examine dispersal from a single source lesion, enabling a better understanding of disease spread at the disease front. Destructively sampling all wheat leaves within transects and counting lesions should provide a more accurate dispersal gradient than severity estimates. The parameters obtained from this study can be used to model disease spread over time at a finer scale, allowing for modelling of infection of individual plants.
Supplementary Material
Figure S1 R Code.
Figure S2 Linear regression of log-transformed lesions, normalized by setting the amount of disease at the source to 1, as a function of log-transformed distance with best-fit c offset, aggregated from all plots 2012–2014 to maximize non-zero lesion count coverage of distance intervals, with 95% confidence intervals.
Figure S3 Cumulative mass functions (discrete) of progeny lesions observed as a function of distance from a single source lesion on (a) leaf 1 (flag), (b) leaf 2, (c) leaf 4 and (d) leaf 5.
Figure S4 Cumulative mass functions (discrete) of proportion of total observed progeny lesions as a function of distance from a single source lesion on (a) leaf 1 (flag), (b) leaf 2, (c) leaf 4 and (d) leaf 5.
Acknowledgments
The authors acknowledge financial support from the NSF/NIH/USDA/BBSRC Ecology and Evolution of Infectious Disease (EEID) Program through NSF award 052756, NIH award R01GM96685, and USDA-NIFA Award 2015-67013-23818 and by the Oregon Agricultural Experiment Station. They thank Macy Farms for collaboration on field experiments, and would like to thank Dr Laura Estep, Christina Haggerty, Dr Christian Lannou, Dr Walter Mahaffee, Christina Mielke, Kathryn Sackett, Dr Paul Severns, Emily Sykes and Joe Taylor for their generous help conducting this study.
Footnotes
Supporting Information: Additional Supporting Information may be found in the online version of this article at the publisher's web-site.
References
- Andow DA, Kareiva PM, Levin SA, Okubo A. Spread of invading organisms. Landscape Ecology. 1990;4:177–88. [Google Scholar]
- Asea G, Bigirwa G, Adipala E, Owera S, Pratt RC, Lipps PE. Effect of Cercospora zeae-maydis infested maize residue on progress and spread of grey leaf spot of maize in central Uganda. Annals of Applied Biology. 2002;140:177–85. [Google Scholar]
- Aylor DE. Biophysical scaling and the passive dispersal of fungus spores: relationship to integrated pest management strategies. Agricultural and Forest Meteorology. 1999;97:275–92. [Google Scholar]
- Bélisle CJP. Convergence theorems for a class of simulated annealing algorithms on Rd. Journal of Applied Probability. 1992;29:885–95. [Google Scholar]
- van den Berg F, Gaucel S, Lannou C, Gilligan CA, van den Bosch F. High levels of auto-infection in plant pathogens favour short latent periods: a theoretical approach. Evolutionary Ecology. 2012;27:409–28. [Google Scholar]
- Brøseth H, Tufto J, Pedersen HC, Steen H, Kastdalen L. Dispersal patterns in a harvested willow ptarmigan population. Journal of Applied Ecology. 2005;42:453–9. [Google Scholar]
- Brown JKM, Hovmøller MS. Aerial dispersal of pathogens on the global and continental scales and its impact on plant disease. Science. 2002;297:537–41. doi: 10.1126/science.1072678. [DOI] [PubMed] [Google Scholar]
- Chen XM. Epidemiology and control of stripe rust (Puccinia striiformis f. sp. tritici) on wheat. Canadian Journal of Plant Pathology. 2005;27:314–37. [Google Scholar]
- Eversmeyer MG, Kramer CL, Hassan ZM. Environmental influences on the establishment of Puccinia recondita infection structures. Plant Disease. 1988;72:409–12. [Google Scholar]
- Fitt BDL, McCartney HA, West JS. Dispersal of foliar plant pathogens: mechanisms, gradients and spatial patterns. In: Cooke BM, Jones DG, Kaye B, editors. The Epidemiology of Plant Diseases. 2nd. Dordrecht, Netherlands: Springer; 2006. pp. 159–92. [Google Scholar]
- Frezal L, Robert C, Bancal MO, Lannou C. Local dispersal of Puccinia triticina and wheat canopy structure. Phytopathology. 2009;99:1216–24. doi: 10.1094/PHYTO-99-10-1216. [DOI] [PubMed] [Google Scholar]
- Geagea L, Huber L, Sache I. Removal of urediniospores of brown (Puccinia recondita f. sp. tritici) and yellow (P. striiformis) rusts of wheat from infected leaves submitted to a mechanical stress. European Journal of Plant Pathology. 1997;103:785–93. [Google Scholar]
- Geagea L, Huber L, Sache I. Dry-dispersal and rain-splash of brown (Puccinia recondita f. sp. tritici) and yellow (P. striiformis) rust spores from infected wheat leaves exposed to simulated raindrops. Plant Pathology. 1999;48:472–82. [Google Scholar]
- Gitaitis RD, Dowler CC, Chalfant RB. Epidemiology of tomato spotted wilt in pepper and tomato in southern Georgia. Plant Disease. 1998;82:752–6. doi: 10.1094/PDIS.1998.82.7.752. [DOI] [PubMed] [Google Scholar]
- Hastings A, Cuddington K, Davies KF, et al. The spatial spread of invasions: new developments in theory and evidence. Ecology Letters. 2005;8:91–101. [Google Scholar]
- Heino J. Environmental heterogeneity, dispersal mode, and co-occurrence in stream macroinvertebrates. Ecology and Evolution. 2013;3:344–55. doi: 10.1002/ece3.470. [DOI] [PMC free article] [PubMed] [Google Scholar]
- Holland JD. Dispersal kernel determines symmetry of spread and geographical range for an insect. International Journal of Ecology. 2010;2009:e167278. [Google Scholar]
- Hovmøller MS, Justesen AF, Brown JKM. Clonality and long-distance migration of Puccinia striiformis f. sp. tritici in north-west Europe. Plant Pathology. 2002;51:24–32. [Google Scholar]
- Kelly M, Troen I, Jørgensen HE. Weibull-k revisited: ‘tall’ profiles and height variation of wind statistics. Boundary Layer Meteorology. 2014;152:107–24. [Google Scholar]
- Kot M, Lewis MA, van den Driessche P. Dispersal data and the spread of invading organisms. Ecology. 1996;77:2027–42. [Google Scholar]
- Lannou C, Soubeyrand S, Frezal L, Chadœuf J. Autoinfection in wheat leaf rust epidemics. New Phytologist. 2008;177:1001–11. doi: 10.1111/j.1469-8137.2007.02337.x. [DOI] [PubMed] [Google Scholar]
- Ligges U, Mächler M. Scatterplot3d – an R package for visualizing multivariate data. Journal of Statistical Software. 2003;8:1–20. [Google Scholar]
- Leonard KJ. Factors affecting rates of stem rust increase in mixed plantings of susceptible and resistant oat varieties. Phytopathology. 1969;59:1845–50. [Google Scholar]
- MacHardy WE. Apple Scab: Biology, Epidemiology, and Management. St Paul, MN, USA: APS Press; 1996. [Google Scholar]
- Mundt CC. Use of the modified Gregory model to describe primary disease gradients of wheat leaf rust produced from area sources of inoculum. Phytopathology. 1989;79:241–6. [Google Scholar]
- Mundt CC. Use of multiline cultivars and cultivar mixtures for disease management. Annual Review of Phytopathology. 2002;40:381–410. doi: 10.1146/annurev.phyto.40.011402.113723. [DOI] [PubMed] [Google Scholar]
- Mundt CC. Importance of autoinfection to the epidemiology of polycyclic foliar disease. Phytopathology. 2009;99:1116–20. doi: 10.1094/PHYTO-99-10-1116. [DOI] [PubMed] [Google Scholar]
- Mundt CC, Leonard KJ. A modification of Gregory's model for describing plant disease gradients. Phytopathology. 1985;75:930–5. [Google Scholar]
- Mundt CC, Leonard KJ. Analysis of factors affecting disease increase and spread in mixtures of immune and susceptible plants in computer-simulated epidemics. Phytopathology. 1986;76:832–40. [Google Scholar]
- Mundt CC, Sackett KE. Spatial scaling relationships for spread of disease caused by a wind-dispersed plant pathogen. Ecosphere. 2012;3 doi: 10.1890/ES11-00281.1. art24. [DOI] [PMC free article] [PubMed] [Google Scholar]
- Mundt CC, Sackett KE, Wallace LD, Cowger C, Dudley JP. Long-distance dispersal and accelerating waves of disease: empirical relationships. The American Naturalist. 2009a;173:456–66. doi: 10.1086/597220. [DOI] [PubMed] [Google Scholar]
- Mundt CC, Sackett KE, Wallace LD, Cowger C, Dudley JP. Aerial dispersal and multiple-scale spread of epidemic disease. EcoHealth. 2009b;6:546–52. doi: 10.1007/s10393-009-0251-z. [DOI] [PubMed] [Google Scholar]
- Mundt CC, Sackett KE, Wallace LD. Landscape heterogeneity and disease spread: experimental approaches with a plant pathogen. Ecological Applications. 2010;21:321–8. doi: 10.1890/10-1004.1. [DOI] [PubMed] [Google Scholar]
- Neubert M, Kot M, Lewis MA. Dispersal and pattern formation in a discrete-time predator–prey model. Theoretical Population Biology. 1995;48:7–43. [Google Scholar]
- Quinn LD, Matlaga DP, Stewart JR, Davis AS. Empirical evidence of long-distance dispersal in Miscanthus sinensis and Miscanthus × giganteus. Invasive Plant Science and Management. 2011;4:142–50. [Google Scholar]
- Rapilly F. Yellow rust epidemiology. Annual Review of Phytopathology. 1979;17:59–73. [Google Scholar]
- R Development Core Team. R: A Language and Environment for Statistical Computing. Vienna, Austria: R Foundation for Statistical Computing; 2015. [Google Scholar]
- Sackett KE, Mundt CC. Primary disease gradients of wheat stripe rust in large field plots. Phytopathology. 2005;95:983–91. doi: 10.1094/PHYTO-95-0983. [DOI] [PubMed] [Google Scholar]
- Schmidt KA, Ostfeld RS. Biodiversity and the dilution effect in disease ecology. Ecology. 2001;82:609–19. [Google Scholar]
- Severns PM, Estep LK, Sackett KE, Mundt CC. Degree of host susceptibility in the initial disease outbreak influences subsequent epidemic spread. Journal of Applied Ecology. 2014;51:1622–30. doi: 10.1111/1365-2664.12326. [DOI] [PMC free article] [PubMed] [Google Scholar]
- Shrum R. Simulation of Wheat Stripe Rust (Puccinia striiformis West) using epidemic, a Flexible Plant Disease Simulator. University Park, PA, USA: Pennsylvania State University Agricultural Experiment Station; 1975. [Google Scholar]
- Van de Water PK, Watrud LS, Lee EH, Burdick C, King GA. Long-distance GM pollen movement of creeping bentgrass using modeled wind trajectory analysis. Ecological Applications. 2007;17:1244–56. doi: 10.1890/06-0962. [DOI] [PubMed] [Google Scholar]
- Van der Plank JE. Plant Diseases: Epidemics and Control. New York, NY, USA: Academic Press; 1963. [Google Scholar]
- Waggoner PE, Rich S. Lesion distribution, multiple infection, and the logistic increase of plant disease. Proceedings of the National Academy of Sciences, USA. 1981;78:3292–5. doi: 10.1073/pnas.78.6.3292. [DOI] [PMC free article] [PubMed] [Google Scholar]
- Wellings CR. Global status of stripe rust: a review of historical and current threats. Euphytica. 2011;179:129–41. [Google Scholar]
- Willocquet L, Sombardier A, Blancard D, Jolivet J, Savary S. Spore dispersal and disease gradients in strawberry powdery mildew. Canadian Journal of Plant Pathology. 2008;30:434–41. [Google Scholar]
- Wingen LU, Shaw MW, Brown JKM. Long-distance dispersal and its influence on adaptation to host resistance in a heterogeneous landscape. Plant Pathology. 2013;62:9–20. [Google Scholar]
- Woolhouse MEJ, Dye C, Etard JF, et al. Heterogeneities in the transmission of infectious agents: Implications for the design of control programs. Proceedings of the National Academy of Sciences, USA. 1997;94:338–42. doi: 10.1073/pnas.94.1.338. [DOI] [PMC free article] [PubMed] [Google Scholar]
- Wright JS. Plant diversity in tropical forests: a review of mechanisms of species coexistence. Oecologia. 2002;130:1–14. doi: 10.1007/s004420100809. [DOI] [PubMed] [Google Scholar]
- Zadoks JC, Van den Bosch F. On the spread of plant disease: a theory on foci. Annual Review of Phytopathology. 1994;32:503–21. doi: 10.1146/annurev.py.32.090194.002443. [DOI] [PubMed] [Google Scholar]
- Zawolek MC, Zadoks JC. Studies in focus development: an optimum for the dual dispersal of plant pathogens. Phytopathology. 1992;82:1288–97. [Google Scholar]
Associated Data
This section collects any data citations, data availability statements, or supplementary materials included in this article.
Supplementary Materials
Figure S1 R Code.
Figure S2 Linear regression of log-transformed lesions, normalized by setting the amount of disease at the source to 1, as a function of log-transformed distance with best-fit c offset, aggregated from all plots 2012–2014 to maximize non-zero lesion count coverage of distance intervals, with 95% confidence intervals.
Figure S3 Cumulative mass functions (discrete) of progeny lesions observed as a function of distance from a single source lesion on (a) leaf 1 (flag), (b) leaf 2, (c) leaf 4 and (d) leaf 5.
Figure S4 Cumulative mass functions (discrete) of proportion of total observed progeny lesions as a function of distance from a single source lesion on (a) leaf 1 (flag), (b) leaf 2, (c) leaf 4 and (d) leaf 5.


