Abstract
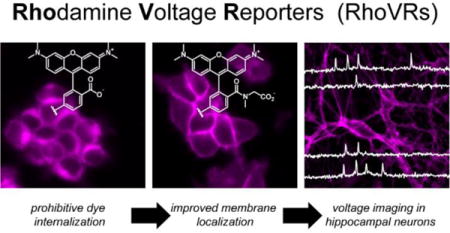
We present the design, synthesis, and application of a new family of fluorescent voltage indicators based on isomerically pure tetramethylrhodamines. These new Rhodamine Voltage Reporters, or RhoVRs, use photoinduced electron transfer (PeT) as a trigger for voltage sensing, display excitation and emission profiles in the green to orange region of the visible spectrum, demonstrate high sensitivity to membrane potential changes (up to 47% ΔF/F per 100 mV), and employ a tertiary amide derived from sarcosine, which aids in membrane localization and simultaneously simplifies the synthetic route to the voltage sensors. The most sensitive of the RhoVR dyes, RhoVR 1, features a methoxy-substituted diethylaniline donor and phenylenevinylene molecular wire in the 5′-position of the rhodamine aryl ring, the highest voltage-sensitivity to date for red-shifted PeT-based voltage sensors, and is compatible with simultaneous imaging alongside GFP-based indicators. The discoveries that sarcosine-based tertiary amides in the context of molecular wire voltage indicators prevent dye internalization, along with the improved voltage sensitivity of 5′-substituted voltage indicators should be broadly applicable to other types of PeT-based voltage-sensitive fluorophores.
Graphical abstract

Cells expend a large amount of energy to maintain an unequal distribution of ions across the plasma membrane, resulting in a transmembrane voltage or potential (Vm).1 Fast changes in Vm are responsible for the distinct cellular physiology of neurons and cardiomyocytes, and mounting evidence points to the importance of Vm in shaping fundamental cellular processes, such as differentiation, migration, and division, across a number of cell types.2 Traditionally, changes in Vm have been monitored using electrodes, which are highly invasive and limited in throughput.3 Broadly applicable and sensitive optical methods to track Vm would expand our capacity to disentangle the contributions Vm makes to human health and disease.4–6
We have recently undertaken a program to design and apply small molecule fluorescent dyes that use photoinduced electron transfer (PeT) as a molecular switch to optically monitor changes in Vm. The parent family of sensors includes VoltageFluors (VF dyes, SI Table 1),7–9 and makes use of PeT10 through a phenylene vinylene molecular wire to modulate the fluorescence intensity of a sulfonofluorescein-based reporter in a Vm-dependent fashion. More recently, we disclosed the development of BeRST 1 (Berkeley Red Sensor of Transmembrane potential, SI Table 1),11 which features the shared phenylenevinylene molecular wire along with a sulfonated silicon-rhodamine fluorophore. Although some members of the VF dye family display high voltage sensitivity (ΔF/F of 48–49% per 100 mV change),8 excitation and emission profiles in the cyan to green range limit their application alongside many common optical tools like GFP and GCaMP12 (Ca2+-sensitive GFPs). BeRST 1 partially solves this problem of spectral overlap by use of the far-red/near infra-red Si-rhodamine, but voltage sensitivity is lower compared to VF dyes (24% ΔF/F per 100 mV) and the synthetic route to BeRST 1 is low yielding, due to the inclusion of a sulfonic acid functional group on the meso aryl ring of BeRST 1. We hoped to develop a voltage-sensing scaffold that retains the high sensitivity of the VF dye series, expands the spectrum of colors available for high-fidelity voltage sensing, and circumvents the inclusion of the sulfonate group that makes synthetic efforts challenging. Towards this end we disclose the design and synthesis of the RhoVR (“rover”, Rhodamine Voltage Reporters) family of tetramethylrhodamine-based PeT voltage indicators. We have synthesized four new RhoVR dyes, which display excitation and emission profiles spectrally distinct from both VF and BeRST-type dyes, feature voltage sensitivities ranging from 3 to 47% ΔF/F per 100 mV, and make use of an ortho-tertiary amide instead of a sulfonate to achieve membrane localization.
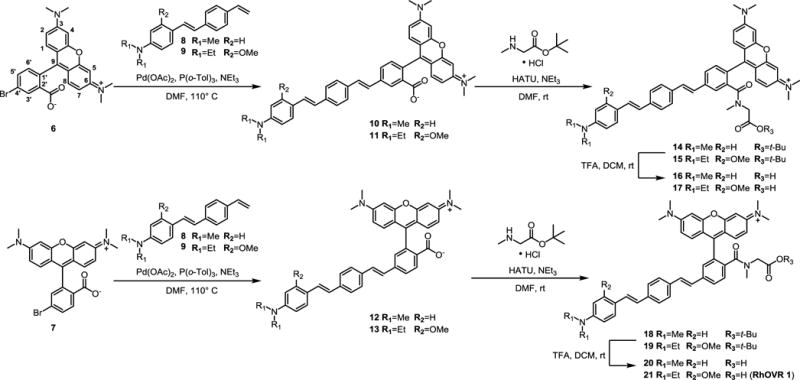
Tetramethylrhodamine (TMR)-based voltage indicators were synthesized in isomerically pure form from the 4′- and 5′-bromo TMR derivatives (Scheme 1). We generated isomerically pure rhodamines by condensation of dimethylaminophenol with the corresponding 2-carboxybenzaldehydes (3 and 5, SI Scheme 1), which were prepared in 79% and 88% yield over a two-step radical bromination followed by hydrolysis of either commercially-available 5-bromophthalide 4 or 6-bromophtalide 2 (prepared from commercially-available phthalide 1 in 62% yield, SI Scheme 1).13,14 Separation of isomers at the 6-bromophthalide stage obviates the need to separate isomers at the rhodamine stage: addition of dimethylaminophenol occurs exclusively at the electrophilic aldehyde carbonyl.15 Condensation of dimethylaminophenol with carboxybezaldehyde in propionic acid in the presence of catalytic PTSA15 gave 4′- and 5′-bromoTMR derivatives in 35% (6) and 57% (7) yield after purification by silica gel chromatography (SI Scheme 2). Subsequent Pd-catalyzed Heck coupling with substituted styrenes 8 or 9 (SI Scheme 3) gave the TMR-based voltage sensors in yields ranging from 41–55%, following silica gel purification. Formation of an N-methyl glycine-derived tertiary amide mediated by HATU gave the t-butyl ester protected voltage sensors in >70% yield, which exists as a mixture of rotamers around the sarcosinyl-amide bond, as determined by VT-NMR (SI Fig. 1). TFA-catalyzed deprotection of the t-butyl ester gave the final voltage sensors in 7–18% yield over two steps after reversed-phase HPLC purification.
Scheme 1.

Synthesis of isomerically pure rhodamine voltage sensors.
Each RhoVR displayed absorption and emission profiles centered at 564–565 nm (ε = 70,000 to 87,000 M−1 cm−1, SI Fig. 2). A strong secondary absorbance band near 400 nm indicated the presence of the phenylenevinylene molecular wire (SI Fig. 2). Emission from all RhoVRs was centered at 587 nm (Φ = 0.89% to 9.2%, Table 1). The low Φ values may indicate variable levels of PeT within the compounds.
Table 1.
Properties of RhoVRs
| Compound | ε (M−1cm−1)a |
Φ (λmax)a |
ΔF/F (100 mV)b |
SNR (100 mV)b |
|---|---|---|---|---|
| 16 | 75,000 (565 nm) | 0.036 (586 nm) |
3% (±0.2%) | 19:1 |
| 17 | 70,000 (565 nm) | 0.092 (588 nm) |
26% (±3%) | 37:1 |
| 20 | 77,000 (564 nm) | 0.0089 (586 nm) |
7% (±1%) | 96:1 |
|
21 (RhoVR 1) |
87,000 (564 nm) | 0.045 (588 nm) |
47% (±3%) | 160:1 |
PBS, pH 7.2, 0.1% SDS
voltage-clamped HEK cells
All sarcosine-substituted RhoVRs (500 nM, imaged in dye-free HBSS) localized well to the plasma membrane of HEK cells, as determined by fluorescence microscopy (Fig. 1a,b, SI Fig. 3–5). Control experiments conducted with TMR derivatives lacking the sarcosine amide (i.e. free carboxylate, 10–13) show strong internal membrane staining (Fig. 1a). The dramatic change in cellular localization is consistent with our hypothesis that inclusion of a charged tertiary amide in the ortho position of the pendant aryl ring prevents formation a neutral spirocycle and subsequent cellular dye uptake. The use of carboxylate derivatives drastically simplifies the synthetic route to make long-wavelength voltage indicators.
Figure 1.

Cellular characterization of rhodamine-based voltage indicators. Confocal fluorescence images of HEK cells stained with a) compound 13 (no sarcosine amide) or b) RhoVR 1 (compound 21, with sarcosine amide). Incorporation of the tertiary amide based on sarcosine results in a clear enhancement of membrane-localized fluorescence (panels a vs b). Membrane-localized RhoVR 1 fluorescence is voltage-sensitive. c) The fractional change in fluorescence is plotted vs. time for 100 ms hyper- and depolarizing steps (±100 mV, 20 mV increments) from a holding potential of −60 mV for a single HEK cells under whole-cell voltage-clamp mode. d) A plot of % ΔF/F vs. final membrane potential (mV), summarizing data from 9 separate cells, reveals a voltage sensitivity of approximately 47% per 100 mV. Error bars are ±S.E.M. Scale bar is 10 μm.
The voltage sensitivity of each RhoVR was assessed in HEK cells using patch-clamp electrophysiology in whole-cell, voltage-clamp mode. Hyper- and depolarizing voltage steps spanning a range from −100 mV to +100 mV in 20 mV increments from a holding potential of −60 mV provided voltage sensitivities of 3% to 47%, depending on the dye (Table 1, Fig. 1c,d, SI Fig. 6). Compound 21, which we dubbed RhoVR 1, emerged as the most voltage-sensitive dye (Table 1). Dyes bearing methoxy substitution on the aniline (17 and 21) showed improved voltage sensitivity relative to unsubstituted anilines (26% (17) vs. 3% (16) and 47% (21, RhoVR 1) vs. 7% (20)), as observed for fluorescein-based voltage indicators.8 We also observed that voltage indicators derived from 5′-substituted rhodamines were both more voltage-sensitive (47% (21, RhoVR 1) vs 26% (17) and 7% (20) vs. 3% (16)) and brighter in cells (SI Fig. 3). Studies are underway to probe the nature of this difference. Given the high sensitivity and brightness of RhoVR 1 in cells, we chose this dye to evaluate in subsequent experiments. RhoVR 1 has photostability comparable to VF2.1.Cl (SI Fig. 3e).
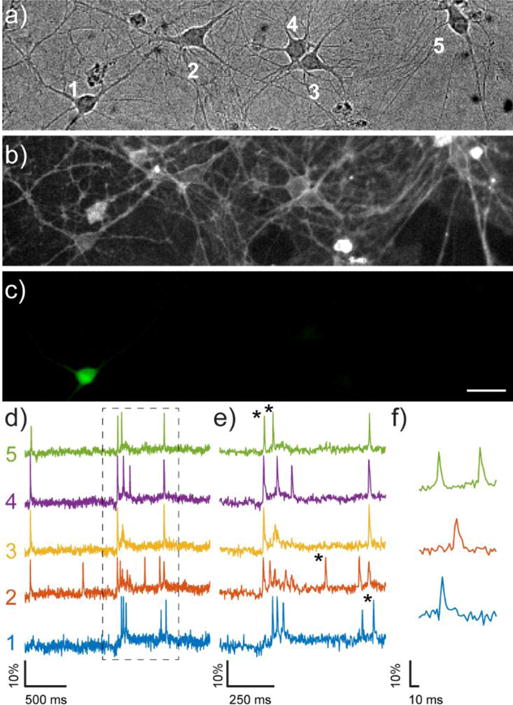
When bath-applied to cultured rat hippocampal neurons, RhoVR1 gave distinct membrane-associated staining. The clear membrane staining, coupled with the high voltage-sensitivity of RhoVR 1 enabled detection of spontaneously firing action potentials with an average ΔF/F of 15% (N = 27 spikes) and signal-to-noise ratios (SNRs) ranging from 10:1 to 20:1 that were largely dependent on the illumination intensity used (1.7 to 3.1 W/cm2) (Fig. 2, cells 2–5). To confirm that spiking events we observed arose from action potentials, we treated actively firing cultures with tetrodotoxin (TTX), a sodium channel toxin which inhibits action potential firing, and observed no spiking activity after TTX treatment (SI Fig. 7).
Figure 2.

Imaging spontaneous neuronal activity with RhoVR 1 and GFP. Rat hippocampal neurons (DIC, a) were stained with 500 nM RhoVR (fluorescence, b). A small number of neurons transiently expressed GFP (fluorescence, c). Scale bar is 20 μm. d) The spontaneous activity of the neurons in panel a/b were recorded optically at 500 Hz using RhoVR 1. d) The activity of each neuron (1–5, panel a) is displayed as a trace of fluorescence intensity vs. time. The boxed regions in panel d are shown on an expanded scale in part e. Asterisks indicate traces expanded in panel f.
RhoVR 1 represents the most sensitive red-shifted PeT-based voltage indicator to date: VF2.1(OMe).Cl has a voltage sensitivity of 49%,8 but emission at 536 nm while BeRST 1 has bathochromic emission at 680 nm, but only a 24% voltage sensitivity.11 Given the success of far-red voltage dyes like BeRST 1 in integrating multiple functional signals simultaneously, we wondered whether we might be able to perform two-color imaging simultaneously with RhoVR 1, despite the tighter optical overlap between rhodamines and GFP-based chromophores. Expression of cytosolic GFP in HEK cells stained with RhoVR 1 did not result in significant bleed-through of GFP fluorescence into the rhodamine channel and did not substantially diminish the voltage sensitivity of RhoVR-1 in voltage-clamped HEK cells (47±3% without vs. 45±1% with GFP, SI Fig. 8). Furthermore, cytosolic GFP in cultured neurons did not attenuate our ability to track action potentials in spontaneously firing neurons in culture (Fig. 2). Indeed, when imaging spontaneous activity in cultured rat hippocampal neurons, we were able to clearly distinguish distinct spiking events arising from neighboring cells (Fig 2b,d; neurons 3 and 4) and clearly resolve spikes in neurons expressing GFP in single trials (Fig. 2b,c, and d; neuron 1).
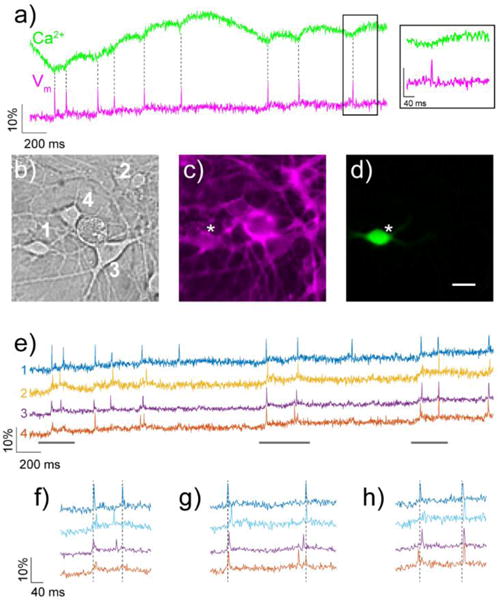
Encouraged by these results, we next sought to image voltage and Ca2+ dynamics simultaneously16 by exciting the specimen with green and blue light and splitting the resulting emission to capture rhodamine and GFP fluorescence in parallel (SI Scheme 4). Brief rises in intracellular [Ca2+] (Ca2+ transients), on the order of hundreds of milliseconds, are used as a surrogate for neuronal membrane depolarizations and are often monitored with green-fluorescent Ca2+ sensitive fluorophores like the genetically-engineered, Ca2+-sensitive GFP, GCaMP.12 We expressed GCaMP6s, on account of its excellent sensitivity to Ca2+ released in response to single action potentials,12 in cultured hippocampal neurons and incubated these neurons with RhoVR 1 (500 nM). Using an image-splitter (SI Scheme 4) to separate emitted photons according to wavelength, we recorded Ca2+ transients via GCaMP6s fluorescence and voltage spikes via RhoVR 1 fluorescence. Under these conditions, hippocampal neurons again displayed significant amounts of spontaneous spiking activity in multiple, distinct neurons, as detected by GCaMP6 (Fig. 3a, green) and RhoVR 1 (Fig. 3a, magenta).
Figure 3.

Simultaneous, two-color imaging of voltage and Ca2+ in hippocampal neurons using RhoVR 1 and GCaMP6s. a) The green trace shows the relative change in fluorescence from Ca2+-sensitive GCaMP6s, while the magenta traces depicts relative fluorescence changes in RhoVR 1 fluorescence from neuron “1” in panel b. Inset shows an expand time scale of the boxed region. b) DIC image of neurons expressing GCaMP6s and stained with RhoVR 1. c) Fluorescence image showing membrane localization of RhoVR 1 fluorescence from neurons in panel (b). d) Fluorescence image of neurons in (b) showing GCaMP6s fluorescence. Scale bar is 20 μm. e) Traces show the activity of each neuron in panels (b–d), displayed as the fractional change in voltage-sensitive RhoVR 1 fluorescence vs. time. (f–g) Regions of traces in panel (e) are shown in an expanded time scale to compare the spike timing of imaged neurons.
The sensitivity of RhoVR 1 to these action potentials was similar to values obtained in experiments recorded at a single wavelength alone (ΔF/F per spike = 9.5%, SNR = 12:1, N = 70 spikes, Fig. 3a, e–g). Typically, one neuron expressed high levels of GCaMP6s fluorescence in a field of view (Fig. 3d), which enabled us to directly compare transient rises in Ca2+ with fast voltage spikes in the same neuron (Fig. 3a). In all cases, the fast voltage spike clearly precedes the subsequent Ca2+ transient. RhoVR 1 displays comparable or better ΔF/F values for single spikes relative to the corresponding Ca2+ transient in the same cell (Fig. 3a, SI Movie 1). Because of the inherently fast kinetics of Vm relative to Ca2+, monitoring Vm directly via RhoVR 1 enables resolution and precise timing of spikes occurring in quick succession from multiple cells, which would be impossible using more traditional approaches like Ca2+ imaging or single-cell electrophysiology (Fig. 3f–h).
In summary, we present the design, synthesis, and application of four members of a new class of voltage-sensitive dyes based on tetramethylrhodamine. All of the new sensors display excitation and emission profiles greater than 550 nm, good photostability, and varying degrees of voltage sensitivity in patch-clamped HEK cells. The best of the new voltage indicators, RhoVR 1, displays a voltage sensitivity of 47% ΔF/F per 100 mV, rivaling the sensitivity of the fluorescein-based VF2.1(OMe).H (49% ΔF/F per 100 mV)8 and surpassing that of our most red-shifted probe, BeRST 1, (24% ΔF/F per 100 mV).11 Although the excitation and emission spectrum of RhoVR 1 is blue-shifted relative to BeRST 1, the TMR optical profile still provides ample spectral separation to perform two-color imaging alongside other optical probes, such as GFP and the GCaMP family of sensors. Using a combination of GCaMP6s and RhoVR 1, we simultaneously imaged Ca2+ transients and membrane potential depolarizations in cultured hippocampal neurons, establishing that RhoVR 1 and related compounds will be useful for parsing the roles of Ca2+ and Vm in living cells.
Taken together, these data demonstrate the utility of sarcosine-substituted rhodamines dyes for voltage sensing in living cells. The incorporation of the 2′-carboxylate simplifies the synthetic route to long wavelength voltage sensors by avoiding highly polar sulfonates, which complicate purification, and subsequent modification with sarcosine prevents the internalization that plagues unfunctionalized xanthene-based voltage indicators. Inclusion of the free carboxylate on sarcosine provides a convenient handle for subsequent functionalization and localization to genetically-encoded protein partners or delivery agents. Furthermore, expansion of PeT-based voltage indicators to include rhodamines offers a new optical channel for use in voltage sensing and demonstrates the versatility and generality of a PeT-based approach to voltage sensing. We were pleasantly surprised to find that the 5′-substituted rhodamines showed greater voltage sensitivity than the 4′-substituted dye, which has been the typical substitution pattern for our previous molecular wire voltage sensors and many PeT-based analyte sensors.17–19 Experiments are underway to probe the nature of this voltage sensitivity enhancement as well as to apply this substitution pattern to future generations of voltage-sensitive dyes and other sensing platforms.
Supplementary Material
Acknowledgments
The authors acknowledge generous support from the University of California, Berkeley, Hellman Foundation, the March of Dimes (5-FY16-65), and the NIH (R00 NS07581). RUK was supported in part by an NIH Chemical Biology Training grant (T32 GM066698). Confocal imaging was performed at the CRL Molecular Imaging Center, UC Berkeley. We thank Dr. Alison Walker and Pei Liu for expert technical assistance with neuronal cultures and Dr. Hasan Celik for help with VT-NMR studies.
Footnotes
Supporting information
Synthetic details, spectroscopic analysis, and supplemental cell imaging data. This material is available free of charge via the Internet at http://pubs.acs.org.
References
- 1.Engl E, Attwell D. J Physiol-London. 2015;593:3417. doi: 10.1113/jphysiol.2014.282517. [DOI] [PMC free article] [PubMed] [Google Scholar]
- 2.Levin M. Mol Biol Cell. 2014;25:3835. doi: 10.1091/mbc.E13-12-0708. [DOI] [PMC free article] [PubMed] [Google Scholar]
- 3.Peterka DS, Takahashi H, Yuste R. Neuron. 2011;69:9. doi: 10.1016/j.neuron.2010.12.010. [DOI] [PMC free article] [PubMed] [Google Scholar]
- 4.Braubach O, Cohen LB, Choi Y. In: Adv Exp Med Biol. Canepari M, Zecevic D, Bernus O, editors. Vol. 859. 2015. p. 3. [PubMed] [Google Scholar]
- 5.Loew LM. In: Adv Exp Med Biol. Canepari M, Zecevic D, Bernus O, editors. Vol. 859. 2015. p. 27. [PubMed] [Google Scholar]
- 6.Miller EW. Curr Opin Chem Biol. 2016;33:74. doi: 10.1016/j.cbpa.2016.06.003. [DOI] [PMC free article] [PubMed] [Google Scholar]
- 7.Miller EW, Lin JY, Frady EP, Steinbach PA, Kristan WB, Jr, Tsien RY. Proc Natl Acad Sci U S A. 2012;109:2114. doi: 10.1073/pnas.1120694109. [DOI] [PMC free article] [PubMed] [Google Scholar]
- 8.Woodford CR, Frady EP, Smith RS, Morey B, Canzi G, Palida SF, Araneda RC, Kristan WB, Jr, Kubiak CP, Miller EW, Tsien RY. J Am Chem Soc. 2015;137:1817. doi: 10.1021/ja510602z. [DOI] [PMC free article] [PubMed] [Google Scholar]
- 9.Grenier V, Walker AS, Miller EW. J Am Chem Soc. 2015;137:10894. doi: 10.1021/jacs.5b05538. [DOI] [PMC free article] [PubMed] [Google Scholar]
- 10.Li LS. Nano Lett. 2007;7:2981. doi: 10.1021/nl071163p. [DOI] [PubMed] [Google Scholar]
- 11.Huang YL, Walker AS, Miller EW. J Am Chem Soc. 2015;137:10767. doi: 10.1021/jacs.5b06644. [DOI] [PMC free article] [PubMed] [Google Scholar]
- 12.Chen TW, Wardill TJ, Sun Y, Pulver SR, Renninger SL, Baohan A, Schreiter ER, Kerr RA, Orger MB, Jayaraman V, Looger LL, Svoboda K, Kim DS. Nature. 2013;499:295. doi: 10.1038/nature12354. [DOI] [PMC free article] [PubMed] [Google Scholar]
- 13.Mirabdolbaghi R, Dudding T. Org Lett. 2012;14:3748. doi: 10.1021/ol301566f. [DOI] [PubMed] [Google Scholar]
- 14.Clark RB, Hunt DK, Plamondon L, Sun C, Xiao XY, Roenn M. WO2010132670A2 Tetraphase Pharmaceuticals, Inc, USA. 2010
- 15.Mudd G, Perez Pi I, Fethers N, Dodd PG, Barbeau OR, Auer M. Methods Appl Fluoresc. 2015;3:045002. doi: 10.1088/2050-6120/3/4/045002. (6 pp.) [DOI] [PubMed] [Google Scholar]
- 16.Jaafari N, Vogt KE, Saggau P, Leslie LM, Zecevic D, Canepari M. In: Adv Exp Med Biol. Canepari M, Zecevic D, Bernus O, editors. Vol. 859. 2015. p. 103. [DOI] [PMC free article] [PubMed] [Google Scholar]
- 17.Minta A, Kao JPY, Tsien RY. J Biol Chem. 1989;264:8171. [PubMed] [Google Scholar]
- 18.Dodani SC, He QW, Chang CJ. J Am Chem Soc. 2009;131:18020. doi: 10.1021/ja906500m. [DOI] [PMC free article] [PubMed] [Google Scholar]
- 19.Egawa T, Hirabayashi K, Koide Y, Kobayashi C, Takahashi N, Mineno T, Terai T, Ueno T, Komatsu T, Ikegaya Y, Matsuki N, Nagano T, Hanaoka K. Angew Chem Int Edit. 2013;52:3874. doi: 10.1002/anie.201210279. [DOI] [PubMed] [Google Scholar]
Associated Data
This section collects any data citations, data availability statements, or supplementary materials included in this article.


