Abstract
Aortic dissection (AD), a severe cardiovascular disease with the characteristics of high mortality, is lack of specific clinical biomarkers. In order to facilitate the diagnosis of AD, we investigated plasma amino acid profile through metabolomics approach. Total 33 human subjects were enrolled in the study: 11 coronary heart disease (CHD) patients without aortic lesion and 11 acute AD and 11 chronic AD. Amino acids were identified in plasma using liquid chromatography and mass spectrometry (LC-MS/MS), and were further subjected to multiple logistic regression analysis. The score plots of principal component analysis (PCA) and partial least squares-discriminate analysis (PLS-DA) showed clear discrimination of CHD patients with AD, acute AD or chronic AD patients, respectively. The contents of histidine, glycine, serine, citrate, ornithine, hydroxyproline, proline and sarcosine were significant different in acute AD patients comparing with CHD patients. The levels of citrate, GABA, glutamate and cysteine were significant different in chronic AD patients comparing with CHD patients. The contents of glutamate and phenylalanine were significant changed in acute AD patients comparing with chronic AD patients. Plasma aminograms were significantly altered in patients with AD comparing with CHD, especially in acute AD, suggesting amino acid profile is expected to exploit a novel, non-invasive, objective diagnosis for AD.
Aortic dissection (AD) is a potentially lethal vascular disease with the characteristics of high mortality1. AD begins as a spontaneous tear through either the intima or the adventitia that extends into the media of the aortic wall, and the torn aorta is prone to dilatation and fatal aortic rupture. If left untreated, the mortality rate of AD can reach 50–60% within 48 hours and 80% within two weeks2, so timely diagnosis is fundamental to save lives.
At present stage, the diagnosis of AD was mainly made according to confirmatory imaging such as spiral computed tomography angiogram3, magnetic resonance imaging4 or intraoperative visualization such as transthoracic or transesophageal echocardiography5. These imaging detection are costly and frequently require patient transfer to specialized clinical centers. Furthermore, computed tomography angiogram, the most frequently used imaging detection for suspected AD, exposes patients to significant radiations and carries inherent risks of anaphylaxis and medium contrast nephropathy. Hence, development of circulating markers that can signal the onset of AD timely would be needed to assist physicians to diagnosis and further to rescue the lives of AD patients.
Among metabolites, the amino acid balance in patients with various diseases often differs from that maintained in healthy individual. Overall, 20% of the human body is composed of amino acids and their metabolites, which play important roles as both basic substrates and regulators in many metabolic pathways6. Specific abnormalities in plasma amino acids concentrations have been reported in human liver fibrosis7 and non-small cell lung cancer8. Plasma amino acid profiles were also used to discriminate patients with breast cancer, esophageal cancer, head and neck cancers, from healthy controls9,10,11. A significant increase in free tryptophan has been reported in lung cancer patients12. Therefore, metabolic changes detecting from amino acid profiles could potentially be useful in disease diagnosis.
Profiling analysis is a form of quantitative analysis aimed at a few preselected metabolites, and is one of a number of metabonomic research strategies13. Post-genomic technologies offer possibilities for exploiting amino acids profiling, especially the methods for amino acids analysis have been established using a rapid and highly performance liquid chromatography-tandem mass spectrometry (HPLC-MS/MS)14,15. New technology development reduced both the time and the cost of analysis for amino-acid measurements.
Severe pain was the most common presenting symptom and the majority of AD patients complained of chest pain which is similar with the onset of coronary artery disease16. Therefore; we investigated the possibility to use amino acid profile for discrimination of aortic dissection from coronary artery disease, and to further develop amino acid profile as a novel diagnostic method to save the lives of AD patents in time.
Methods
Patients
Enrolment was the patients from December 2010 to March 2012, who attended the Department of Cardiovascular Surgery of Renji Hospital, Shanghai Jiaotong University School of Medicine, China. In this setting, 22 consecutive AD patients were selected (AD group) on the basis of the following inclusion criteria: 1) type A Stanford dissection, 2) type B Stanford dissection, 3) no history of neoplasm, autoimmune or inflammatory systemic disease, 4) no presence of known genetic syndromes that cause aortic disease, including Marfan syndrome, or family history of aortic dissection or aneurysm. 11 CHD subjects were selected (CHD group), as follows: 1) coronary heart disease, 2) no history of vascular disease, 3) no presence of known genetic syndromes that cause CHD or family history of CHD, 4) no history of neoplasm, autoimmune or inflammatory systemic disease.
All written informed consent was obtained from each patient or family member before inclusion in this study. The Medicine Ethics Committee of Renji Hospital approved the study protocol, which also conformed to the principles of the Helsinki Declaration.
Assessment of Disease Type
Diagnosis of AD was confirmed using standard criteria by computed tomography (CT). The data were acquired using an ECG-gated dynamic 64-slice CT scanner (Sensation 64, Siemens Medical Solutions, Forchheim, Germany). Images were acquired during a single breath-hold phase of 20 seconds, during which the entire chest and abdomen were imaged. Analysis of the dynamic scans was performed using General Electric Discovery HD 750 scanner (GE Healthcare, USA). All the patients in whom the onset of AD could be clearly determined (e.g., by symptoms) were included. The AD patients were separated into acute and chronic-stage. Acute AD indicated that blood samples were drawn within the first 48 hours after dissection onset; chronic AD indicates that blood samples were drawn after 14 days from dissection onset.
Collection of Blood Samples
Peripheral venous blood samples were collected and immediately underwent plasma isolation. The blood was immediately collected into vacuette™ tubes (Greiner Bio-One, Frickenhausen, Germany). Sample was centrifuged 1000 g for 10 min at room temperature (L-500 centrifuge, Xiang-Yi, China). The plasma was then separated into aliquots in cryogenic vials (Greiner Bio-One, Frickenhausen, Germany) and stored in liquid nitrogen before analysis of amino acids as described below. Quality control (QC) samples were prepared by pooling and mixing 10 μL the sample volume of each sample.
Clinical Chemistry Measurements
Plasma biochemical analyses were carried out on an AMS-18 automatic biochemistry analyzer (Beijing Option Science&Technology Development Co., Ltd., Beijing, China) including Urea, creatinine (Cr), sodium (Na) and potassium (K). An independent sample t-test was conducted to compare the clinical biochemical data of CHD with acute AD, chronic AD or total AD, respectively. Furthermore, the independent sample t-test was also performed to compare the difference between acute AD and chronic AD.
Sample Preparation for LC-MS/MS Analysis
Samples were measured with a TRAQTM kit (AB Sciex Pte. Ltd). An aliquot (40 μL) of plasma sample was a mixed with sulfosalicylic acid (10 μL) in a tube, vortexed for 30 s at room temperature, then centrifuged (10000 g, 2 min, 4 °C) to deposit protein following. The supernatant (10 μL) was transferred into a clean tube and mixed with 40 μL borate buffer (5 mmol/L, PH 8.5). Each sample was then vortexed vigorously for 30 s at room temperature followed by centrifugation at 10000 g for 2 min. 10 μL supernatant was transferred into another tube, mixed with 5 μL iTRAQ reagent (AB Sciex Pte. Ltd), then vortexed and centrifuged. The tubes were incubated for at least 30 min at room temperature. And then the 5 μL NH2OH was added to each tube for mix and centrifugation. At last, 32 μL internal standard was added to each tube and then vortexed and centrifuged. The processing method of QC was consistent with that of plasma samples.
LC-MS/MS Parameters
Prepared samples were analyzed on a Dionex Ultimate 3000 HPLC (Dionex AG, Switzerland) which paired with a 3200 Q-TRAP mass spectrometer (AB Sciex, USA). In brief, 3 μL of each sample was injected on an AAA C18 column (150 × 4.6 mm, 5 μm particle size) at 50 °C. The mobile phase consisted of water including 0.1% formic acid (solvent A) and acetonitrile including 0.1% formic acid (solvent B). The gradient for the amino acid elution switched from 2% solvent B to 28% solvent B after 10 min; ascended to 100% solvent B in 0.1 min and maintained for 5.9 min; backed to 2% solvent B in 0.1 min and maintained for 3.9 min. The flow rate was 0.8 mL/min.
Nitrogen was used as curtain and nebuliser gas at the pressure of 20 psi (Curtain), 55 psi (GS1), and 60 psi (GS2), respectively. Desolvation temperature (TEM) was maintained at 580 °C, with the respective voltages: 5500 V (IS), 35 V (DP), 10 V (EP), 5 V (CXP). QC samples were analyzed at every 6 injections to monitor the instrument stability. We transformed the spectral map into the content of each amino acid, and saved in Excel file format. And then it was used for pattern recognition.
Pattern Recognition and Statistical Analysis
Multivariate data analysis was conducted with the software SIMCA-P+ 12.0 (Umetrics, Sweden). Principal component analysis (PCA) was performed to visualize general clustering, trends and outliers. Partial least squares projection on latent structure-discriminant analysis (PLS-DA) was subsequently conducted using the par-scaling LC-MS/MS data.
Potential markers were extracted from loading scatter plots, and the heat map was analyzed in-house by Matlab script (V7.0, Math-works, MA). In order to further select differential variables in the PLS-DA models, the cutoff value of 1 was set in the variable importance in the projection (VIP). The selected variables between AD patients and CHD controls were then performed using one way analysis of variance (ANOVA) with Tukey HSD analysis as implemented in IBM SPSS Statistics (19.0) software, and p < 0.05 was considered significant.
Results
Baseline Characteristics of Patients
The baseline characteristics of patients were mainly evaluated by plasma biochemical analysis and presented in Table 1. All the values of body mass index (BMI) were significant higher for acute AD patients (29.60 ± 7.59 kg/m2, p < 0.05), chronic AD patients (26.95 ± 4.29 kg/m2, p < 0.05) or AD patients (28.1 ± 5.9 kg/m2, p < 0.05) comparing with CHD patients (22.0 ± 3.3 kg/m2), respectively. The decline of potassium (K) level was found for acute AD (3.69 ± 0.28 mEg/L, p < 0.01), chronic AD (3.95 ± 0.37 mEg/L, p < 0.05) or AD (3.82 ± 0.34 mEg/L, p < 0.01) comparing with CHD patients (4.33 ± 0.39 mEg/L), separately. The decline of K level was also found for acute AD comparing with chronic AD ((3.69 ± 0.28 mEg/L versus 3.95 ± 0.37 mEg/L, p < 0.05). No differences were detected on age, sex, systolic blood pressure (SBP), urea, creatine (Cr) or sodium (Na) between any two groups among acute AD, chronic AD, total AD and CHD patients.
Table 1. The clinical data for the human plasma samples.
| Clinical indicator | Acute AD | Chronic AD | AD | CHD |
|---|---|---|---|---|
| Sex (M/F) | 10/1 | 10/1 | 20/2 | 10/1 |
| Age (year) | 48 ± 14 | 52 ± 10 | 50 ± 12 | 50 ± 15 |
| BMI (kg/m2) | 29.60 ± 7.59* | 26.95 ± 4.29* | 28.1 ± 5.9** | 22.0 ± 3.3 |
| SBP (mmHg) | 129.0 ± 17.71 | 134.18 ± 26.18 | 131.59 ± 21.97 | 118.91 ± 21.27 |
| Urea (mmol/L) | 7.16 ± 1.94 | 7.09 ± 2.25 | 7.12 ± 2.05 | 6.73 ± 2.12 |
| Cr (μmol/L) | 75.36 ± 17.82 | 72.05 ± 20.50 | 73.62 ± 18.82 | 71.28 ± 13.53 |
| Na (mEq/L) | 140.30 ± 5.23 | 141.30 ± 2.36 | 140.80 ± 3.98 | 141.91 ± 2.88 |
| K (mEq/L) | 3.69 ± .028**# | 3.95 ± 0.37* | 3.82 ± 0.34** | 4.33 ± 0.39 |
Values are presented as mean ± SD. *Indicates significant changes compared with CHD *p < 0.05; **p < 0.01. #Indicates significant changes from Acute AD vs. Chronic AD #p < 0.05; ##p < 0.01. BMI: body mass index; SBP: systolic blood pressure; Cr: creatine. Na: sodium; K: potassium.
LC-MS/MS Spectra of Amino Acids from Plasma
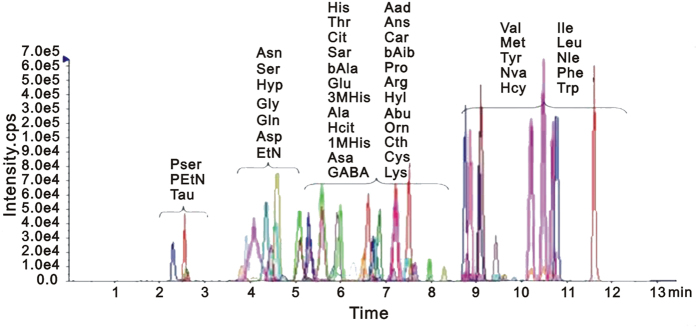
A robust and sensitive quantitative method for profiling amino acids was used. The total ion chromatograms of all samples demonstrated a strong signal, and reproducible retention time, indicating the reliability of metabolomic analysis. These amino acids were verified by ion fragment patterns and retention time through comparing with standard amino acids. Overlaid chromatogram of the marker amino acids detected by multiple reaction monitoring (MRM) was shown in Fig. 1. Obvious chromatographic differences were observed between different group samples, and a total of more than 40 amino acids were identified. These amino acids were dominated by phospho-serine (Pser), phospho-ethanolamine (PEtN), taurine (Tau), asparagines (Asn), serine (Ser), hydroxyproline (Hyp), glycine (Gly), glutamine (Gln), asparate (Asp), ethanolamine (EtN), histidine (His), threonine (Thr), citrate (Cit), sarcosine (Sar), β-alanine (bAla), glutamate (Glu), 3-Methyl-histidine (3M-His), alanine (Ala), homocitrulline (Hcit), 1-Methyl-histidine (1M-His), argininosuccinic acid (Asa), γ-amino-n-butyrate (GABA), α-amino adipic acid (Aad), anserine (Ans), carnosine (Car), β-amino isobutyric (bAib), proline (Pro), arginine (Arg), hydroxylysine (Hyl), α-amino-n-butyrate (Abu), ornithine (Orn), cysteine (Cys), lysine (Lys), valine (Val), methionine (Met), tyrosine (Tyr), norvaline (Nva), homocystine (Hcy), isoleucine (Ile), leucine (Leu), norleucine (Nle), phenylalanine (Phe) and tryptophan (Trp).
Figure 1. Overlaid chromatogram of the marker amino acids detected by multiple reaction monitoring (MRM).
The data for system repeatability and stability were listed in Table S1 (ESI+). The RSD of amino acids in QC samples were all between 0.00–14.61%, which indicated that the established sample analysis method was repeatable and stable, and could be used for metabolomics experiments.
AD and CHD Patients Were Distinguished by PCA Analysis
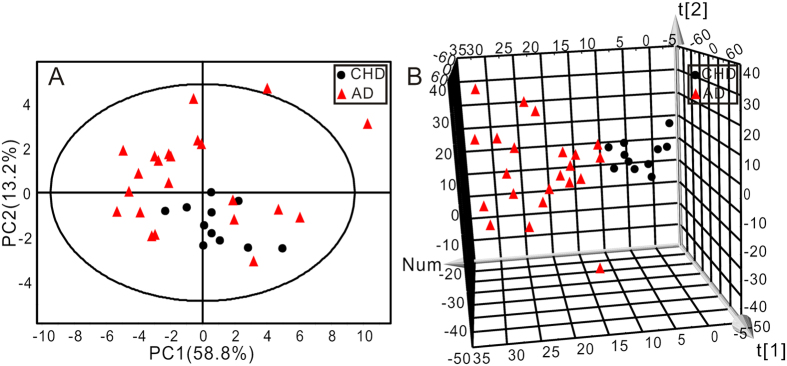
PCA was first performed to get an overview of the difference on plasma amino acid profile between CHD and AD patients. The AD group contained both acute AD and chronic AD patients. The two-dimensional (2D) score plot of PCA was shown in Fig. 2A and the three-dimensional (3D) score plot of PCA was shown in Fig. 2B. The 2D score plot of PCA analysis clustered but not separated the two groups, while 3D score plot distinguished the two groups more significantly.
Figure 2.
The score plots of two-dimensional (A) and three-dimensional (B) PCA showed the changes in the human plasma amino acids data from CHD (●) and AD ( ) groups (R2X = 68.7%, Q2 = 45.4%).
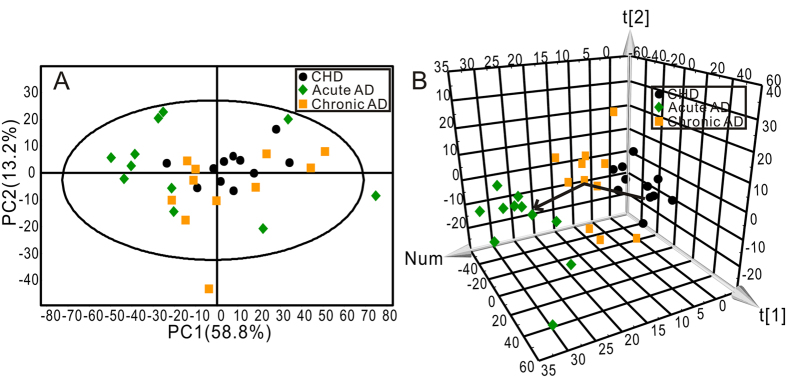
To further evaluated the change of amino acids profile with AD progression, AD group was subdivided into acute AD and chronic AD, and then PCA analysis was carried out following. The 2D score plot of PCA was shown in Fig. 3A and the 3D score plot of PCA was shown in Fig. 3B. The three subject groups could not be distinguished by 2D score plot of PCA analysis but an obvious divergent trajectory was revealed based on 3D score plot among three groups. The cluster of acute AD located farther away from CHD, and the cluster of chronic AD located between acute AD and CHD.
Figure 3.
The score plots of two-dimensional (A) and three-dimensional (B) PCA showed the changes in the human plasma amino acids data from three groups. CHD group (●), Acute AD group ( ), Chronic AD group (
 ) (R2X = 72.0%, Q2 = 48.3%).
AD and CHD Patients Were Distinguished by PLS-DA Analysis
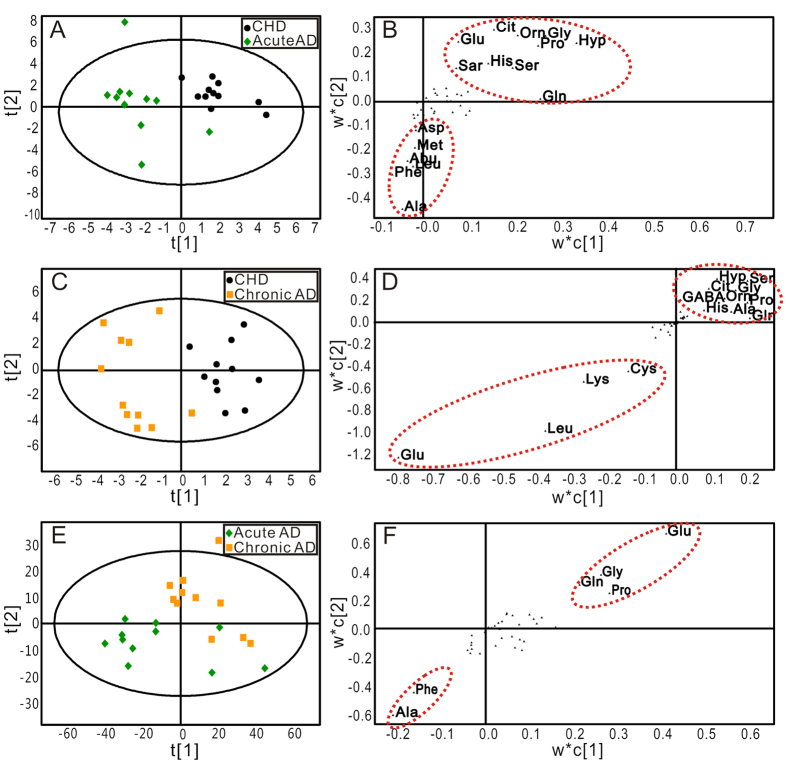
To achieve the maximum distinction and identify differential amino acids that accounted for the separation between groups, PLS-DA was conducted following PCA. The score plots of PLS-DA for acute AD and CHD (Fig. 4A), chronic AD and CHD (Fig. 4 C), and for acute AD and chronic AD (Fig. 4E) were shown, respectively. Acute AD or chronic AD was clearly separated from the CHD group, which holds a higher efficiency to distinguish between groups comparing with PCA score plots (Fig. S1 A and B). However, acute AD was not properly separated from chronic AD based on score plot of PLS-DA. The robustness of these PLS-DA classification models was assessed by 200 times permutation tests. The R2 and Q2 values were lower than the original ones, and the blue regression lines of the Q2-points intersected the vertical axis below zero, implying the validation of these PLS-DA models (Fig. S2)17.
Figure 4. The score and loading plots of PLS-DA for the plasma samples in different groups.
(A,B) PLS-DA score and loading plots of samples between CHD and Acute AD groups (R2X = 68.7%, Q2Y = 70.7%, Q2 = 42.9%); (C,D) PLS-DA score and loading plots of samples between CHD and Chronic AD groups (R2X = 46.0%, Q2Y = 89.2%, Q2 = 13.2%); (E,F) PLS-DA score and loading plots of samples between Acute AD and Chronic AD groups (R2X = 73.7%, Q2Y = 65.1%, Q2 = 39.6%). CHD group (●), Acute AD group ( ), Chronic AD group
  ).
).
The scatter loading plots of the PLS-DA, which was a pairwise comparison model, displayed the altered amino acids between two groups. Comparing with CHD patients, the levels of alanine, phenylalanine, leucine, α-amino-n-butyrate, methionine and asparate were up-regulated, while the levels of hydroxyproline, glutamine, glycine, proline, ornithine, citrate, glutamate, sarcosine, histidine and serine were down-regulated in acute AD patients (Fig. 4B). Comparing with CHD patients, the levels of glutamate, leucine, lysine and cystine were up-regulated in chronic AD patients, and the levels of hydroxyproline, serine, citrate, glycine, GABA, ornithine, proline, histidine, alanine and glutamine were down-regulated in chronic AD patients (Fig. 4D). Comparing with chronic AD patients, the level of phenylalanine was up-regulated and the level of glutamate was down-regulated in chronic AD patients (Fig. 4F).
Amino Acids Metabolites in AD Patients Were Identified
The changed amino acids in scatter loading were only been preliminary screened. To further screen out the potential amino acids that specifically indicated AD disease and further AD progression, we calculated the variable importance for the projection (VIP) values from the PLS-DA models. PLS-DA models signified the influence of the amino acids on the classification, and the VIP values > 1.0 represented that the changed amino acids contributed significantly to the clustering. Only those amino acids (VIP > 1.0) with significant difference (P < 0.05) between AD and CHD, or between acute AD and chronic AD groups were selected as potential candidate using one way analysis of variance. Under the criteria of VIP > 1.0 and P < 0.05, 8 amino acids in acute AD and 4 amino acids in chronic AD were identified as potential candidates differentiating AD from CHD. With the same criteria, 2 amino acids were further identified as potential candidates differentiating acute AD from chronic AD (Table 2). To visualize the alterations of the potential amino acids, a heat-map was further generated based on Z-score values (Fig. 5). Among these amino acids identified in acute AD and chronic AD patients, citrate was the only amino acid that altered in both two groups. Comparing with CHD patients, the down-regulation of histidine, glycine, serine, ornithine, hydroxyproline, proline and sarcosine in acute AD group, and GABA in chronic AD patients were detected, and the up-regulation of glutamate and cystine were recognized in chronic AD patients. The decreased level of glutamate and the increased level of phenylalanine were recognized in acute AD patients comparing with chronic AD patients.
Table 2. Identified differential amino acids in human plasma.
| Amino acids | Acute AD versus CHD | Chronic AD versus CHD | Acute AD versus Chronic AD | ||||||
|---|---|---|---|---|---|---|---|---|---|
| VIP | P | FC | VIP | P | FC | VIP | P | FC | |
| His | 1.30 | 0.022 | 0.82 | 1.13 | / | 0.90 | / | / | 0.91 |
| Gly | 1.31 | 0.033 | 0.77 | / | / | 0.94 | / | / | 0.82 |
| Ser | 1.15 | 0.053 | 0.79 | 1.11 | / | 0.87 | 1.00 | / | 0.91 |
| Cit | 1.85 | 0.001 | 0.57 | 1.81 | 0.005 | 0.74 | / | / | 0.77 |
| Orn | 1.30 | 0.020 | 0.69 | / | / | 0.88 | / | / | 0.78 |
| Hyp | 1.28 | 0.022 | 0.58 | 1.28 | / | 0.69 | / | / | 0.84 |
| Pro | 1.29 | 0.009 | 0.73 | / | / | 0.94 | 1.26 | / | 0.78 |
| Sar | 1.36 | 0.027 | 0.60 | 1.16 | / | 0.79 | / | / | 0.76 |
| GABA | 1.59 | / | 0.92 | 1.59 | 0.011 | 0.76 | / | / | 1.21 |
| Glu | 1.42 | / | 0.89 | 1.59 | 0.003 | 1.77 | 2.26 | 0.014 | 0.50 |
| Cys | / | / | 1.08 | 1.50 | 0.016 | 1.67 | / | / | 0.65 |
| Phe | / | / | 1.15 | / | / | 0.93 | 1.67 | 0.031 | 1.25 |
Variable important in projection (VIP) was obtained from PLS-DA with a threshold of 1.0; p-value was calculated from one way ANOVA; Fold change (FC) was calculated as the ratio of the mean amino acid levels between two groups.
Figure 5. Heat-map for key amino acids change color-scaled with z-scores for the human plasma where the warm (red) colored bars denote elevation of amino acids levels, and cold colored (blue) ones indicate a decrease compared to the CHD patients.
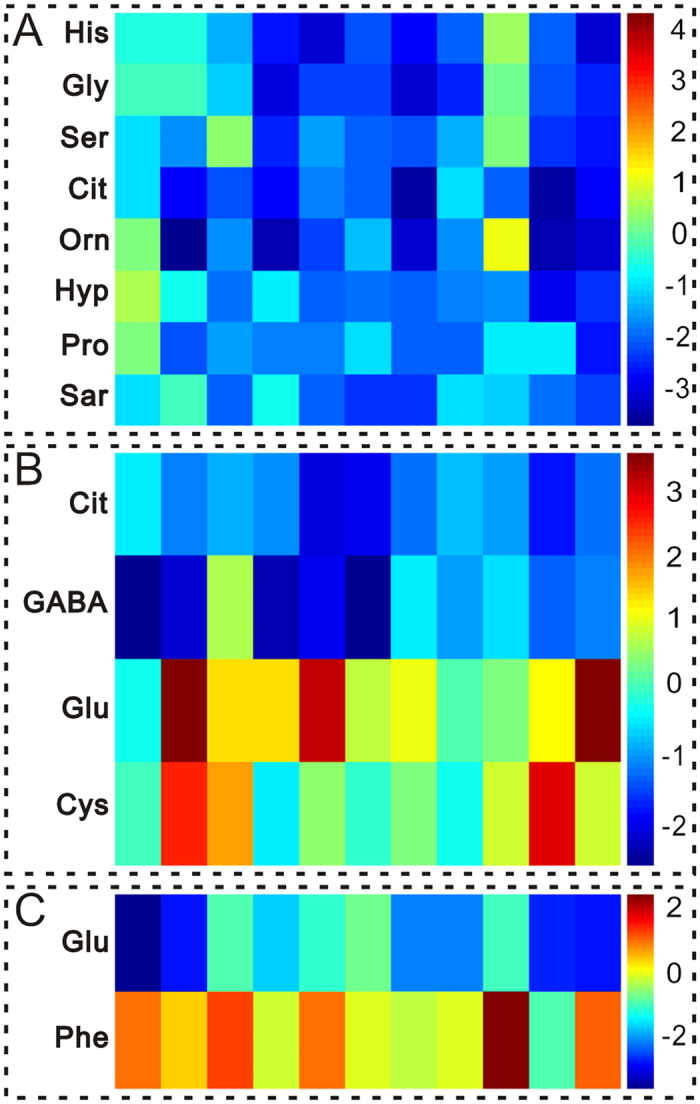
Every amino acid is delegated by a single row of colored boxes, but columns correspond to different samples. Each value was standardized on the basis of the controls (A,B) CHD patients; (C) Chronic AD)) with subtracting mean and dividing by the standard deviation of controls (CHD patients). (A) Acute AD group versus CHD patients; (B) Chronic AD group versus CHD patients. (C) Acute AD group versus Chronic AD group.
Discussion
AD, especially acute AD, is a life-threatening disease that is easily misdiagnosed In the present study, citrate, histidine, glycine, hydroxyproline, proline, serine and cysteine were specific regulated in AD patients comparing with CHD patients. Glutamate and phenylalanine showed differential pattern in acute AD comparing with chronic AD, suggesting both diagnosis and prognostic value of aminogram for AD patients.
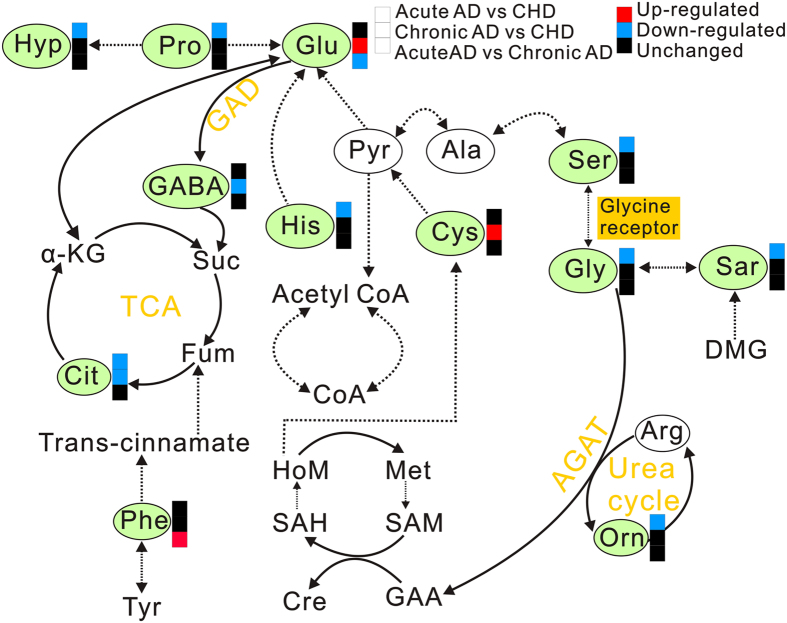
Tricarboxylic acid cycle (TCA cycle), also known as citric acid cycle or Krebs’ cycle, consists of a series of chemical reactions aimed at generating energy (ATP) through oxidation of acetate from carbohydrates, fats and proteins into carbon dioxide and water. The plasma levels of citrate, the important intermediate in TCA cycle, were down-regulated in both AD patients (acute AD and chronic AD) (Fig. 6), indicating the dys-regulation of TCA cycle and impairment on mitochondrial function in both acute AD and chronic AD patients18,19,20.
Figure 6. The metabolic pathways of the most disregulated amino acids in plasma of AD patient.
The tag in green represents the significant change of amino acids. The red boxes denote significant up-regulation of amino acids in Acute AD and Chronic AD groups compared with CHD group, while the blue boxes represent significant down-regulation. The black boxes denote no significant change.
As a semi-essential amino acid, histidine is necessary for infant and uremic patients21. Histidine can be converted to glutamate, and then via deamination to produce α-ketoglutaric acid for use in TCA cycle (Fig. 6). However, the level of glutamate was no significant change in acute AD group, so the down-regulation of histidine was not a prerequisite for the inhibition of TCA. On the other hand, histidine can be converted into histamine under the action of histidine decarboxylase, and histamine shows strong effect on vasodilation22. In our study, the down-regulated histidine in acute AD patients may reduce the formation of histamine and further influence the function of aorta. The detail regulation of histidine-histamine pathway and its role in AD need more research to evaluate.
Glycine is synthesized from threonine through inter-organ metabolism of amino acids (Fig. 6), and it is also the precursor of many important metabolites (e.g., creatine, purines, heme and glutathione). Serine hydroxymethyl transferase converts serine into glycine and vice versa (Fig. 6). And sarcosine can be converted into glycine by sarcosine dehydrogenase (Fig. 6)23. The decrease on the content of serine and sarcosine in acute AD patients may possibly become one of the important factors inducing the decline of glycine. Glycine exhibits sorts of biological characteristics, containing anti-oxidative, metabolic regulation, immunomodulatory and cytoprotective characteristics24,25,26,27. In response to diseases and malnutrition such as diabetes and starvation, plasma glycine significantly decreased28,29. Gómez-Zamudio and co-workers also demonstrated that glycine could improve the endothelium function in aged rats30. In our study, glycine declined in acute AD patients, potentially indicating the possible relation between endothelium dysfunction and glycine metabolism disorder.
Hydroxyproline is generated by proline through proline hydroxylase, and proline is a peculiar amino acid in collagen (Fig. 6)31. Collagen synthesis requires posttranslational modifications of procollagens, including hydroxylation32 Collagen is the key support material to maintain vascular structures. As an important component of collagen, the level of proline was down-regulated in acute AD patients. Proline deficient might induce obstacles to collagen synthesis, and further led to the reconstruction and damage on the vascular structures.
Remarkably, the change of cysteine is specific in chronic AD patients. Cysteine can be directly taken off sulfydryl and amino to generate pyruvate, which can form acetyl-CoA through oxidative decarboxylation, and then be further converted to glutamate (Fig. 6). As a metabolite in homocysteine metabolism, the cysteine and homocysteine play vital roles in living organism33. Homocysteine is the amino acid directly related to vessel disease. Furthermore, homocysteine was also increased not only in Marfan patients, but also increased in patients with acute aortic dissection and chronic thoracic aoryic aneurysms34,35,36 Plasma homocysteine exists in three major forms, with trace amounts (1%) existing in the reduced form. Approximately 70% is bound to albumin, and the remaining 30% forms low molecular weight disulfides predominantly with cysteine. The sum of all these homocysteine species is termed total homocysteine (tHcy). Reducing reagent is necessary for plasma treatment to detect the concentration of homocysteine, while we were concerned to detect more amino acids with significant changes for AD patients and did not perform special treatment on plasma samples. We hope to optimize the experimental conditions to catch more amino acids with significant change in the future.
Through metabolomic analysis, we found that the significant changed amino acids were histidine, glycine, serine, citrate, ornithine, hydroxyproline, proline and sarcosine in acute AD patients; and citrate, GABA, glutamate and cysteine in chronic AD patients. The significant changed amino acids were glutamate and phenylalanine in acute AD patients comparing with chronic AD patients. These amino acids play an important role in maintaining the stability of energy metabolism, endothelial function and vascular structure, indicating that the amino acid profile is expected to provide a powerful support for the diagnosis and prognosis of AD.
Conclusions
In conclusion, our work showed the significant distinct amino acids profiles in plasma samples from AD, acute AD or chronic AD comparing with CHD, as well as between acute AD and chronic AD; suggesting that amino acids profiling could possibly provide a sensitive, feasible diagnostic value for AD patients.
Additional Information
How to cite this article: Wang, L. et al. Plasma Amino Acid Profile in Patients with Aortic Dissection. Sci. Rep. 7, 40146; doi: 10.1038/srep40146 (2017).
Publisher's note: Springer Nature remains neutral with regard to jurisdictional claims in published maps and institutional affiliations.
Supplementary Material
Acknowledgments
This work was supported by Shanghai Science and Technology Development Foundation (14401900900), International Cooperation Bureau of the Chinese Academy of Sciences for Key Projects of Foreign Cooperation (GJHZ1616), Croucher Foundation (CAS14201) and National Natural Science Foundation of China Grants (81573646).
Footnotes
Author Contributions Baohong Jiang and Song Xue conceived and designed the experiments; Sha Liu, Haitao Yu, Li Zhang, Peng Wu and Xue Li collected the samples; Wengang Yang and Ping Ma tested the samples; Linlin Wang and Kenka Cho analyzed the data; Linlin Wang and Baohong Jiang wrote the paper.
References
- Eggebrecht H. et al. Retrograde ascending aortic dissection during or after thoracic aortic stent graft placement: insight from the European registry on endovascular aortic repair complications. Circulation. 120, S276–S281 (2009). [DOI] [PubMed] [Google Scholar]
- Ramzisham A. R., Arief H., Ngoo K. S., Zamrin D. M. & Joanna O. S. Acute aortic dissection at two extreme ages. Clin Ter. 162, 553–554 (2011). [PubMed] [Google Scholar]
- Huang C. et al. Computed tomography-based study exploring the feasibility of endovascular treatment of type A aortic dissection in the Chinese population. J. Endovasc Ther. 21, 707–713 (2014). [DOI] [PubMed] [Google Scholar]
- Chaikriangkrai K. et al. Magnetic resonance imaging of a scimitar vein and aortic dissection. Methodist Debakey Cardiovasc J. 10, 257 (2014). [DOI] [PMC free article] [PubMed] [Google Scholar]
- Vural U. et al. Unusual complication of aortic dissections: intimo-intimal intussusceptions. Cardiovasc J. Afr. 26, e15–e18 (2015). [DOI] [PMC free article] [PubMed] [Google Scholar]
- Brosnan J. T. Interorgan amino acid transport and its regulation. J. Nutr. 133, S2068–S2072 (2003). [DOI] [PubMed] [Google Scholar]
- Pastore A. et al. Plasma levels of homocysteine and cysteine increased in pediatric NAFLD and strongly correlated with severity of liver damage. Int J. Mol Sci. 15, 21202–21214 (2014). [DOI] [PMC free article] [PubMed] [Google Scholar]
- Creelan B. C. et al. Indoleamine 2,3-dioxygenase activity and clinical outcome following induction chemotherapy and concurrent chemoradiation in Stage III non-small cell lung cancer. Oncoimmunology. 2, e23428 (2013). [DOI] [PMC free article] [PubMed] [Google Scholar]
- Barnes T. et al. Plasma amino acid profiles of breast cancer patients early in the trajectory of the disease differ from healthy comparison groups. Appl Physiol Nutr Metab. 39, 740–744 (2014). [DOI] [PubMed] [Google Scholar]
- Ma H., Hasim A., Mamtimin B., Kong B., Zhang H. P. & Sheyhidin I. Plasma free amino acids profiling of esophageal cancer using high-performance liquid chromatography spectroscopy. World J. Gastroenterol. 20, 8653–8659 (2014). [DOI] [PMC free article] [PubMed] [Google Scholar]
- Wang J. et al. Metabolomic profiling of anionic metabolites in head and neck cancer cells by capillary ion chromatography with Orbitrap mass spectrometry. Anal Chem. 86, 5116–5124 (2014). [DOI] [PubMed] [Google Scholar]
- Cascino A. et al. Plasma amino acid imbalance in patients with lung and breast cancer. Anticancer Res. 15, 507–510 (1995). [PubMed] [Google Scholar]
- Nicholson J. K. & Lindon J. C. Systems biology: Metabonomics. Nature. 455, 1054–1056 (2008). [DOI] [PubMed] [Google Scholar]
- Gonzalez E. et al. Serum UPLC-MS/MS metabolic profiling in an experimental model for acute-liver injury reveals potential biomarkers for hepatotoxicity. Metabolomics. 8, 997–1011 (2012). [DOI] [PMC free article] [PubMed] [Google Scholar]
- Liu X. Y. et al. Metabonomic study on the anti-osteoporosis effect of Rhizoma Drynariae and its action mechanism using ultra-performance liquid chromatography–tandem mass spectrometry. J. Ethnopharmacol. 139, 311–317 (2012). [DOI] [PubMed] [Google Scholar]
- Tsioufis C. P., Kallikazaros I. E., Toutouzas K. P., Stefanadis C. I. & Toutouzas P. K. Exaggerated carotid sinus massage responses are related to severe coronary artery disease in patients being evaluated for chest pain. Clin Cardiol. 25, 161–166 (2002). [DOI] [PMC free article] [PubMed] [Google Scholar]
- Wang L. L. et al. Metabonomic profiling of serum and urine by (1) H NMR-based spectroscopy discriminates patients with chronic obstructive pulmonary disease and healthy individuals. PLoS One. 8, e65675 (2013). [DOI] [PMC free article] [PubMed] [Google Scholar]
- Waters N. J., Waterfield C. J., Farrant R. D., Holmes E. & Nicholson J. K. Metabonomic deconvolution of embedded toxicity: application to thioacetamide hepato- and nephrotoxicity. Chem Res Toxicol. 18, 639–654 (2005). [DOI] [PubMed] [Google Scholar]
- Rachakonda V. et al. Serum metabolomics profiling in acute alcoholic hepatitis identifies multiple dysregulated pathways. PLoS One. 9, e113860 (2014). [DOI] [PMC free article] [PubMed] [Google Scholar]
- Cong W. J. et al. Metabonomic study on the cumulative cardiotoxicity of a pirarubicin liposome powder. Talanta. 89, 91–98 (2012). [DOI] [PubMed] [Google Scholar]
- Kopple J. D. & Swendseid M. E. Effect of histidine intake of plasma and urine histidine levels, nitrogen balance and N tau-methylhistidine excretion in normal and chronically uremic men. J. Nutr. 111, 931–942 (1981). [DOI] [PubMed] [Google Scholar]
- Ignesti G. et al. Increased desensitization by picomolar phorbol ester of the endothelium-mediated effect of histamine in the perfused rat mesenteric bed. Inflamm Res. 45, 171–175 (1996). [DOI] [PubMed] [Google Scholar]
- Sreekumar A. et al. Metabolomic profiles delineate potential role for sarcosine in prostate cancer progression. Nature. 457, 910–914 (2009). [DOI] [PMC free article] [PubMed] [Google Scholar] [Research Misconduct Found]
- Alhasawi A., Castonguay Z., Appanna N. D., Auger C. & Appanna V. D. Glycine metabolism and anti-oxidative defence mechanisms in Pseudomonas fluorescens. Microbiol Res. 171, 26–31 (2015). [DOI] [PubMed] [Google Scholar]
- Chen Q. M. et al. GC/MS-based metabolomic studies reveal key roles of glycine in regulating silk synthesis in silkworm, Bombyx mori. Insect Biochem Mol Biol. 57, 41–50 (2015). [DOI] [PubMed] [Google Scholar]
- Wuerfel E., Bien C. G., Vincent A., Woodhall M. & Brockmann K. Glycine receptor antibodies in a boy with focal epilepsy and episodic behavioral disorder. J Neurol Sci. 343, 180–182 (2014). [DOI] [PubMed] [Google Scholar]
- Howard A. & Hirst B. H. The glycine transporter GLYT1 in human intestine: expression and function. Biol Pharm Bull. 34, 784–788 (2011). [DOI] [PubMed] [Google Scholar]
- Satterfield M. C., Dunlap K. A., Keisler D. H., Bazer F. W. & Wu G. Y. Arginine nutrition and fetal brown adipose tissue development in nutrient-restricted sheep. Amino Acids. 45, 489–499 (2013). [DOI] [PubMed] [Google Scholar]
- Satterfield M. C., Dunlap K. A., Keisler D. H., Bazer F. W. & Wu G. Y. Arginine nutrition and fetal brown adipose tissue development in dietinduced obese sheep. Amino Acids. 43, 1593–1603 (2012). [DOI] [PubMed] [Google Scholar]
- Gómez-Zamudio J. H. et al. Vascular endothelial function is improved by oral glycine treatment in aged rats. Can J. Physiol Pharmacol. 93, 465–473 (2015). [DOI] [PubMed] [Google Scholar]
- Nelson D. L. & Cox M. M. Lehninger’s Principles of Biochemistry (4th Edition). New York, USA: Cell Biochemistry and Function Publisher, 2005. [Google Scholar]
- Zhang C. et al. Role of NonO-histone interaction in TNF alpha-suppressed prolyl-4-hydroxylase alpha1. Biochim Biophys Acta. 1783, 1517–1528 (2008). [DOI] [PMC free article] [PubMed] [Google Scholar]
- Wood Z. A., Schröder E., Robin Harris J. & Poole L. B. Structure, mechanism and regulation of peroxiredoxins. Trends Biochem Sci. 28, 32–40 (2003). [DOI] [PubMed] [Google Scholar]
- Takagi H. & Umemoto T. Homocysteinemia is a risk factor for aortic dissection. Med Hypotheses. 64, 1007–1010 (2005). [DOI] [PubMed] [Google Scholar]
- Heil S. G. et al. Marfanoid features in a child with combined methylmalonic aciduria and homocystinuria (CblC type). J Inherit Metab Dis. 30, 811 (2007). [DOI] [PubMed] [Google Scholar]
- Giusti B. et al. Phenotypic variability of cardiovascular manifestations in Marfan Syndrome. Possible role of hyperhomocysteinemia and C677T MTHFR gene polymorphism. Eur Heart J. 24, 2038–2045 (2003). [DOI] [PubMed] [Google Scholar]
Associated Data
This section collects any data citations, data availability statements, or supplementary materials included in this article.


