
Fig. 3.
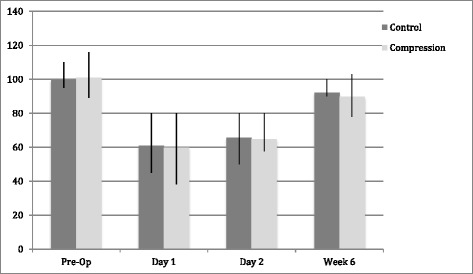
Bar chart to show mean total range of motion (degrees) of the leg pre- and post-total knee arthroplasty. Error bars represent inter-quartile range. No statistical significance was found between groups at any time point
Official websites use .gov
A
.gov website belongs to an official
government organization in the United States.
Secure .gov websites use HTTPS
A lock (
) or https:// means you've safely
connected to the .gov website. Share sensitive
information only on official, secure websites.
Bar chart to show mean total range of motion (degrees) of the leg pre- and post-total knee arthroplasty. Error bars represent inter-quartile range. No statistical significance was found between groups at any time point