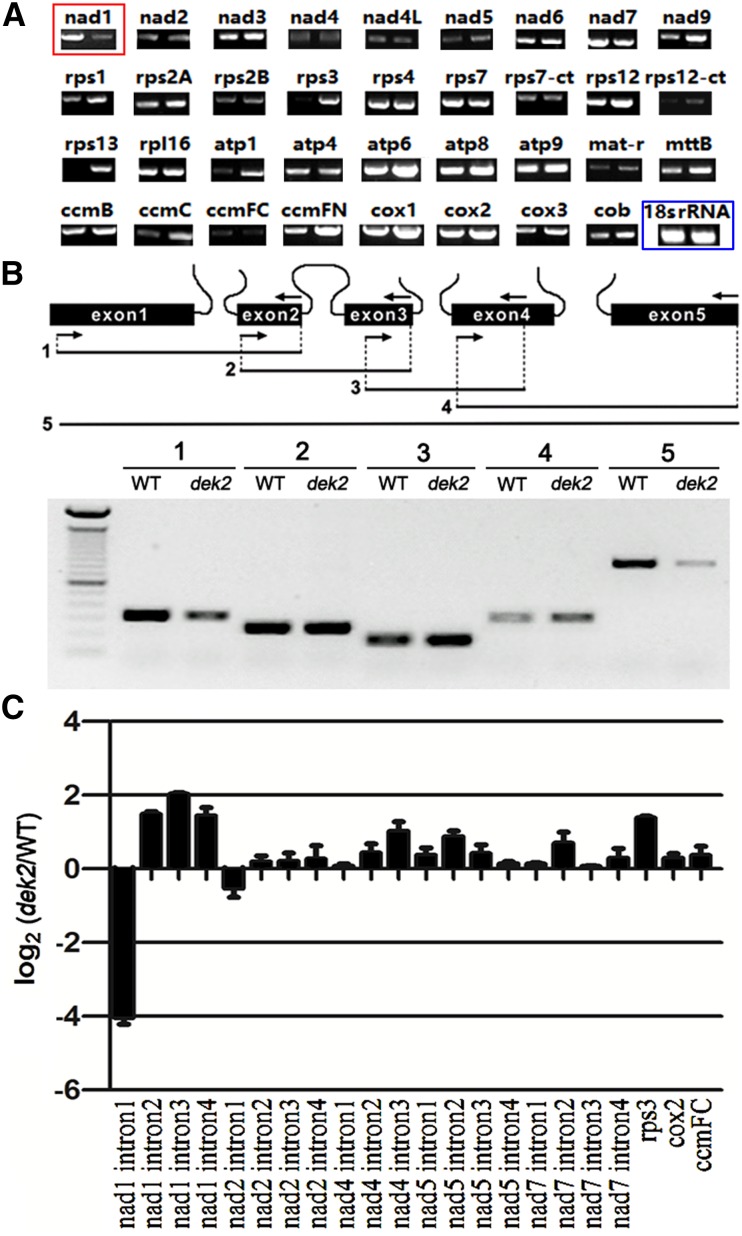
Figure 5.
The decrease of nad1 mature transcript and the splicing deficiency of nad1 intron 1 in dek2. (A) RT-PCR analysis of 35 mitochondria-encoded transcripts in 18 DAP WT (left) and dek2 (right) endosperm. The RNA was isolated from the same ear segregating for WT and dek2 mutants.The 18s rRNA served as internal control. Red square identifies nad1 with decreased transcript abundance; blue square identifies internal control. (B) RT-PCR analysis of nad1 intron-splicing efficiency in the WT and dek2 mutant. Structure of the maize mitochondrial nad1 gene. Intron 1 is a trans-spliced intron. The expected amplification products using different primer pairs are indicated. The PCR products were confirmed by sequencing. (C) qRT-PCR analysis of all 22 group II introns in maize mitochondrial genes. Primers spanned adjacent exons, and differences in each spliced fragment were measured. Values are the mean values with SE, n = 3 individuals.

